
Abstract
The thermal safety of lithium-ion (Li-ion) batteries for electric vehicles continues to remain a major concern. A comprehensive understanding of the thermal runaway (TR) mechanisms in Li-ion cells and modules due to intrinsic factors such as state-of-charge (SOC) and cell-to-cell arrangement under abuse scenarios such as external heating is critical toward the development of advanced battery thermal management systems. This study presents a hierarchical TR modeling framework to examine the TR behavior of Li-ion cells at various SOCs and probe its implications on the thermal runaway propagation (TRP) in a battery module. We perform accelerating rate calorimetry (ARC) experiments with 3.25 Ah cylindrical Li-ion cells at different SOCs and demonstrate the strong SOC dependence of TR characteristics such as the onset temperature, maximum cell temperature, and self-heating rate. The thermo-kinetic parameters extracted from the ARC experiments are used to develop a TR model that captures the SOC-induced TR response in Li-ion cells. The mechanistic information from the cell-level model is used to examine the pathways for TRP in a battery module consisting of cells with uniform and imbalanced SOCs, thereby demonstrating the underlying role of SOC variability on the resulting TRP under abuse conditions.
Export citation and abstract BibTeX RIS

This is an open access article distributed under the terms of the Creative Commons Attribution 4.0 License (CC BY, http://creativecommons.org/licenses/by/4.0/), which permits unrestricted reuse of the work in any medium, provided the original work is properly cited.
Over the past three decades, lithium-ion (Li-ion) batteries have gained tremendous success in powering portable electronics, medical devices, and electric vehicles. 1–4 The global market share of Li-ion batteries was valued at $46.2 billion in 2022 and is projected to reach $189.4 billion by 2032, owing to the urgent need for widespread electrification. 5,6 Li-ion batteries that utilize lithium nickel-cobalt-aluminum oxide, i.e., LiNixCo1−x−yAlyO2, (NCA) cathodes have offered high energy densities and long life, 7,8 promising applicability for a wide range of applications. 9,10 However, the development of energy-dense Li-ion batteries coupled with emergent requirements such as extreme fast charging 11,12 induces critical safety challenges such as the propensity to undergo thermal runaway (TR) under off-nominal and abuse scenarios and electrode-level thermal instabilities. 13,14 For instance, the hazard-potential ranking of Li-ion batteries with different cathode chemistries reveals that NCA cathodes exhibit the highest maximum temperature, maximum self-heating rate, maximum pressure, and enthalpy change under TR. 15,16 Thus, it is crucial to develop a comprehensive understanding of the mechanisms affecting the thermal stability and safety characteristics of Li-ion batteries for the NCA cathode chemistry.
The state-of-charge (SOC) of a Li-ion cell is an important factor that determines the TR response, as it affects the amount of stored electrical energy 17 and the thermal stability of the individual electrode materials. 18,19 Under abuse scenarios, higher SOCs result in an earlier onset of TR while exhibiting a higher exothermic severity. 20,21 Critical TR descriptors, such as the input thermal energy and initial temperature required to instigate TR, decrease with an increase in SOC. 22 Importantly, since Li-ion cells with higher SOCs exhibit a larger energy release with TR, they can significantly impact the thermal response of neighboring cells in a Li-ion battery module. 23 Thus, synergistic SOC control could mitigate the combustion and thermal runaway propagation (TRP) hazards in the battery module. 24 Previous experimental studies 23,25 have determined the critical SOC limit for different inter-cell spacings and heating energies to inhibit TRP in a battery module. For the evaluation of battery safety, it is imperative to understand the evolution of SOC as it can affect the TR behavior and its subsequent propagation to neighboring cells in the module.
Prior studies have developed computational models 26,27 to understand the implications of cell configuration, 28,29 convective heat transfer conditions, 30,31 anode morphology, oven temperature, 32 electrolyte effects, 33 and venting response 34 on the TR behavior. 35–37 To complement these models, a comprehensive kinetic analysis of the underlying exothermic reactions is necessary to predict the cell-level TR events accurately. 38 Such kinetic parameters associated with the exothermic reactions are often quantified 26,27 using thermal signatures of the individual electrode materials obtained from techniques such as differential scanning calorimetry (DSC) 30,39 and accelerating rate calorimetry (ARC). 38 For instance, Chen et al. 40 introduced a mathematical framework to establish a TR model from the ARC signature of lithium-nickel-manganese-cobalt-oxide (NMC) based Li-ion cells. The adiabatic TR process was segmented into several stages based on the changes in the ARC temperature rate profiles, and the reaction kinetics for each stage were delineated to construct a cell-level TR model, mimicking the experimental ARC process. 41
The thermal stability of NCA-based Li-ion cells under different SOCs has recently been investigated. Temperature-ramp tests by Golubkov et al. 42 on NCA-based Li-ion cells ranging from uncharged to overcharged conditions demonstrated severe TR with a maximum temperature of 1075 °C and released high amounts of carbon monoxide (CO) and hydrogen (H2) gases. The self-heating temperatures of NCA-based Li-ion cells are reported to range from 51 °C to 100 °C depending on the cell format and SOC. 43 Furthermore, material-level tests of NCA-based cells at different SOCs using thermogravimetric analysis/DSC and temperature-resolved X-ray diffraction have shown that an increase in SOC results in a reduction in the TR onset temperature and an increase in the peak heating rate due to destabilization of the cathode. 44,45 The layered structure of NCA cathodes is unstable and releases high rates of oxygen and heat rapidly upon heating, exhibiting high TR rates. 19 In summary, while prior studies have shown the occurrence of TR in NCA-based Li-ion cells, a comprehensive analysis of the underlying thermo-kinetic characteristics and their influence ranging from the cell-level to the battery module is still required. Furthermore, building on this understanding of the NCA chemistry, the role of cell-level SOC on the propensity for TRP in Li-ion battery modules should be evaluated.
This study develops a hierarchical TR modeling framework to investigate the mechanistic onset of TR in Li-ion cells at various SOCs and synergistically probe its implications on the TRP characteristics in a battery module. In addition to analyzing the TR behavior at the two cell-level SOC extremes, we have chosen two more points that would be representative of intermediate SOCs. To this end, we performed ARC experiments with 3.25 Ah LiNi0.8Co0.15Al0.05O2 (NCA)-based cylindrical Li-ion cells at different SOCs (i.e., 3%, 33%, 66%, and 100%) to delineate the thermo-kinetic attributes associated with the exothermic interactions in the TR process. Through the ARC experiments, the strong correlation between the SOC and TR characteristics at the cell-level, including the rate of temperature rise during TR, the onset temperature for self-heating, and the maximum temperature, is demonstrated. The thermo-kinetic parameters extracted from the ARC signatures are used to develop a cell-level TR model capable of capturing the TR response at different SOCs. In addition, the TR model is used to virtually simulate and analyze the thermal stability of NCA-based cells in an oven test environment. Lastly, the mechanistic information from the cell-level model is used to examine the TRP in a Li-ion battery module consisting of individual cells with uniform and imbalanced SOCs. The SOC imbalance in a Li-ion battery module dictates the variability in TRP rates and the thermal energy required to instigate TRP. The findings from this study are expected to facilitate the design of future battery thermal management systems and mechanistic cooling strategies that can mitigate cell-to-cell TRP in Li-ion battery modules.
Methodology
Electrochemical cycling to different SOCs
Four 3.25 Ah 18650 cylindrical Li-ion cells were electrochemically cycled two times using a standard protocol (described below) and then discharged to different SOCs. In each cycle, the cell was charged to 4.2 V under a constant-current (CC) mode at 0.5 C (1.625 A), followed by a constant-voltage (CV) charge phase at 4.2 V until the current declined to 0.02 C (0.065 A). After a 30-minute rest period, the cell was CC discharged to 2.5 V at 0.2 C (0.65 A). A discharge current pulse of 1.5 C (4.875 A) for 0.1 s was applied at 50% SOC in the discharge phase of the second cycle to determine the internal resistance of the cell. A T-type thermocouple was attached near the positive terminal of each cell to detect the temperature variation. Figure SF1a in the Supplementary Information shows the typical cell voltage and temperature response during this protocol. All four cells were recharged to 100% SOC using the same charging protocol as the standard test. After a 30 min rest phase, three of these cells were discharged at 0.2 C (0.65 A) to 3%, 33%, and 66% SOC, as shown in Fig. SF1b in Supplementary Information. The open circuit voltage (OCV) of these cells was allowed to stabilize before conducting the ARC experiments.
ARC-based thermal signatures
The NCA-based Li-ion cells at different SOCs were subject to an ARC test using the heat-wait-seek (HWS) protocol. The parameters of the ARC experimental setup are summarized in Table I. The OCV of each cell was monitored in-operando to understand the correlation between the occurrence of internal short circuit (ISC), thermal instability of the separator, and the onset of potential TR in the cell.
Table I. Parameters of the ARC experimental setup.
| Descriptions | Values |
|---|---|
| Start temperature of the heat-wait-seek process [°C] | 50 |
| End temperature of the heat-wait-seek process [°C] | 300 |
| Temperature step of the heat-wait-seek process [°C] | 5 |
| Temperature rate sensitivity [°C/min] | 0.02 |
| Wait step time [min] | 20 |
| External ambient temperature [°C] | 25 |
Computational Modeling
Various stages in the cell-level TR process
The cell-level TR process can be demarcated into different stages, with each stage denoting a distinct exothermic response. In this study, the TR phenomenon is segmented into four stages depending on the rate of temperature rise observed in the ARC experiments. Three characteristic temperatures, T1, T2, and T3, are identified where T1 denotes the onset of self-heating when the rate of temperature increase exceeds 0.02 °C min−1, T2 represents the beginning of TR when the rate of temperature rise exceeds 100 °C min−1, and T3 denotes the peak temperature encountered during the adiabatic TR. In the temperature range between T1 and T2, the temperature rate profile is divided into three stages (i.e., denoted by Stages 1, 2, and 3). Stage 1 denotes self-heating onset and comprises slow exothermic interactions, primarily driven by the SEI decomposition reaction. 46 During Stage 2, a combination of exothermic reactions such as the formation of secondary SEI (due to the interaction between intercalated lithium in the anode and electrolyte) and its subsequent decomposition reaction occur, 42,45 causing a larger rate of temperature increase than Stage 1. In addition, the exothermic reactions in Stage 2 release a large amount of gas, which increases the cell's internal pressure and causes significant swelling. Upon reaching a threshold pressure value due to gas accumulation, the safety vent of the cell opens to release a large amount of gas that causes a sudden decrease in cell temperature. Moreover, a series of chemical reactions such as cathode decomposition, phase transition, and oxygen liberation will occur inside the cell during Stage 3, resulting in an enormous heat generation and a large rate of temperature rise around 200 °C. 38,47 Concomitantly, the separator melts, shrinks, and vaporizes to cause an ISC. 17 Once the cell temperature rate reaches T2, the electrical energy released from ISC can cause electrolyte decomposition and combustion, and decomposition reactions of the binder and additives (Stage 4), releasing a significant amount of heat and posing potential TR hazards like fire and explosion.
Thermo-kinetic characteristics derived from ARC signature
The reaction rate corresponding to the exothermic interactions during various stages of the TR process can be described using the Arrhenius equation:

Here  denotes the reactant concentration,
  denotes the temperature at time
 is frequency factor,
  is the activation energy,
  denotes the reaction order, and the subscript
  denotes the TR stage. During an ARC test which represents an adiabatic environment for the cell, the heat generation rate is proportional to the consumption of the reactant. Therefore, for each stage in the TR process,

Here  denotes the reactant mass, and
  denotes the exothermic reaction enthalpy. The total mass of the cell is
  and the specific heat capacity is denoted by
For any TR stage, integrating Eq. 2 from  (start time) to
  where the temperature changes from
  to
to  and the reactant concentration changes from
 ![${c}_{i}\left[{t}_{0}\right]$](https://content.cld.iop.org/journals/1945-7111/171/1/010529/revision3/jesad1eccieqn16.gif) to
to  we have:

At the end of the heat generation for any specific stage, the cell temperature rises to  and the reactant concentration is
  = 0. Therefore,


Differentiating Eq. 5 with respect to time 

Incorporating Eqs. 2 and 5 into Eq. 6 and taking the natural logarithm, we have:
Assuming a first-order reaction, Eq. 8 is simplified to

The pre-exponential factor,  and activation energy
  of the exothermic reaction for each stage can be determined by calculating the slope and intercept of the linear relationship between
![$\left[\displaystyle \frac{dT}{dt}/\left({T}_{e,i}-T\left(t\right)\right)\right]$](https://content.cld.iop.org/journals/1945-7111/171/1/010529/revision3/jesad1eccieqn24.gif) and
and  It is noted that
  is different at various stages of the TR process.
For Stages 1 to 3, the exothermic heat generation rate is given as follows:

For Stage 4, the heat generation is calculated based on the total energy released from the cell during the TR process. 48 While the mass and specific heat of the cell does not change significantly during the first three stages of the TR, there can be a significant mass loss and change in the specific heat capacity of the cell during Stage 4 (after the cell temperature reaches T2) due to gas venting. During Stage 4, the change in enthalpy has been fitted to capture the temperature response during the ARC experiment. Therefore, for the last stage (Stage 4), the exothermic heat generation is given as follows:

Here,  denotes the heat energy released during Stage 4, and
  represents the time interval between the release of exothermic heat energy and the occurrence of TR.
Thus, the heat generated from the exothermic reactions in all the TR stages, denoted by  can be described as follows:
Simulated ARC signature
The developed TR modeling framework captures the ARC response for an 18650 NCA-based Li-ion cell, following the HWS protocol. The cell temperature evolves based on the energy conservation equation:

Here,  is the overall heat transfer coefficient (both convection and radiation) between the cell and the ARC chamber,
  is the surface area of the cell, and
  denotes the temperature of the ARC chamber. The modeling parameters for the ARC simulations are summarized in Table II.
Table II. Model parameters for the simulated ARC signature and oven test.
| Symbols | Descriptions | Values | References |
|---|---|---|---|

| Mass of the cell [g] | 48.5 | 36 |

| Specific heat capacity of the cell [J/g-K] | 0.83 | 36 |

| Surface area of cell [cm2] | 36.75 | 36 |

| Overall heat transfer coefficient in ARC test [W/m2-K] | 30 | Estimated |

| Convective heat transfer coefficient in oven test [W/m2-K] | 5 | 26 |

| Cell emissivity [-] | 1.0 | 26 |
Simulated oven test response
For the oven test simulation of the 18650 Li-ion cells, an energy conservation equation in accordance with the formulation used by Hatchard and Dahn 26 was employed in this study:

Here,  denotes the surrounding temperature in the oven and
  denotes the overall heat transfer coefficient, representing a combination of the convection and radiation effects. The convective heat transfer coefficient is assumed to be 5 W m−2-K,
26,30
and depicts natural convection around the cell in a heated oven. The radiation heat transfer coefficient from the cell surface is based on the cell emissivity and oven temperature (
denotes the overall heat transfer coefficient, representing a combination of the convection and radiation effects. The convective heat transfer coefficient is assumed to be 5 W m−2-K,
26,30
and depicts natural convection around the cell in a heated oven. The radiation heat transfer coefficient from the cell surface is based on the cell emissivity and oven temperature ( ). Therefore,

where  is the emissivity of the cell, and
  is the Stefan-Boltzmann constant. The modeling parameters for the oven simulations are summarized in Table II.
Thermal runaway propagation in Li-ion battery modules
Based on a lumped thermal model, the temperature  of each cylindrical Li-ion cell in a 3 × 3 battery module can be expressed as:

Here,  represents the rate of heat generation in the cell due to TR,
  denotes the heat dissipation rate and
  denotes the heating power or heat input rate to the cell from the heater to trigger TR in the module. The value of
  = constant for the trigger cell and
  = 0 for the rest of the Li-ion cells in the module. The heat input to the trigger cell to cause TR is considered to be provided by a heating tape (wrapping the trigger cell) of constant heating power. The mass and the specific heat of the cell are assumed to be constant, and due to the low Biot number (
 = 0.056) corresponding to the cylindrical cell configuration in this study,
26,49
the temperature gradients within the cell have not been considered.
= 0.056) corresponding to the cylindrical cell configuration in this study,
26,49
the temperature gradients within the cell have not been considered.
The heat dissipation from each cell in the Li-ion module is given by:


Here,  represents the conduction heat transfer between the cells (through stagnant air),
  is the radiation heat transfer between cells,
  is the conduction heat transfer through the connecting tabs,
  is the convection heat transfer from the cell to the air surrounding the cells, and
  is the radiation heat transfer from the cell to the surrounding air.
50
A detailed description of the modeling approach to capture these different heat transfer modes has been presented in the Supplementary Information.
is the radiation heat transfer from the cell to the surrounding air.
50
A detailed description of the modeling approach to capture these different heat transfer modes has been presented in the Supplementary Information.
Results and Discussion
ARC experiments to understand cell-level TR characteristics
The physical state of the Li-ion cells and the unwound jelly roll after TR for the four SOC conditions is shown in Figs. SF3a–SF3d of the Supplementary Information. The severity of the TR process is higher as the SOC increases from 3% to 100%. The jelly roll for the 3% and 33% SOC cases remains unbroken and delaminated. The electrodes of the cells at 66% and 100% SOCs suffered significant structural damage with only charred carbon remaining, making it difficult to unfold the jelly roll. Figures 1a–1e depicts the ARC test results of the NCA-based Li-ion cells at 100%, 66%, 33%, and 3% SOC. The corresponding in-operando voltage profiles during the TR process are shown in Figs. SF4a–SF4d of the Supplementary Information. Amongst the four cases, the cell at 100% SOC shows the lowest temperature for self-heating onset (i.e., 72.67 °C), denoting a strong thermal instability signature at the anode-electrolyte interface and SEI decomposition interactions between the fully lithiated graphite and electrolyte. 14 The 100% SOC cell undergoes TR at the lowest temperature of 203.29 °C due to potential destabilization of the cathode, 19 and the cell temperature reaches a maximum value of 759.61 °C accompanied by a drop in the cell voltage to 0 V. In contrast, the cell at 66% SOC shows a higher onset temperature for self-heating (i.e., 86.93 °C) with TR occurring at 216.26 °C. It demonstrates a lower maximum temperature of the cell (i.e., 713.70 °C) compared to the 100% SOC case, indicating less energy release during the TR process. Interestingly, the cell at 33% SOC presents an onset temperature for self-heating at 86.46 °C, which is very close to that obtained for the cell at 66% SOC. This subsequently results in TR at 236.14 °C, demonstrating a higher T2 than the cell at 66% SOC. The maximum temperature of the cell at 33% SOC is 566.52 °C, which suggests reduced energy release during TR than the previous cases. The cell at 3% SOC exhibits an exotherm at 87.69 °C, similar to the cell at 33% SOC. Temperature T2 is not encountered for the lowest SOC case, and it reaches a maximum temperature of 300.75 °C. As expected, the cell at 3% SOC does not undergo TR and demonstrates the minimum thermal safety hazard, indicated by the highest onset temperature for self-heating and the least maximum temperature. The spider chart in Fig. 1c summarizes all the cell-level TR characteristics at different SOCs. A comparison of the heat generated during the TR process for the four SOC cases is shown in Fig. 1d, showing a non-linear variation from 8.5 kJ to 27.4 kJ as the SOC increases from 3% to 100%. The cell mass before and after TR for the four SOCs is shown in Fig. 1e. The 3% SOC case depicts the lowest mass loss (∼10%), while the 100% SOC shows the highest mass loss (∼35%) as a result of the TR process. The larger mass loss could be due to the significant amount of heat generated, which in turn leads to higher cell temperatures and venting during the TR process. 51

Figure 1. (a) The temperature evolution and the (b) rate of temperature increase observed in the ARC experiments. (c) The characteristic TR temperature and signatures, (d) total heat generation, and (e) the loss in cell mass under different SOCs during the TR process.
Download figure:
Standard image High-resolution imageBased on the ARC experiments, we infer that the onset temperature of exothermic reaction (T1) in NCA-based Li-ion cells is not monotonically dependent on the SOC since the 3%, 33%, and 66% SOC cases have almost the same T1. A reduced T1 value is only detected for the cell with 100% SOC. In addition, the time at which complete TR occurs is not directly proportional to the SOC, as we observe a later TR onset for the 100% SOC cell than the 66% and 33% SOC cells. This is because the cells with 66% and 33% SOC experienced an extended heating period before T1, leading to a faster TR onset than the cell at 100% SOC. We note that the in-operando voltage profile correlates with micro ISC and the opening of safety vents in the cells during the TR process. The initial drop in the cell voltage relates to the micro ISC within the cell, which can be driven by a combination of factors such as electrolyte depletion, porosity reduction in the electrodes, and separator shutdown. 17 These effects can increase the cell resistance, limiting the short-circuit current and generating a small amount of heat with negligible contribution to the temperature rate profile. The cell voltage experiences another sharp drop as the safety vent opens and recovers for a short period before dropping to 0 V when the TR occurs.
Kinetic parameters of exothermic reactions at different SOCs
This section derives and analyzes the kinetic parameters of the exothermic reactions during the TR process, cognizant of the cell-level SOC. For each SOC, three sets of kinetic parameters that correspond to Stages 1, 2, and 3 of the ARC signatures are identified. For Stage 4, the energy released from the cell after TR occurs is calculated such that the maximum cell temperature is representative of the ARC experiment. While we focus majorly on the 100% SOC case here, further results for the other SOC cases (66%, 33%, and 3%) are presented in the Supplementary Information. Figure 2a depicts the rate of temperature change as a function of cell temperature for the 100% SOC case, where the different stages are demarcated during the cell-level TR process (see Fig. SF5 in Supplementary Information for cell temperature as a function of time). In between T1 and T2, two additional temperatures (i.e., Ta and Tb) are identified, where a significant change in the temperature increase rate is observed. These temperatures (T1, Ta, Tb, and T2) for the different SOCs are summarized in Table III. The temperature variation in Stage 1 is from T1 to Ta, Stage 2 is between Ta and Tb, and Stage 3 is from Tb to T2. The starting temperature of Stage 1 is identified as the onset of self-heating, while the end of Stage 3 is recognized as the point when TR occurs in the cell.

Figure 2. (a) Rate of temperature change as a function of the cell temperature during the TR process at 100% SOC. Linear regression results correspond to (b) Stage 1, (c) Stage 2, and (d) Stage 3 of the ARC experiment.
Download figure:
Standard image High-resolution imageTable III. Characteristics temperatures of various stages of the TR process at different SOCs.
| SOC | T1 (°C) | Ta (°C) | Tb (°C) | T2 (°C) |
|---|---|---|---|---|
| 100% | 72.67 | 99.01 | 130.70 | 203.29 |
| 66% | 86.93 | 131.60 | 162.66 | 216.26 |
| 33% | 86.46 | 138.25 | 185.94 | 236.14 |
| 3% | 87.69 | 154.57 | 187.68 | 300.75 |
Figures 2b–2d shows the linear regression results for 
![$\left[\displaystyle \frac{dT}{dt}/\left({T}_{e}-T\left(t\right)\right.\right]$](https://content.cld.iop.org/journals/1945-7111/171/1/010529/revision3/jesad1eccieqn57.gif) and
and  in comparison with the experimental data for the three TR stages at 100% SOC. The value of Te for different TR stages at SOC = 3%, 33%, 66%, and 100% are adopted from Table III, where Ta represents Te for Stage 1, Tb represents Te for Stage 2, and T2 represents Te for Stage 3 of the cell-level TR process. The linear regression relationship based on the ARC experimental data for the other three SOC cases has been presented in the Supplementary Information (see Figs. SF6–SF8). The kinetic parameters (pre-exponential factor,
  and activation energy,
  ) corresponding to the exothermic reaction in each stage are calculated from the slope and intercept given by Eq. 8. The calculated kinetic parameters for the different SOC cases are summarized in Table IV. For the exothermic interaction in Stage 4, the
  values at different SOCs are summarized in Table V; it is observed that
  exhibits a gradual reduction with a decrease in the SOC of the cell.
Table IV. Exothermic reaction kinetic parameters pertaining to various TR stages at different SOCs.
| SOC | Stage no. | Activation energy (J/mol) | Frequency factor (1/s) |
|---|---|---|---|
| 100% | 1 | 8.7073E + 04 | 6.1690E + 07 |
| 2 | 1.5673E + 05 | 1.9939E + 16 | |
| 3 | 2.0758E + 05 | 4.4246E + 21 | |
| 66% | 1 | 1.1180E + 05 | 1.5442E + 11 |
| 2 | 1.4394E + 05 | 2.6570E + 14 | |
| 3 | 1.7862E + 05 | 5.9683E + 17 | |
| 33% | 1 | 1.0930E + 05 | 5.9934E + 10 |
| 2 | 1.2725E + 05 | 1.3282E + 12 | |
| 3 | 1.3771E + 05 | 2.0422E + 12 | |
| 3% | 1 | 1.0875E + 05 | 4.1688E + 10 |
| 2 | 9.1666E + 04 | 2.0920E + 07 | |
| 3 | 7.8723E + 04 | 6.1789E + 04 |
Table V. The enthalpy of the exothermic reaction in Stage 4 under different SOCs.
| SOC | 3% | 33% | 66% | 100% |
 (J) (J) | 0 | 13299.45 | 20024.45 | 22394.66 |
The developed TR model for the NCA-based Li-ion cell is validated with the experimentally measured TR response. Figures SF9a–SF9d in the Supplementary Information compares the computational and experimental results of the TR behavior at the four different SOCs. In addition, the computationally calculated TR temperatures are compared with the experimental results in Table ST1. The TR model accurately captures T1 and T2 associated with TR, and the trends of T3 also show good agreement with the experimental results.
TR response under different oven conditions
In this section, we use the developed TR model to investigate the cell-level thermal stability under various oven conditions. Based on the model, standard oven tests are simulated and analyzed across oven temperatures ranging from 100 to 200 °C at SOC = 3%, 33%, 66%, and 100%. For a 66% SOC case, the thermal response at oven temperatures of 100 °C, 125 °C, 150 °C, 175 °C, and 200 °C is shown in Fig. 3a. The Li-ion cell does not experience TR for oven temperatures of 100 °C and 125 °C. However, for a SOC of 66%, the cell undergoes TR at oven temperatures of 150 °C, 175 °C, and 200 °C. The initial rise in the cell temperature is attributed to convective heating, and the occurrence of TR in the cell brings about a steep increase in the cell temperature. At Stage 4, the cell reaches a peak temperature of 737.15 °C, 748.03 °C and 754.16 °C at oven temperatures of 150 °C, 175 °C, and 200 °C respectively. Figure 3b examines the effect of SOC on the TR behavior for an oven temperature of 150 °C. The cells with 66% and 100% SOC experience TR with peak temperatures of 748.10 °C and 704.84 °C, while TR does not occur for SOCs of 33% and 3% due to the lack of exothermic heat generation. With a reduction in the SOC, the onset of TR is delayed, and the peak temperature during TR decreases. Figure 3c depicts the thermal stability map for NCA-based Li-ion cells as a function of the oven temperature and SOC. By quantifying the peak cell temperature across these conditions, the occurrence of TR is demarcated based on the criteria that the maximum temperature is greater than the oven temperature. Depending on the cell SOC, the critical temperature of TR is identified to fall within the range of 130 °C to 250 °C. Regions of the regime map beyond this critical value are identified as unsafe zones. On the other hand, safe zones imply no occurrence of TR since the temperature rise is not significant enough to go beyond the operating oven temperature.
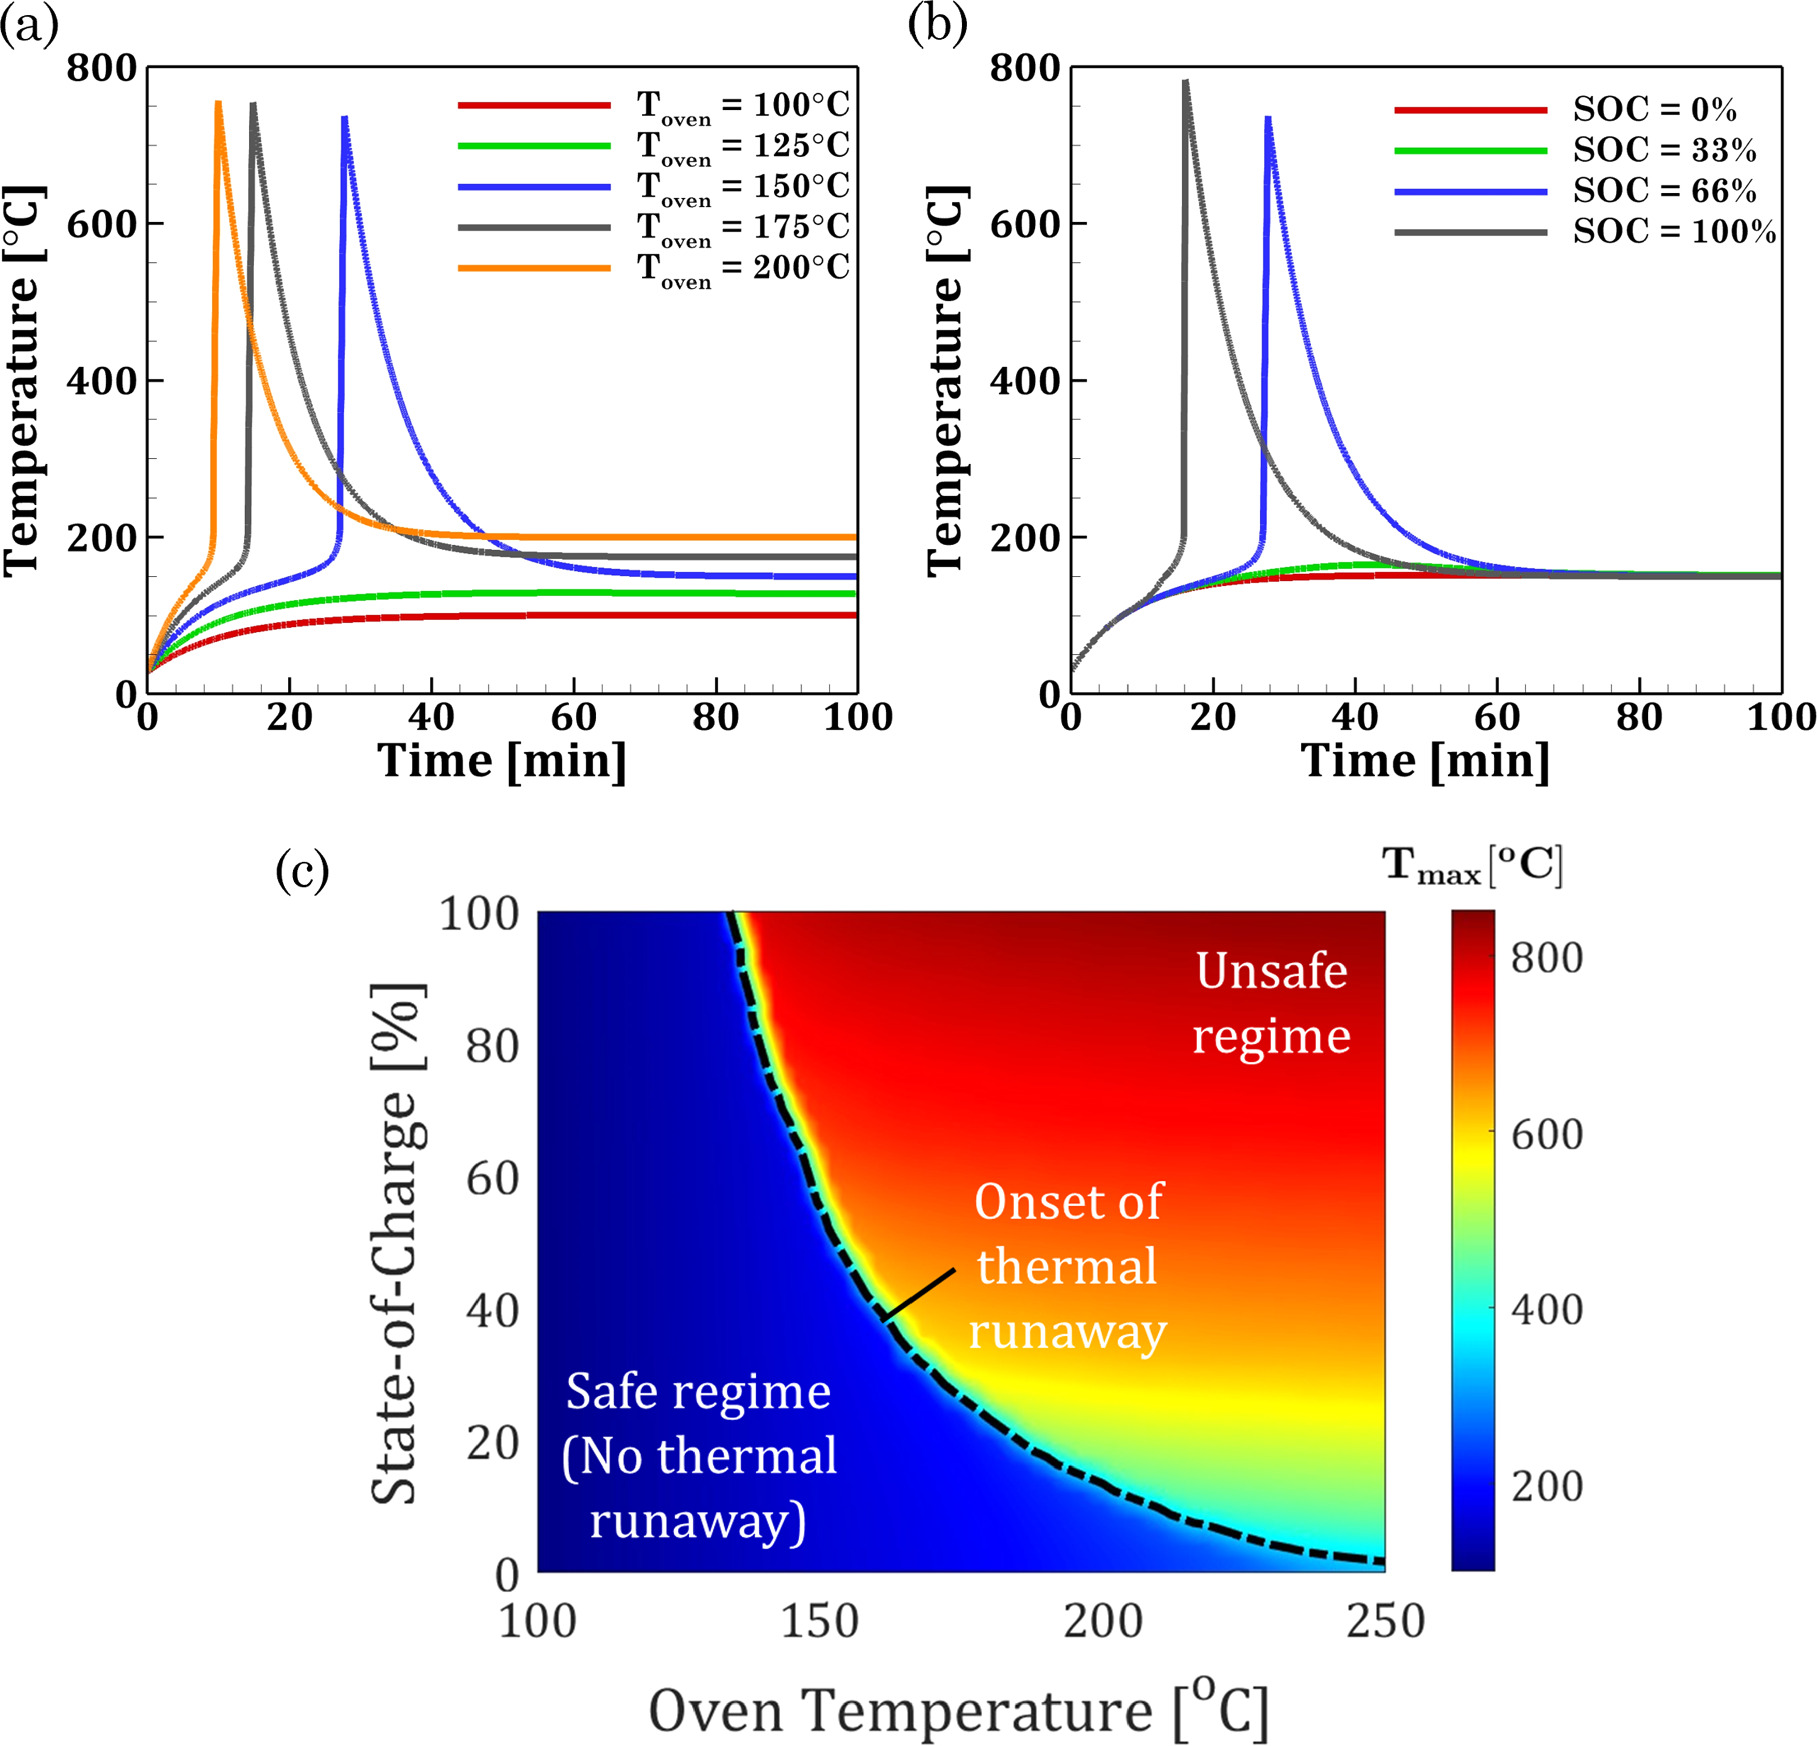
Figure 3. (a) Thermal response of the 66% SOC cell under different oven temperatures (b) Thermal response at different SOCs under an oven temperature of 225 °C. (c) Thermal stability map for NCA-based Li-ion cells. The black dotted line denotes the oven conditions and SOC at which TR onset is triggered.
Download figure:
Standard image High-resolution imagePredicting thermal runaway propagation in Li-ion battery modules
In this section, we analyze the TRP behavior in a 3 × 3 battery module comprising NCA-based Li-ion cells at uniform SOCs (Figs. 4a–4b). The Li-ion cells in the 3 × 3 module are connected by M-type tabs, and the spacing between them is 0.1 mm, analogous to the earlier TRP studies
23,50
for Li-ion battery modules. The central cell of the module (Cell 5) is heated with a power of 20 W to trigger TR and understand the potential pathways for TRP. Figures 5a–5d shows the temperature response of each cell in the module under convective conditions ( = 5 W m−2-K) and an ambient temperature of 35 °C. For the Li-ion battery module with all the cells at SOC = 3%, the amount of heat generated due to the TR of the trigger cell (Cell 5) is not sufficient to propagate the TR to the neighboring cells. On the other hand, for a uniform SOC of 33%, a TR originating in the central cell (Cell 5) is observed to propagate through the battery module. The TR for the central cell occurs at tTR = 30.92 min with a peak temperature of 532 °C. Subsequently, TR in the surrounding cells follows the following sequence: B5-B8-B2-{B4, B6}-{B1, B3, B7, B9}. Here, the cells within brackets simultaneously undergo TR. The TRP rate is defined as the ratio of the number of cells in the module that experience TR (excluding the trigger cell) to the time interval for TRP.
52
The time interval for TRP is calculated as the difference between the TR time of the trigger cell and the last cell undergoing TR in the module. Accordingly, the TRP rate in the module with SOC = 33% was calculated to be 1.82 min−1. Similarly, for a uniform SOC = 66%, the TR of the central cell (Cell 5) occurs at tTR = 19.33 min, which is much earlier than the onset time at SOC = 33%. For this case, the TRP sequence is B5-B8-B2-{B4, B6}-{B1, B3}-{B7, B9}, with a peak temperature of 723 °C occurring for Cells 1 and 3. The TRP rate for SOC = 66% was calculated to be 1.60 min−1. Finally, for a uniform SOC = 100% in all the cells, the heat generation due to TR of the trigger cell (Cell 5) is insufficient to cause TR in the neighboring cells. With a smaller heating period of tTR = 16.92 min for the 100% SOC case, the temperature of the cell adjacent (Cell 8) to the trigger cell at the onset of TR in the module is 93 °C. This temperature for the 100% SOC case is lower than the temperature of the same cell for the 66% SOC case (i.e., 102 °C) during TR onset. This is primarily because the frequency factor and activation energy for the exothermic reaction in Stages II and III at 100% SOC is higher than 66% SOC, leading to a much faster release of exothermic heat. During Stage IV of the exothermic reactions, the rate of temperature rise in the neighboring Cell 8 is 0.18 °C s−1 at 100% SOC compared to 0.55 °C s−1 at 66% SOC. Due to the rapid heat release from the cell at 100% SOC, there is insufficient time for the heat to be transferred to the neighboring cells. Thus, TRP does not occur for the battery module at 100% SOC. Such scenarios have also been reported in a prior experimental study by Wang et al.
53
where the TRP in a 1 × 3 cylindrical Li-ion battery module under different SOC was analyzed. Overall, the proposed TR model developed using mechanistic insights from the cell-level ARC experiments, and subsequent thermo-kinetic analysis is a scalable framework that can capture the TRP behavior in a battery module under different thermal abuse conditions.
= 5 W m−2-K) and an ambient temperature of 35 °C. For the Li-ion battery module with all the cells at SOC = 3%, the amount of heat generated due to the TR of the trigger cell (Cell 5) is not sufficient to propagate the TR to the neighboring cells. On the other hand, for a uniform SOC of 33%, a TR originating in the central cell (Cell 5) is observed to propagate through the battery module. The TR for the central cell occurs at tTR = 30.92 min with a peak temperature of 532 °C. Subsequently, TR in the surrounding cells follows the following sequence: B5-B8-B2-{B4, B6}-{B1, B3, B7, B9}. Here, the cells within brackets simultaneously undergo TR. The TRP rate is defined as the ratio of the number of cells in the module that experience TR (excluding the trigger cell) to the time interval for TRP.
52
The time interval for TRP is calculated as the difference between the TR time of the trigger cell and the last cell undergoing TR in the module. Accordingly, the TRP rate in the module with SOC = 33% was calculated to be 1.82 min−1. Similarly, for a uniform SOC = 66%, the TR of the central cell (Cell 5) occurs at tTR = 19.33 min, which is much earlier than the onset time at SOC = 33%. For this case, the TRP sequence is B5-B8-B2-{B4, B6}-{B1, B3}-{B7, B9}, with a peak temperature of 723 °C occurring for Cells 1 and 3. The TRP rate for SOC = 66% was calculated to be 1.60 min−1. Finally, for a uniform SOC = 100% in all the cells, the heat generation due to TR of the trigger cell (Cell 5) is insufficient to cause TR in the neighboring cells. With a smaller heating period of tTR = 16.92 min for the 100% SOC case, the temperature of the cell adjacent (Cell 8) to the trigger cell at the onset of TR in the module is 93 °C. This temperature for the 100% SOC case is lower than the temperature of the same cell for the 66% SOC case (i.e., 102 °C) during TR onset. This is primarily because the frequency factor and activation energy for the exothermic reaction in Stages II and III at 100% SOC is higher than 66% SOC, leading to a much faster release of exothermic heat. During Stage IV of the exothermic reactions, the rate of temperature rise in the neighboring Cell 8 is 0.18 °C s−1 at 100% SOC compared to 0.55 °C s−1 at 66% SOC. Due to the rapid heat release from the cell at 100% SOC, there is insufficient time for the heat to be transferred to the neighboring cells. Thus, TRP does not occur for the battery module at 100% SOC. Such scenarios have also been reported in a prior experimental study by Wang et al.
53
where the TRP in a 1 × 3 cylindrical Li-ion battery module under different SOC was analyzed. Overall, the proposed TR model developed using mechanistic insights from the cell-level ARC experiments, and subsequent thermo-kinetic analysis is a scalable framework that can capture the TRP behavior in a battery module under different thermal abuse conditions.
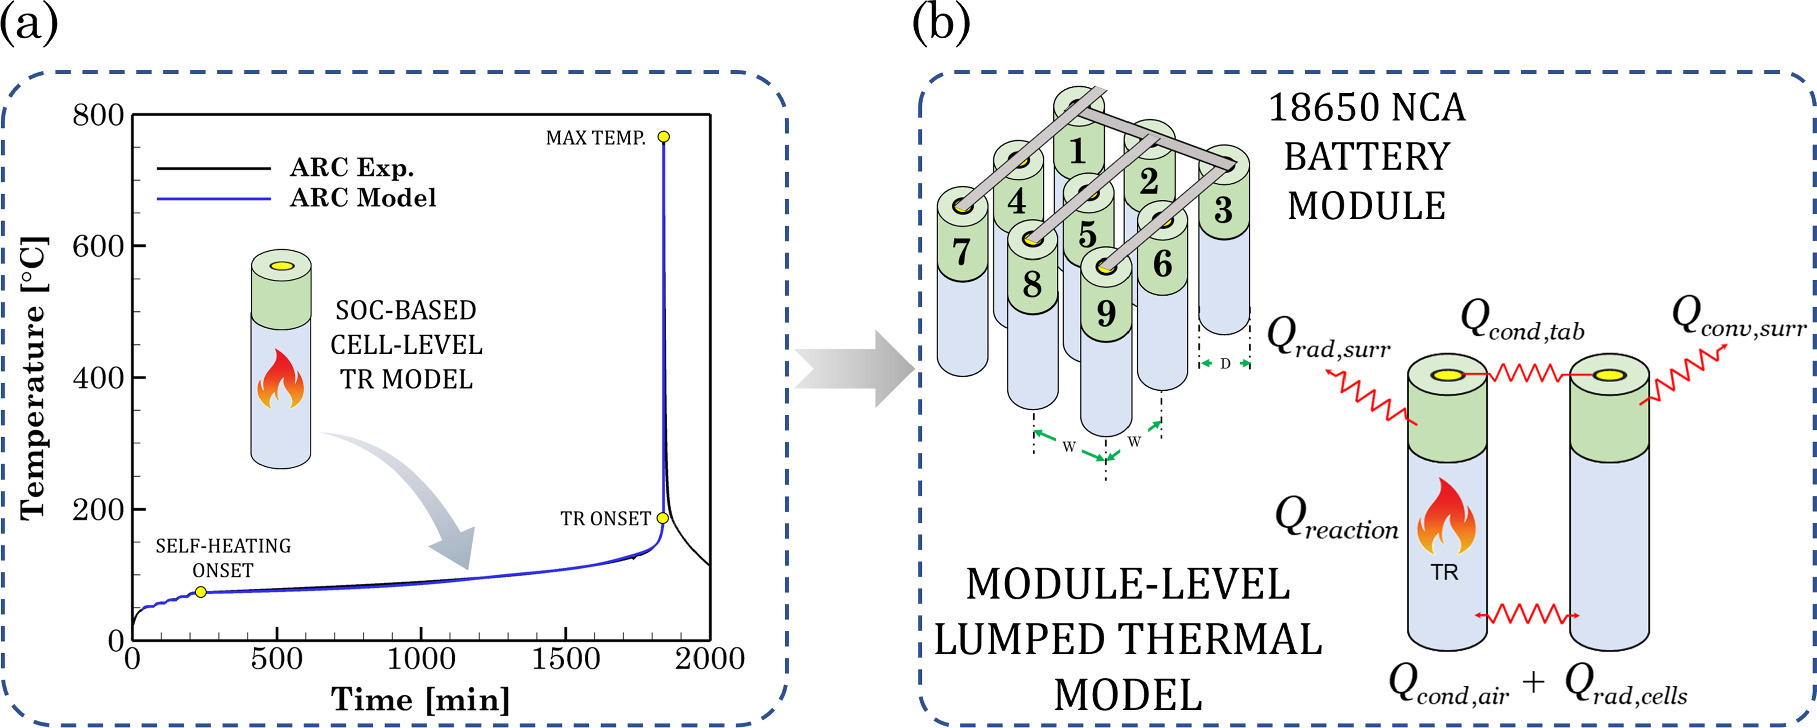
Figure 4. (a) The cell-level TR model informed by the ARC experiments of 18650 Li-ion cells (b) 3 × 3 square arrangement of Li-ion cells in a module connected by M-type tabs. The different heat transfer modes from an individual cell to the neighboring cells and surroundings are depicted.
Download figure:
Standard image High-resolution image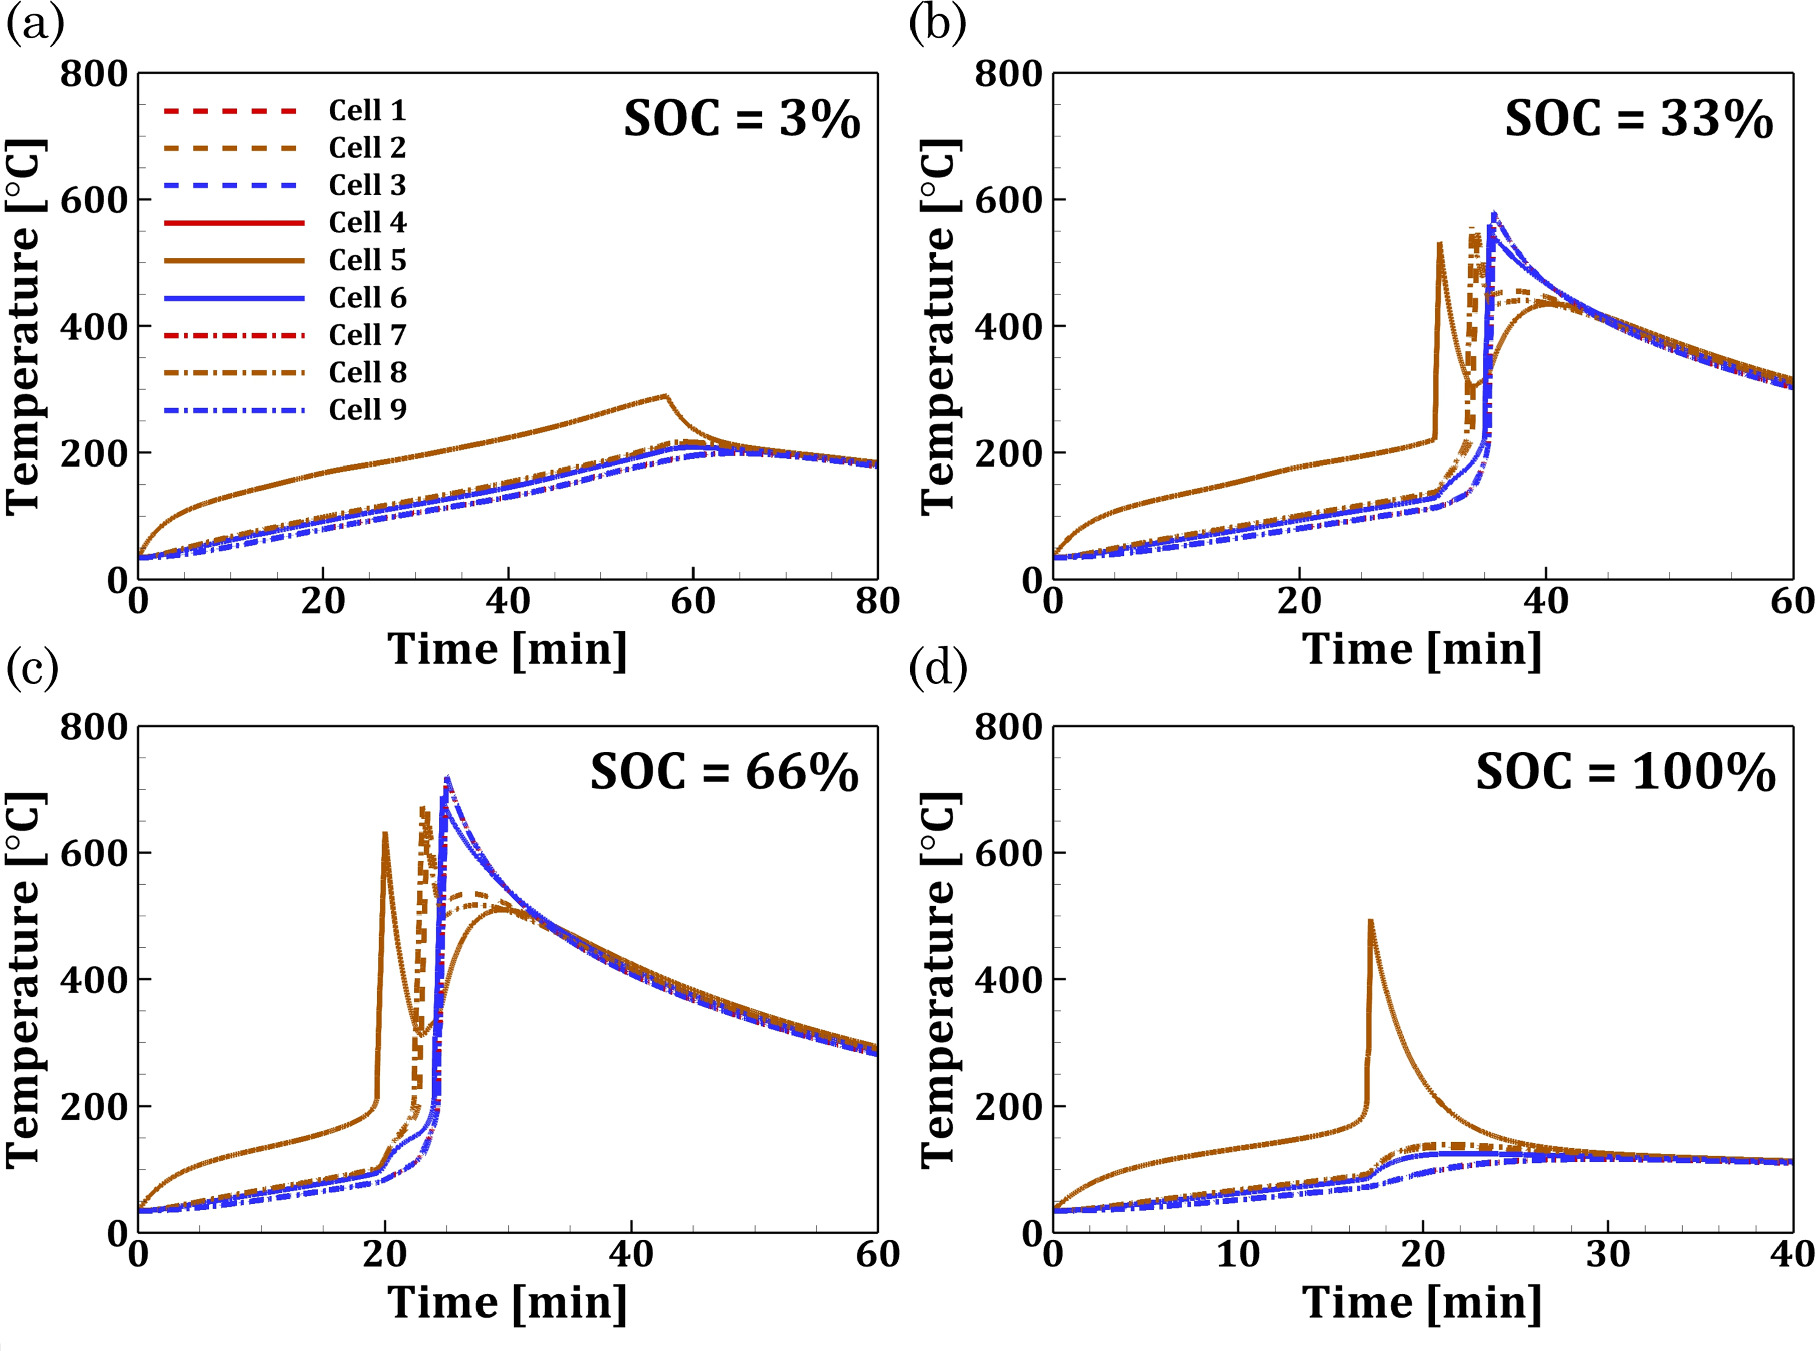
Figure 5. TR response of each 18650 NCA-based Li-ion cell in the 3 × 3 module under convective cooling conditions with Tamb = 35 °C, 0.1 mm cell-spacing and M-type tabs at (a) SOC = 3% (b) SOC = 33% (c) SOC = 66% (d) SOC = 100%. The central cell of the module (Cell 5) was subject to a heating power of 20 W to trigger TR.
Download figure:
Standard image High-resolution imageLastly, we study the TRP behavior in a battery module comprising cells with an imbalanced SOC distribution. To analyze this, we select N = 100 samples of 3 × 3 Li-ion battery modules that contain cells following a random normal distribution of the SOC. The mean SOC of the cells in the battery module is 66%, and the standard deviation (SD) is 5%,, 54,55 as shown in Fig. 6a. At an ambient temperature of 35 °C and a cell spacing of 0.1 mm, the central cell of the module (Cell 5) was provided with a heating power of 20 W to trigger TR in each sample of the battery module. Figure 6b summarizes the simulated TRP outcomes for the 100 samples under the prescribed SOC distribution in terms of the following attributes: (i) the amount of critical thermal energy input required for Cell 5 to trigger TR in the module, (ii) exothermic heat generated due to TR, and (iii) the resulting TRP rate in the module. For the considered N = 100 samples (mean SOC = 66%, SD = 5%), the critical thermal energy input to trigger TR varies from 20.47 to 25.91 kJ with a mean value of 23.20 kJ. The heat generated from the exothermic reactions during TR ranges from 147.59 to 151.22 kJ with an average value of 149.40 kJ, and The TRP rate in the module varies between 1.33 to 1.72 min−1 with a mean value of 1.52 min−1. In summary, a hierarchical TR modeling framework was developed in this study to analyze the SOC-dependent TR response stemming at the cell-level and interrogate its critical implications for TRP within a typical Li-ion battery module. The development of such experimentally-informed virtual TR analytics platforms can enable the mechanistic design of optimal cooling strategies and intelligent battery thermal management systems to prevent cell-to-cell TRP in battery modules.

Figure 6. TRP characteristics of a 3 × 3 Li-ion battery module comprising cells with a non-uniform SOC distribution. (a) N = 100 samples of the Li-ion battery module; each sample has a mean SOC = 66% and SD = 5%. The numbers inside the circles in (a) denote the SOC of the cells. (b) The TRP outcomes are presented in terms of the heat input to trigger TR in the module, exothermic heat generation due to TR, and the TRP rate of the battery module. The central cell of the module (Cell 5) was heated with a power of 20 W to trigger TR in the battery module. The battery module operates under convective cooling conditions with Tamb = 35 °C, 0.1 mm cell-spacing, and M-type tab connections.
Download figure:
Standard image High-resolution image
Conclusions
The current study investigates the SOC-dependent TR behavior of NCA-based Li-ion cells and battery modules. By performing ARC experiments using 3.25 Ah cylindrical Li-ion cells, the crucial influence of SOC on cell-level TR characteristics, including the onset temperature for TR, peak temperature, and self-heating rate, is demonstrated. Based on the ARC experiments, we observe that the onset temperature for TR is found to decrease with an increase in the SOC, while the peak cell temperature increases at higher SOCs. The thermo-kinetic parameters derived from the ARC signatures are used to develop a hierarchical TR model that describes the SOC-driven cell-level TR behavior and the oven test response. We develop a thermal stability map that indicates a decrease in the critical oven temperature to trigger TR from 250 °C to 130 °C as the cell SOC increases from 0% to 100%. Furthermore, the implications of the cell-level TR response on the TRP behavior in Li-ion battery modules are analyzed. By investigating different scenarios, including cells with uniform and non-uniform SOC distributions in the module, the potential variability in the propagation of TR is illustrated. The proposed virtual TR analytics framework captures the influence of intrinsic TR attributes such as SOC and cell-to-cell arrangement and extrinsic factors such as external heating and temperature.
The proposed modeling framework hierarchically connects the thermo-kinetic attributes of the exothermic reactions underlying the TR in a Li-ion cell, and its implications on the TRP in a module. The overall approach, which includes a combination of physics-based modeling and calorimetry experiments, is transferable to other cell chemistries. The proposed framework can be scaled to analyze the thermal safety of packs, and can advance the development of physics-informed battery thermal management systems. However, the current framework does not account for the loss of cell mass due to effects such as gas venting during the TR process, and the change in specific heat capacity of the cell as a function of temperature. Building on this framework, our future work will analyze the role of additional factors including the implications of different module arrangements, and other intrinsic aspects such as the cell-level SOC imbalance. Furthermore, the kinetic parameters corresponding to the different exothermic reactions reported in this study are specific to the NCA-based Li-ion cell and will be extended to other cell chemistries in future studies.
Acknowledgments
Financial support in part from the Office of Naval Research (ONR grant: N00014–18–1–2397) is gratefully acknowledged. The authors would like to thank Dr. Michele Anderson from ONR for supporting this work.
Supplementary data (0.9 MB PDF)