

Abstract
This paper takes a certain type of large-capacity pure electric vehicle NCM li-ion power battery as the object, and analyzes and studies the process of nail penetration thermal runaway(TR). With the aid of AMEsim one-dimensional simulation software, considering the structure composition of the cell, the heat generation mechanism of each side reaction and the three heat transfer modes of thermal radiation, heat conduction and convective heat transfer between the cells, box and the environment, the thermoelectric characteristics of the battery module (six cells) are modeled. The TR behavior of the battery module during nail penetration is simulated and analyzed, and the experiment of the battery module is carried out according to Chinese new regulation GB 38031−2020. The experimental results verify the accuracy of the established model and the reliability of the simulation results, and provide technical reference for the design and development of battery thermal management such as the prediction of TR temperature and the safety of preventing TRP of battery pack.
Export citation and abstract BibTeX RIS
In order to respond to the call of environmental protection and save fossil energy, electric vehicles put forward high energy density and long endurance mileage requirements for power batteries. Correspondingly, the cathode material of the battery changes from  (LFP) and NCM to nickel-rich NCM or lithium-rich manganese oxide, and the anode material changes from carbon compounds to silicon-carbon compounds. In this way, although the energy density of the battery is increasing, the stability of the positive and negative materials is getting lower and lower, and the battery safety problem is becoming more and more prominent.
1–7
As the most prominent safety problem, smoke, fire and even explosion caused by TR have attracted more and more attention.
8–10
The main reason for the TR of power battery is the abuse in the actual use process, which is divided into mechanical abuse, electrical abuse and thermal abuse.
11–13
The nail penetration condition discussed in this paper is mechanical abuse, which is easy to occur in the collision of electric vehicles in traffic accidents. Therefore, it is particularly necessary to study this condition. TR is an important research content of battery system safety condition monitoring, and engineers need to reasonably design the battery structure to minimize the harm of thermal runaway.
(LFP) and NCM to nickel-rich NCM or lithium-rich manganese oxide, and the anode material changes from carbon compounds to silicon-carbon compounds. In this way, although the energy density of the battery is increasing, the stability of the positive and negative materials is getting lower and lower, and the battery safety problem is becoming more and more prominent.
1–7
As the most prominent safety problem, smoke, fire and even explosion caused by TR have attracted more and more attention.
8–10
The main reason for the TR of power battery is the abuse in the actual use process, which is divided into mechanical abuse, electrical abuse and thermal abuse.
11–13
The nail penetration condition discussed in this paper is mechanical abuse, which is easy to occur in the collision of electric vehicles in traffic accidents. Therefore, it is particularly necessary to study this condition. TR is an important research content of battery system safety condition monitoring, and engineers need to reasonably design the battery structure to minimize the harm of thermal runaway.
A great deal of research on TR of power battery has been carried out around the world. Z. An et al. 14 studied the influence of different thermal conductivity, cell thickness and discharge rate on TRP process of lithium iron phosphate battery by COMSOL simulation and experimental results. Shang Gao et al. 15 explored the TR mechanism and propagation process of a large parallel ternary lithium battery through simulation modeling and external heating experiment. Liu Tong et al. 16 explored the mechanism of battery TR caused by overcharge and proposed a method to eliminate TR. However, the modeling and experiments 17,18 for TR of lithium batteries are all based on lithium iron phosphate cylindrical, small-capacity ternary lithium batteries with equal specific energy, low specific power and strong safety and stability. The research contents are mainly electrical abuse and thermal abuse, and there are few studies on thermal out-of-control related to mechanical abuse. The 203Ah battery module used in this paper is more in line with the actual needs of the current pure electric vehicle for the mileage. TR caused by overcharge and overheat can be prevented and avoided by Battery Management System (BMS) power limit and thermal management strategy. 19,20 In comparison, the nail penetration condition is more in line with the actual situation of TR after electric vehicle accidents, and has more research value.
In Ref. 21, the lumped parameter method was used to simplify the penetration model to reduce the calculation amount. However, for large-capacity batteries, the volume and mass were large, and the time span of acupuncture process was short, which was easy to produce large errors. CHIU et al. 22 established a mathematical model of nail penetration lithium-ion battery, the accuracy of which depends on the experimental data of battery manufacturers. Compared with the small-capacity battery studied by previous researchers, the 203Ah large-capacity battery used in this paper has higher energy density and greater possibility of TR. The model can identify the battery through HPPC experimental data, and input relevant parameters under its thermal runaway project. In addition, 3D simulation cannot intuitively characterize the battery model, so it is necessary to set the thermal properties of the battery, and the engineer uses a large number of experimental data to fit the mathematical formula to characterize the TR process. In contrast, AMEsim 1D modeling is simple and fast, which can save a lot of time and experimental cost.
Theoretical Calculation and Simulation Parameters Acquisition of Thermal Runaway Side Reactions
Battery parameter
The battery sused in this paper is a 203Ah NCM LIB for a certain type of vehicle. The cathode material is layered ternary cathode material, the anode material is graphite, the isolation membrane is polymer, the electrolyte salt is  the electrolyte solvent is ethylene carbonate, and the busbar between the cell and the cell is copper material.
For the subsequent one-dimensional modeling of AMEsim, the size parameters and side effects related data should be obtained. The dimensions and physical drawings of the battery modules are shown in Figs. 1a and 1b respectively.Cell monomer and roll core structure as shown in Figure 2. Cell monomer consists of blue film, top cover, aluminum shell and roll core.
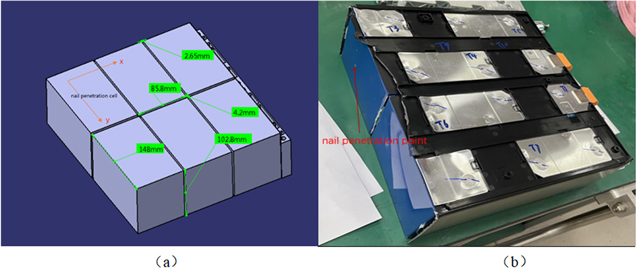
Figure 1. Dimension parameters and physical drawings of nail penetration module.
Download figure:
Standard image High-resolution imageThe length, width and height of the cell are 148 mm, 86 mm, 103 mm, denoted as a, b, h. The distance between the two cells in X direction is 4.2 mm, and the distance in Y direction is 2.7 mm. Define the centroid spacing between cells in X and Y directions, which can be described as Eqs. 1 and 2.


Side reactions of thermal runaway
Lithium-ion battery has the following side reactions: solid electrolyte interface (SEI) decomposition, cathode-electrolyte reaction, anode-electrolyte reaction, and electrolyte decomposition respectively. 23–25 The decomposition of SEI generally occurs between anode and electrolyte, which is described as follow:


where  represents heat release power per unit volume,
  refers to heat release per unit of the reactions,
  represents carbon content,
  refers to reaction rate,
  denotes frequency factor,
  is molar gas constant,
  refers to the proportion of unstable lithium on SEI.
The lithium embedded in the anode material reacts with the electrolyte, and the exothermic equation is as follow:
Cathode active material reacts with electrolyte, and the exothermic equation is Eq. 7.
The decomposition of electrolyte makes the whole thermal runaway process advance rapidly, and the exothermic equation is Eq. 8,

where  refers to the proportion of unstable lithium in cathode,
  and
and  are the ratio of SEI thickness to active material characteristic size and their initial values,
  is the ratio of lithium energy in positive electrode to electrolyte,
  is the positive conversion rate,
  is the proportion of no reaction in the electrolyte.
Heat transfer methods in thermal runaway process
Between the cell and the cell, the cell and the needle tooling wall are contact heat conduction, 26 which is described as follow:

where  is the thermal conductivity,
 is the contact area,
 is contact thermal resistance,
When the temperature of the cell rises to a certain extent due to thermal runaway, the influence of thermal radiation between the cells cannot be ignored, and heat transfer formula is Eq. 10,

where  is the emissivity of the object.
  is the radiation area,
 is the blackbody radiation constant, which is
Heat flow rate represents the amount of heat transmitted per unit time through a given surface through heat conduction, heat convection and heat radiation, and it follows the Fourier law.

Where  is heat flow rate,
 is thermal conductivity,
 is cross-section area,
 is temperature gradient,
The battery module is encapsulated in the needle punch tooling, which is in a closed environment, and there is no cooling system, so the influence of convective heat transfer is negligible.
Triggering of thermal runaway model
For the simulation model, the physical process of needle entering the core is not convenient to characterize. Referring to Dr. Feng's method 27 to build the thermal runaway model, the theoretical formula is Eq. 12.

Where  denotes the volumetric heat release rate due to short circuit at the nail,
  is the volumetric electrical energy release rate after separator collapse and short circuit occurs, and
  is the volumetric chemical energy release rate caused by side reactions at high temperature.
Experiment of Nail Penetration Thermal Runaway
Experiment preparation
The experimental process is in accordance with Chinese standard GB 38031–2020 Electric vehicles traction battery safety requirements of the experimental method C.5.3. 28 The nail penetration experiment is carried out in a specific test chamber. The battery module, the outer wall and the stepper motor constitute the experimental tooling. The needle is mounted on the stepper motor, the material is tungsten steel, the diameter is 6 mm, the shape is conical, the angle is 30 °C, the needle speed is 0.1 mm s−1, the maximum extrusion pressure is more than 5kN, the needle should be insulated during the experiment. Before the experiment, the stage of charge (SOC) of the cell in the module was charged to more than 95%. As shown in Fig. 3, the module was placed in the tooling, and the position of the needle was measured and recorded with a slide gauge, so as to facilitate the subsequent calculation of the needle length and control the start and stop of the needle.

Figure 2. The internal structure of the cell.
Download figure:
Standard image High-resolution image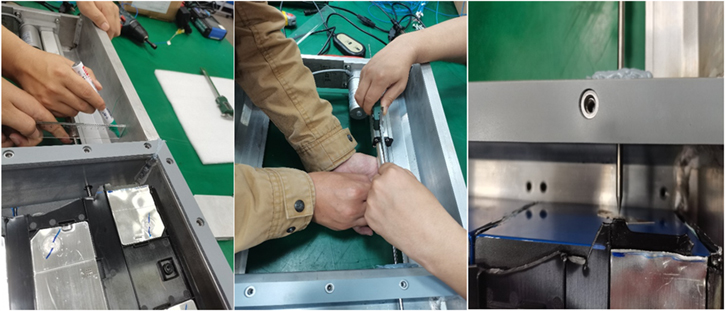
Figure 3. Record needle position.
Download figure:
Standard image High-resolution image11 thermocouples were placed in the battery module to monitor the temperatures as shown in Fig. 4. The temperature sampling line is as follows: the upper limit of temperature acquisition is 1200 °C, the acquisition accuracy is ± 0.8 °C, and the skin temperature of thermocouple is 600 °C to 800 °C. The thermocouple needs temperature calibration before test. The thermocouple is connected to HIOKI data acquisition instrument LR8401, the temperature sampling accuracy is ±0.5 °C, the minimum sampling interval is 0.1 s, and the number of channels is more than 60. Because this experiment is a nail penetration experiment on the battery module, there is no BMS real-time acquisition of temperature and voltage, only wait for the end of the experiment to analyze the temperature data stored in the data acquisition instrument to determine the occurrence of thermal runaway and thermal spread.

Figure 4. Distribution of thermocouples.
Download figure:
Standard image High-resolution imageThermocouples arranged on the cell wall near the needle point 4–6 mm, denoted as T1 and T2, respectively. The top surface temperatures of the cells were monitored by T3-T8. The position of the thermocouple T3-T8 corresponding to the cell is shown in Fig. 4c, and the surface temperature data of the cell are collected respectively. T9 and T10 were arranged at the explosion-proof valve port of the cell, T11 was arranged at the relief valve port of the tooling, and thermocouples were arranged at the relief valve of the battery pack to monitor the gas temperature after the thermal runaway of the cells. The diameter of the hole is 20 mm, and the position is shown in Fig. 4. The center of the hole is the needle point. There is an insulating gasket at the hole, and the gasket can also play a sealing role. Considering that the tooling does not have as many pressure relief valves as the battery pack, the temperature and voltage lines on the surface of the cells are extracted from the needle-punching hole and connected to the data collector to measure the temperature variation and distribution curve of the battery module surface and the single cell, and the hole is blocked by sealant to simulate the real battery pack environment. The voltage sampling line is generally welded on the surface of busbar, which is easy to fall off due to the high temperature and explosion caused by thermal runaway. Therefore, this paper does not take the voltage change as the basis for judging the trigger of thermal runaway.
Experimental phenomena
At the beginning of the experiment, turn on the needle machine and step at the set speed. Pay attention to the temperature of the needle point on the data acquisition instrument, when the temperature jumps above 120 °C, it is confirmed that the thermal runaway occurs 28 and stop the step of the needle machine. During the experiment, with the tungsten steel needle into, after a period of time the explosion-proof valve spray valve and smoke, the cell in the battery module were thermal runaway and exploded. The curve of temperature change with time is shown in Fig. 5, and the experimental environment temperature is 22.3 °C. From this curve, we can judge the time of thermal runaway trigger and the duration of internal side reactions of each cell.
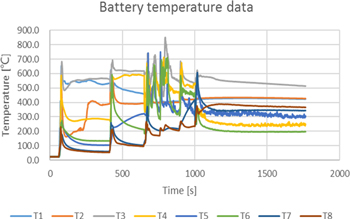
Figure 5. Experimental data of cells temperature.
Download figure:
Standard image High-resolution imageThe trigger thermal runaway time of the first cell was 62 s (relative time). The force of the tungsten steel needle was 0 N when it was not contacted, and the force became 0.2 kN after contact with the gasket. The force suddenly changed to 1.1 kN after needle insertion, and the shell length of tungsten steel needle insertion cell was 12.3 mm. The time of explosion relief valve triggered by six cells could be judged preliminarily: the thermal runaway trigger time of needle-punched cell was 62 s. After thermal runaway triggered, the temperature of needle-punched point and electrode ear rose rapidly to the highest 680 °C, and then maintained at about 550 °C. The thermal runaway time of the second cell was 415 s. (Observing the temperature curve of T4 and T6, the temperature of T4 rose rapidly and then maintained, while the temperature of T6 rose and then decreased, which could be judged to be the trigger thermal runaway of the cell adjacent to the X direction of the trigger cell). The thermal runaway time of the third cell was 646 s. When the first cell was triggered, the maximum temperature of T7 was about 190 °C. When the third cell was triggered, the maximum temperature was 360 °C. Therefore, it was judged that the third cell was triggered by the T6 cell rather than the T5 cell (distance judgment). The thermal runaway time of the fourth cell was 758 s, when the T5 cell was triggered. The thermal runaway time of the 5th cell was 892 s, when the T7 cell triggered. The thermal runaway time of the sixth cell was 973 s, while the T8 cell triggered.
The content of the tooling is small, and only one explosion-proof valve is equipped. Compared with the 203Ah battery pack, the nail penetration working condition is more inclement, and the ignition time of the experiment is longer than the warning time of 5 min required by the national standard. Therefore, it can be speculated that the 203 battery pack level nail penetration experiment can guarantee the bottom of the national standard. In order to prevent the occurrence of thermal runaway accidents and avoid the imbalance of internal and external pressure of battery pack, taking into account that LIBs will instantly produce a large number of toxic gases when they are on fire, it is necessary to timely and directional discharge gas. As a passive safety protection measure for preventing thermal runaway of battery system, explosion-proof valve can meet the above requirements of keeping pressure balance and directional discharge of gas. After the test, it is necessary to disassemble and observe the damage of the cover, the cells, the fire insulation pad and the explosion-proof valve, as shown in Fig. 6.
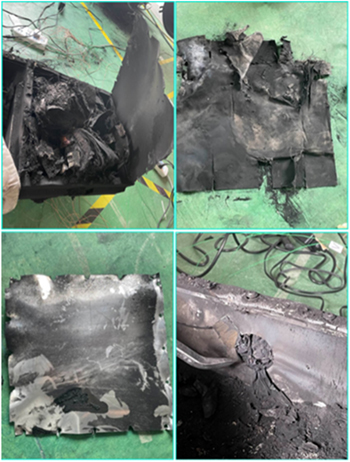
Figure 6. The situation of disassembly inspection after experiment.
Download figure:
Standard image High-resolution imageConstruction of One-Dimensional Thermal Runaway Model
Building of thermal runaway model
Compared with the three-dimensional simulation, AMEsim can convert the temperature signal of the heat source into the power signal through the built-in algorithm after importing the trigger temperature, while the three-dimensional simulation can only fit the formula of the heat production power through a large number of data by engineers. 29–31 AMEsim built-in battery library can identify Hybrid Pulse Power Characteristic (HPPC) experimental data by battery identification tool to obtain a more accurate cell model, edit relevant parameters of thermal runaway in parameter mode, and establish TR model. 1D simulation is more dependent on test data, the model needs to be calibrated, there are a lot of data cannot be provided in the actual battery model, parameter debugging process is more cumbersome.
One-dimensional modeling of TR is shown in Fig. 7. Each monomer modeling is composed of the coupling of the electrical characteristic model and the thermal characteristic model. The heat transfer mode between the cell monomers is heat conduction. There is thermal radiation between the cell and the cell, and between the battery module and the wall. There is thermal convection between the wall and the outside world. In order to deal with the heat exchange of each monomer and the inhomogeneity of temperature distribution in the characterization space, the model of the module is designed as an assembly of 10 walls, and the box material is aluminum. There is no direct contact between the monomer and the package, so the heat conduction between them is ignored.
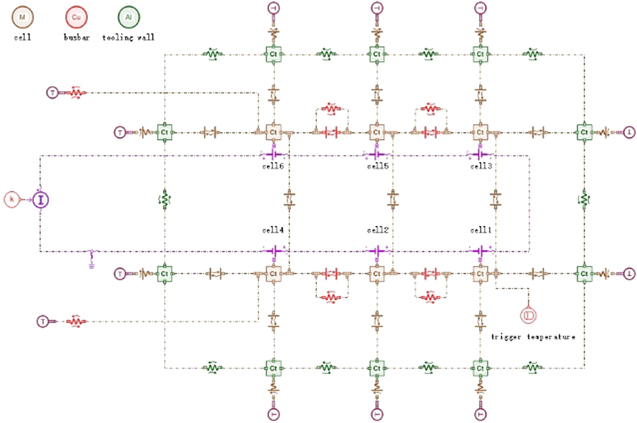
Figure 7. One-dimensional modeling of TR and parameter setting.
Download figure:
Standard image High-resolution imageBefore the simulation starts, the parameters of the cell should be identified by HPPC experimental data to obtain its open circuit voltage. The ohmic resistance should be calculated for each pulse, and the curve fitting should be performed for each pulse to calculate the diffusion-related parameters. The battery identification process is to tell AMEsim what kind of cell is chosen. The initial SOC is set to 95%, and parameters in electrical models are obtained from Table I or automatically generated by battery identification tools. The side reactions are reflected in the thermal runaway items of the submodel. The reaction parameters such as specific enthalpy, frequency factor and activation energy are listed in Table II.
Table I. Sample battery specification.
| Physical performance | Parameter |
|---|---|
| nominal capacity | 203Ah |
| operating voltage scope | 2.8 ∼ 4.2 V |
| specific heat capacity | 1100 J/(kg·K) |
| heat transfer coefficient | X:14 W/(m·K);Y:8 W/(m·K);Z:9 W/(m·K) |
| density | 2370 kg/m^3 |
| energy density | 241.9 Wh kg−1(cell−1) |
| mass | 3.1 kg |
| operating temperature | −20 ∼ 55 ° |
Table II. Characteristic parameters of thermal runaway side reactions.
| Symbol | Title | Value | References |
|---|---|---|---|

| SEI stabilization-specific enthalpy | 257000 J kg−1 | 24, 25 |

| SEI stabilization-frequency factor | 1.66  1015s−1 1015s−1
| 26 |

| SEI stabilization-activation energy | 2.061  10−19J 10−19J | 29 |

| SEI stabilization-reaction order | 1 | 26 |

| fraction of metastable SEI | 0.15 | 26 |

| negative decomposition-specific enthalpy | 171400 J kg−1 | 26 |

| negative decomposition-frequency factor | 2.5  1013s−1 1013s−1
| 29 |

| negative decomposition-activation energy | 2.061  10−19J 10−19J | 26 |

| negative decomposition-reaction order | 1 | 26 |

| negative electrode insertion rate | 0.811 | 26 |

| positive decomposition-specific enthalpy | 218000 J kg−1 | 29, 30 |

| positive decomposition-frequency factor | 7.25  1016s−1 1016s−1
| 31 |

| positive decomposition-activation energy | 2.268  10−19J 10−19J | 31 |

| positive decomposition-reaction order | 1 | 24 |

| positive electrode decompositionreaction advancement | 0.04 | 24 |

| electrolyte decomposition-specific enthalpy | 155000 J kg−1 | 25 |

| electrolyte decomposition-frequency factor | 5.14  1025s−1 1025s−1
| 25 |

| electrolyte decomposition-activation energy | 4.48  10−19J 10−19J | 25 |

| electrolyte decomposition-reaction order | 1 | 23 |

| reduced to oxidized electrolyte ratio | 1 | 23 |
In this simulation model, six cells are connected in series, and the external current is set to 0 A to simulate the state of the battery module during the experiment. In this model, the temperature data at the needle point is used as the trigger heat source of thermal runaway. When the cell 1 is TR, a large amount of heat is generated to trigger 5 cells through heat conduction and thermal radiation. After the simulation, the temperature change curve of each cell is obtained.
Calibration of simulation and experiment
After the model is built, the thermal runaway simulation of nail penetration is carried out. The heat generation in the process involves Joule heat produced by short circuit, heat transfer between the cell and the cell, and thermal runaway side reactions inside the battery. The short circuit caused by nail penetration is the process of tungsten steel needle passing through the winding layer between the positive and negative poles of the cell. 32–34 This process cannot be characterized in AMEsim. Because the model building of the short circuit caused by nail penetration is uncertain, only the heat transfer simulation of the battery module is considered, the thermal diffusion simulation of nail penetration is equivalent to the external heating process. The thermal runaway mechanism of the two is the same, both destroy the SEI film to short circuit the cell to trigger thermal runaway.
The simulation time is 1800 s and the simulation time step is 0.1 s, which is consistent with the experimental temperature data acquisition process. The simulation results are shown in Fig. 8. T3–T5 is the experimental data, and the cell 1–6 is the simulation results.
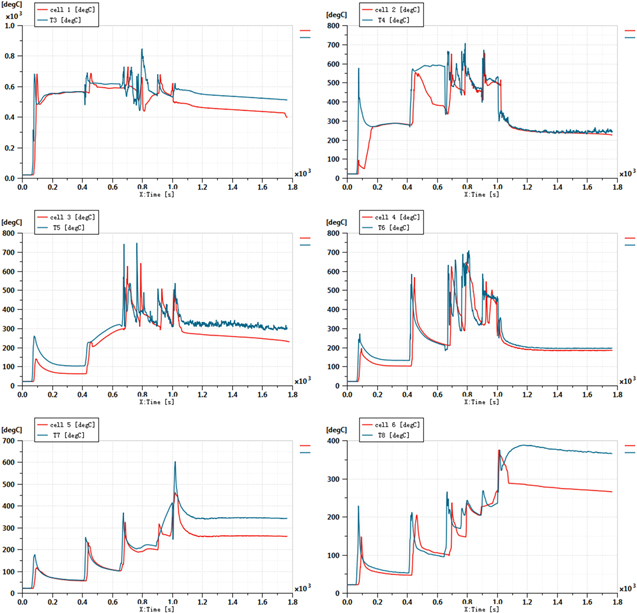
Figure 8. One-dimensional simulation results.
Download figure:
Standard image High-resolution imageThe thermal runaway propagation (TRP) sequence can be obtained according to the thermal runaway trigger criteria recommended by Chinese national standard GB 38031 − 2020 C. 5.3.6. The TRP sequence in the experiment is shown in Fig. 9a, and the TRP sequence in the simulation process is shown in Fig. 9b. Labels 1–6 represent six cells in the 203Ah module in the experiment, where 1 is the needle-punched cell, and the corresponding temperatures after thermal runaway are T3–T8.
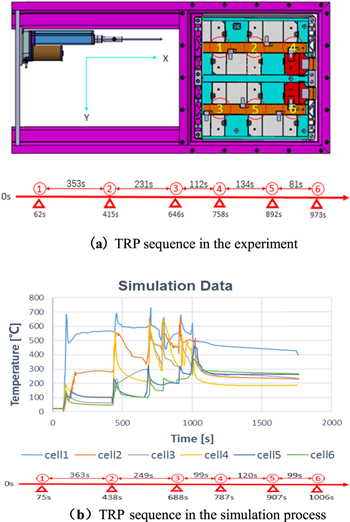
Figure 9. (a) TRP sequence in the experiment.(b) TRP sequence in the simulation process.
Download figure:
Standard image High-resolution image203Ah battery module TR along the X direction propagation speed is greater than Y direction, X direction centroid spacing is 90 mm, Y direction centroid spacing is 150.7 mm, the smaller the centroid spacing, the faster the propagation speed.
Research on extension of simulation model
In the simulation process, the nail penetration process is difficult to simulate in AMEsim compared to external heating and is also a complex point in other simulation software. In this paper, the temperature at the nail penetration point is used as the input to trigger the thermal runaway. For the duration of thermal runaway, the duration of cell 1 and cell 6 is short, which does not have reference significance, so the maximum error in this process is 11.6%.For the maximum temperature in the process of thermal runaway, cell 5 has no reference because of human error at the end of the experiment, so the maximum error of the maximum temperature is 14.8%. After benchmarking with the experimental results, it is concluded that the model has high accuracy. Analysis of model accuracy as shown in Fig. 10.

Figure 10. Analysis of model accuracy.
Download figure:
Standard image High-resolution imageNail penetration and external heating essentially destroy SEI to short circuit internal circuit to trigger TR. The two kinds of thermal runaway are triggered by the heat source, but the failure mode is different, and the temperature and power are the manifestations of heat. At the same time, the ultimate goal of this paper is to build a more accurate one-dimensional simulation model, reduce the follow-up simulation time and workload, and put forward guidance for thermal runaway protection. In the subsequent exploration of the maximum power without thermal runaway, power is used as a heat source to study its influence on thermal runaway. After determining the accuracy of the model, taking the external heating power as input, the maximum thermal power without TRP in the external heating experiment is explored to provide reference for thermal protection of battery packs.
On the basis of this 1D model, according to the heating trigger TR method recommended by GB 38031 C.5.3.4, the trigger cell is heated by the maximum power of the heating device. 28 The power of the heating device is required as Table III, and stop heating when thermal runaway or trigger cell temperature reaches 300 °C.
Table III. The heating power selection for heater in GB 38031.
| Energy of the target battery:E(Wh) | Maximum heating power of heater:P(W) |
|---|---|
| E<100 | 30 ∼ 300 |
| 100 ≤ E<400 | 300 ∼ 1000 |
| 400 ≤ E<800 | 300 ∼ 2000 |
| E ≥ 800 | >2000 |
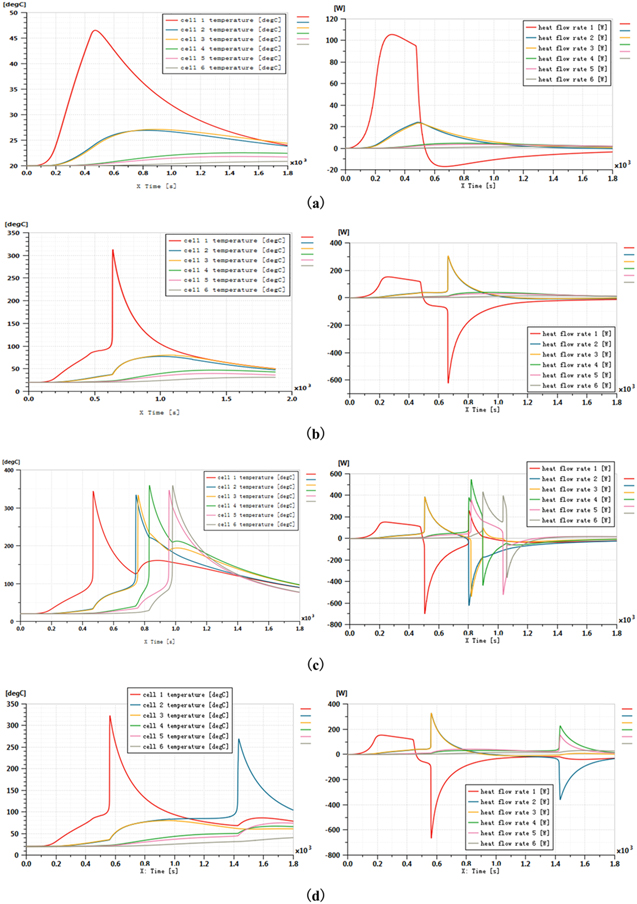
The energy of the large capacity battery used in this experiment is 750 Wh, and the maximum heating power of the heater should be 300 ∼ 2000 W. In the modeling process, the temperature of the trigger cell in the experiment is used as the trigger temperature of the cell in the simulation model. On the basis of this one-dimensional model, the maximum thermal power of the 203 Ah large capacity battery without TRP can be explored. Assuming that the heating time is 460 s, the simulation time is 1800 s, the heating power increases with a gradient of 100 W from 300 W until TRP occurs. Figure 11 shows the temperature variation and heat flow rate of each cell under different heating power. When the cell absorbs external heat, the heat flow rate is above 0. When the internal reaction of the cell occurs, the heat flow rate begins to decrease rapidly. When the cell is TR, the cell quickly releases a large amount of heat, and the heat flow rate drops to the minimum in a very short time. When the heating power was 300 W, no TR occurred in the six cells. When the heating power is 400 W, TR occurs in cell 1 and no TR occurs in cell 2–6. When the heating power is 500 W, the TR of the cell 1–6 occurs, so the maximum heating power without TRP is 400 ∼ 500 W. Further, by increasing the heating power step by step on the basis of 400 W, an accurate thermal power of 408 W can be obtained to keep the battery from TRP. When the heating thermal runaway experiment was carried out on the 203Ah battery, the heating power of 409 W could trigger the second cell, but 408 W could not. So the maximum heating power without TRP is 408W.
Figure 11. Temperature change curve and heat flow rate of cells under different heating power:(a) 300 W, (b) 400 W, (c) 500 W and (d) 409 W.
Download figure:
Standard image High-resolution image
Comparative analysis of simulation and experiment results
Comparing the 1D simulation results of AMEsim with the nail penetration experiment results of the 203Ah model, we can see the following similarities:
- (1)For each cell, there is a process whereby the temperature rises to a maximum temperature after thermal runaway and then falls to a stable temperature.
- (2)The farther the cell is from the needle position, the lower the maximum temperature can be reached. Correspondingly, the lower the temperature is when the cell is stable.
- (3)When the thermal runaway occurs, the temperature of adjacent cells will increase. The closer to the thermal runaway cell, the faster the temperature rises and the higher the maximum temperature is.
- (4)The time interval of thermal runaway of the cell is getting shorter and shorter, which is the effect of heat accumulation after thermal runaway of the previous cell.
Differences and corresponding analysis results:
- 1.In the simulation results, the maximum temperature of each cell is always lower than the maximum temperature of the experiment, and the time point of the maximum temperature is different. There are four possible reasons:
- (a)In the experiment, the 1D model of the explosion process of the cell cannot be characterized. After the explosion, bright fire and high-temperature gas are generated. At this time, the heat exchange between the cell and the environment in the nail penetration tooling cannot be calculated.
- (b)Most of the parameters used in the thermal runaway side reaction in the simulation model are directly taken from the AMEsim reference case, and the case uses a small-capacity cylindrical ternary lithium battery.
- (c)The simulation uses the temperature data at the acupuncture point obtained by the experiment as the trigger temperature, without considering the Joule heat caused by the short circuit. This process is equivalent to the external heating process, and the actual nail penetration model is not built. In general, the nail penetration condition is more abominable than the external heating.
- (d)The battery data below 90Ah in AMEsim database is relatively complete, but the simplification of the electrochemical model of 203Ah large capacity battery is not necessarily reasonable. For example, the diaphragm material between the positive and negative electrodes of the cell, simplifying the failure process will cause the difference of the maximum temperature time. Diaphragm breakdown leads to short circuit of positive and negative electrodes, releasing a lot of heat, which leads to thermal runaway of LIB. 35–39 However, this process is not instantaneous, and the failure time of different cell diaphragms is not consistent, so the maximum temperature is inconsistent.
- 2.The cell does not occur thermal runaway when the experimental temperature is very high, Maybe the temperature data measured in the experiment are the temperature of the surface of the busbar. The simulation equivalents the cell to a thermal mass block, and the results represent the average temperature of the cell.
- 3.The simulation and experimental data have large errors at the beginning and end.
- (a)The temperature difference between the initial temperature of T4 and the simulated cell 2 is large. At this time, the cell distribution point T4 rises sharply with the thermal runaway temperature of the trigger cell, and the model characterizes the average temperature of the cell. The heat transferred from the thermal runaway trigger cell is insufficient to make the average temperature of cell 2 rise sharply.
- (b)Simulation results of cell 5 and cell 6 have large error at the end of experiment. Battery modules used in one-dimensional simulation can only qualitatively characterize thermal characteristics and fit various internal side effects. However, during the experiment, the substances emitted by the explosion of the cell, the direction of the eruption and the way of the diaphragm short circuit are not controllable. The superposition of these factors in the later stage of the experiment will greatly affect the degree of reaction and the trend of temperature change.
- (c)The temperature at the end of curve T7 is nearly 200 °C higher than that at the end of curve T8. The possible reason is that the cell 6 is far from the trigger cell, and the accumulated heat of thermal runaway of each cell is not enough to increase the temperature of cell 6 to above 600 °C.
- 4.Compared with the simulation, the maximum temperature of the cell 2 closer to the trigger cell 1 is lower than that of the cell 3 in the experiment. The possible reason is that the experiment is cost-saving, and the battery module used for the experiment is not 100% life span. The battery aging leads to poor consistency.
- 5.Compared with the simulation results, the experimental data T4, T5 fluctuated violently at the end of the experiment. The cell explosion has a great interference on thermocouple sampling, and the data obtained are in a fluctuating state.
- 6.Compared with the simulation, the temperature of the cell drops sharply during the experiment. This may be due to the change of thermistor value caused by the cell explosion-proof valve spray valve, resulting in inaccurate reading of temperature data by data acquisition instrument.
- 7.Compared with the simulation, the temperature of the cell 6 decreases first and then rises sharply after the thermal runaway in the experiment. According to the internal structure of cell in the possible reason is that the water enters the module after the fire is extinguished by the high pressure water gun, which leads to short circuit, and then increases the temperature.
Conclusions
After unpacking, it can be found that the fire insulation pad and upper cover plate are not burned, the upper cover of the needle tooling is exploded, the explosion-proof valve port of the tooling is blocked, the explosion-proof valve of the right lower corner cell is not opened, and the cell is exploded. The results show that the material of the fire insulation pad and the upper cover plate meets the design requirements, but the upper cover cannot withstand the impact of the cells' explosion. The explosion-proof valve is blocked. Therefore, multiple explosion-proof valves should be designed to share the impact of high-pressure gas caused by the explosion of the cell in the design. At the same time, with the increase in the number of explosion-proof valves, when selecting the main material, explosion-proof valves with high temperature resistance, impact resistance and weather resistance should be selected.
In summary, the one-dimensional model can approximately characterize the nail penetration thermal runaway experiment process. More accurate side reaction parameters can improve the accuracy of the electro-thermal coupling model, and provide a reference for the subsequent battery pack heat management design. At the same time, the analysis of the experimental results can provide technical guidance for the safety performance of the mass production battery pack.
Our future work will focus on the thermal runaway experiment and 1D modeling of the battery pack. We will study the thermal runaway characteristics of the battery pack with and without the liquid cooling plate, and how to design the liquid cooling plate to delay and prevent the occurrence of thermal runaway as much as possible.