
Abstract
Cobalt-free, single crystal layered-oxide positive electrode materials like Li1+x[Ni0.6Mn0.4]1−xO2 (NM64) have received recent interest because of their low cost, high-voltage stability, and good cycle life. In this work, single crystal NM64 is successfully produced with a simple all-dry synthesis process that requires no water, no intermediate chemicals, and produces little waste. The all-dry synthesized NM64 has ≤ 4% nickel in the lithium layer based on Rietveld refinement of powder XRD patterns, has a median particle size of 2–5 μm based on SEM and particle size analysis, and has excellent high-voltage stability at C/5 up to 4.4 V vs Li+/Li compared to a commercial material. Additionally, tungsten coating is shown to decrease the median particle size and improve the cycling stability in half cells from 91% retained capacity after 100 cycles to 93% retained capacity when 0.3% tungsten is added. It is believed that this incredibly simple process could be adopted relatively easily into current commercial positive electrode manufacturing facilities to reduce the complexity, cost, and time of manufacture.
Export citation and abstract BibTeX RIS

This is an open access article distributed under the terms of the Creative Commons Attribution 4.0 License (CC BY, http://creativecommons.org/licenses/by/4.0/), which permits unrestricted reuse of the work in any medium, provided the original work is properly cited.
With the transition away from fossil fueled modes of transportation and electricity generation, lithium-ion batteries (LIBs) have exploded in popularity. The exponential growth in battery electric vehicle sales in many large economies 1 has cemented LIBs as a reliable and efficient energy storage system. However, while grid energy storage installations have also grown rapidly with the growing adoption of wind and solar electricity generation, their current projected deployment rate is still below the rate required to get to net zero greenhouse gas emissions by 2050. 2 Two main avenues exist to increase the adoption of LIBs for grid energy storage: (1) reduce the upfront cost of the LIB; and (2), increase the lifetime of the LIB, reducing their levelized lifetime cost.
Single crystal positive electrode materials have been shown to have greater cycle lifetimes than their polycrystalline counterparts. Studies from J. Li et al. showed that uncoated single crystal LiNi0.5Mn0.3Co0.2O2 (NMC532) outperformed Al2O3-coated polycrystalline NMC532 when cycled to a typical upper cut-off voltage (UCV) of 4.4 V vs graphite. 3 Another study by H. Li et al. showed that single crystal LiNi0.6Mn0.2Co0.2O2 (NMC622) faded less than polycrystalline NMC622 with a 4.4 V vs Li+/Li UCV. 4 One of the main causes of cell degradation with polycrystalline materials is believed to be particle microcracking, which has been shown to be greatly reduced with single crystal materials. Liu et al. found that single crystal NMC532, NMC622, and LiNi0.8Mn0.1Co0.1O2 (NMC811) cycled to a 4.3 V vs graphite UCV for over 1,000 cycles had little microcracking present. 5 Similarly, Han et al. found using selected area electron diffraction (SAED) that single crystal LiNi0.76Mn0.14Co0.1O2 charged to a 4.3 V vs Li+/Li UCV showed plane glide lines but no microcracks and speculated that in general, single crystal morphologies are effective at countering microcracking of layered-oxides with <80% Ni. 6 Moreover, Harlow et al. and Aiken et al. demonstrated that decreasing the UCV to 4.1, 3.8, or 3.65 V results in impressive capacity retention that could result in room-temperature-operated cells lasting decades. 7,8
However, while these lifetime estimates for single crystal positive electrodes are excellent, their cost remains a barrier. As of May 2022, positive electrode materials are 76% of the cost of the overall cell and 55% of the overall LIB pack, 9 so all possible avenues for reducing the cost of the positive electrode should be explored. One popular avenue is to limit the use of costly metals like Co, discussed later, but another, often overlooked area is the cost of manufacturing. Therefore, a holistic view that encompasses not only the raw material costs, but also the manufacturing costs and the predicted lifetime of the positive electrode material is necessary.
Figure 1a shows how modern commercial layered-oxide (R-3m phase) positive electrode materials are typically made, using a complex "precursor-sintering" process from base metals or metal oxides to the final material. This process typically produces spherical polycrystalline precursor particles with sub-micron primary crystallites that can either be calcined at a relatively lower temperature to retain their polycrystalline nature or can be calcined at a higher temperature where the precursor morphology is entirely lost in making single crystal materials. However, it also requires large amounts of purified water, a strong acid like H2SO4, and other intermediate compounds like NaOH and NH4OH that do not end up in the final electrode material. As well, the precursor-sintering process produces various waste streams requiring different processing like wastewater from ammonia stripping and solid Na2SO4, so a simpler synthesis route for making single crystal materials is desired.

Figure 1. Schematic diagram of (a) conventional "precursor-sintering" process vs (b) "all-dry synthesis" process for layered-oxide positive electrode material production.
Download figure:
Standard image High-resolution imageFigure 1b shows the "all-dry synthesis" process, which is similar to the method used in some early studies of positive electrode materials. 10 With the recent focus on single crystal materials, simpler synthesis methods like the all-dry synthesis method described here have been explored. 11,12 Other studies have even made polycrystalline layered-oxide materials from a similar method, but this also required high-energy ball milling to blend the precursors. 13 The all-dry synthesis method in this work uses the same base metals or metal oxides, shown in Fig. 2, that are the feedstocks in the precursor-sintering process via simple mixing methods; however, it does not require any acids, solvents, or intermediate compounds that do not end up in the final layered-oxide. The only waste produced is a small amount of submicron fine particulates that could be further recycled in an adjacent process necessary to recycle inevitable production scrap. This dramatically reduces the complexity, time, and cost of the synthesis of single crystal materials while it is likely to be able to be incorporated directly into current positive electrode manufacturing facilities.
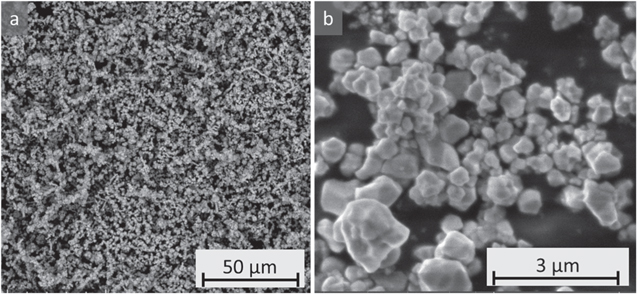
Figure 2. SEM micrographs of (a) Ni powder from Vendor 1 and (b) electrolytic manganese dioxide (EMD) from Vibrantz Technologies used as precursors for the all-dry synthesis.
Download figure:
Standard image High-resolution imageFurthermore, the use of certain coatings on layered-oxide materials has been shown to improve cycle life. 3,14–17 Specifically, tungsten (W) has gained interest for its ability to improve the cycle lifetime in Ni-rich positive electrode materials. 15,16 However, its application has thus far been focused on coating hydroxide polycrystalline precursors 15–17 as in the precursor-sintering process of Fig. 1a. It has been shown that most of the W forms Li4+xNi1−xWO6 phases (x = 0 and 0.1) on the surface of the secondary particles or in the grain boundaries between primary grains of the polycrystalline layered-oxide and only a tiny amount dopes into the structure, 17 so it will be treated as a coating in this study. In this study, a W precursor will be added in the initial step of the all-dry synthesis process instead, allowing for a much simpler path to a better-performing positive electrode material.
Finally, the choice of layered-oxide chemistry is discussed. Current trends in the positive electrode arena have focused heavily on reducing or eliminating the use of Co 18 due to its relatively high cost 19 and the human rights abuses in regions where it is mined. 20 A 2019 study from this research group found that substituting 5% Co was no better than Al or Mg at reducing Ni in the Li layer (NiLi). 18 Moreover, they observed that 5% Co substitution for Ni in LiNiO2 (LNO) did not "suppress the multiple phase transitions observed... during charge and discharge" that are believed to lead to poor capacity retention. 18 Therefore, single crystal, Co-free Li1+x[Ni0.6Mn0.4]1−xO2 (NM64) made by the all-dry synthesis method with a comparison to a vendor material prepared by the precursor sintering approach will be explored in this study.
Experimental Details
All-dry synthesis
The Li1+x[Ni0.6Mn0.4]1−xO2 (x = 0.074, 0.083, 0.091, 0.099, and 0.107; Li/TM ratios = 1.16, 1.18, 1.20, 1.22, and 1.24) composite materials were synthesized using one of two all-dry synthesis methods. Both methods employed Ni metal powder (∼1 μm, 99.3%) shown in Figure 2a, electrolytic manganese dioxide (EMD, Vibrantz Technologies; ∼1 μm, ∼60.5% Mn) shown in Figure 2b, LiOH·H2O (FMC Corporation, USA), and optionally ammonium metatungstate hydrate (AMTh; Fluke Analytical, ≥99%). Method 1 (M1) comprised mixing all powders by hand grinding for 10 min with an agate mortar and pestle. Method 2 (M2) involved mixing all powders by auto grinding for 1 h in an automated agate mortar and pestle (AGA, Ishikawa Kojo Co. Ltd., Tokyo, Japan). After mixing, samples were placed in an alumina crucible and calcined in a 2'' diameter furnace at a 5 °C min−1 ramping rate under a continuous flow rate of 60 sccm of O2 atmosphere (Air Liquide, 99.999% O2, <3 PPM H2O, <0.5 PPM THC). M1 consisted of heating first to 670 °C and holding for 5 h, then cooling and regrinding by hand before heating up to 925 °C and holding for 20 h. M2 encompassed heating to 950 °C and holding for 12 h. Once cooled, the pristine powder from either M1 or M2 was run through a jet mill (Model 00 Jet-O-Mizer; Glen Mills Inc., Clifton, NJ, USA) at ∼1 g min−1 supplied by 100 PSI dry air (Air Liquide, 20%–22% O2, <3 PPM H2O, <0.1 PPM THC) to break particle agglomerates and separate out undesired fine particulates (« 1 μm), resulting in a mass-dependent ≥70% powder recovery (higher masses of feedstocks had greater recovery). Jet milling (JM) was followed by reheating (RH) at 750 °C with a 5 h hold time, using the same parameters as the calcination, to allow any residual Li2CO3 and LiOH to melt and react with the already-formed NM64 structure. NM64 samples were stored in a desiccator over a bed of desiccant which produced an atmosphere with 21%–25% relative humidity.
Powder X-ray diffraction (XRD)
Powder XRD was conducted with a Bruker D8 diffractometer equipped with a Cu target X-ray tube and a diffracted beam monochromator. The scattering angle range of the measurements were from 15° to 80° with 0.02° steps with a 3 s dwell time. The X-ray diffraction patterns were fit via Rietveld refinement using the Rietica software. 21 An R-3m space group and a stoichiometry of Li1+xNi0.6−xMn0.4O2 were used for the refinement, with Li and cation-mixed Ni occupying 3a sites, excess Li and transition metals in 3b (TM) sites, and oxygen in 6c sites. Constraints in which Li and Ni could be interchanged with a fixed stoichiometry were applied to determine the amount of NiLi. The Mn amount was kept constant because the scattering powers of Ni and Mn are similar, so it was not deemed important to maintain a 6:4 ratio of Ni and Mn in the transition metal layer. Additionally, the (003) peak of many spectra was too intense to fit, even when a preferred orientation correction was included, so it was excluded in the final fitting.
Titrations
pH titrations were performed on a Mettler Toledo G20 compact auto-titrator with a ∼0.05 M HCl titrant. 100 mg of positive electrode powder was water aspirator filtered with 40 ml of reverse osmosis (RO) water. This exposed the powder to water for ∼30 s, long enough for residual surface species like LiOH and Li2CO3 to dissolve but insufficiently long for significant ion-exchange of Li+/H+ to occur in the samples. 22 The water that passed through the filter was collected for analysis by acid titration.
Scanning electron microscopy (SEM)
The size and morphology of the samples were characterized using a ThermoFisher Scientific Axia ChemiSEM (USA). Electrons were generated using a W filament and the SEM was operated in secondary electron analysis mode with an accelerating voltage of 5 kV and an emission current of ∼6 pA. Imaged samples were prepared by spreading the powders onto adhesive carbon tape (NEM high purity tape, Nisshin EM Co., Japan). Particle size analysis of the precursors made from M1 and M2 was performed using the ImageJ software. 23 The process was first to use the thresholding tool on the SEM micrographs in Fig. S1 with a greyscale value of 75, then the particle analysis tool was used and excluded any particles <5 pixels2.
Particle size analysis (PSA)
A Horiba Partica laser scattering particle size distribution analyzer (LA-950V2) was used to collect particle size distributions in RO water for the synthesized powders at the various steps in the synthesis: pristine (after initial heating), post-JM, and post-JM and RH.
Inductively coupled plasma optical emission spectrometry (ICP-OES)
ICP-OES measurements were carried out on the vendor NM64 material using a Perkin Elmer Optima 8000 ICP-OES Spectrometer to determine the elemental composition of samples (as metal ratios). Standard solutions of 0.0, 0.5 and 1.0 μgml−1 for Li and 0, 1 and 2 μgml−1 for Ni and Mn were prepared by diluting the standards in 2% HNO3. 8–10 mg of unrinsed sample was dissolved in 2 ml of aqua regia (1:3 HNO3:HCl) before dilution in 2% HNO3.
Coin cell electrochemical testing
Electrodes for testing electrochemical performance were prepared by mixing synthesized or vendor NM64 materials, polyvinylidene fluoride (PVDF Kynar 301 F, Arkema) and carbon black (Super S, Timcal) in a mass ratio of 92:4:4, with N-methyl-2-pyrrolidone (NMP, Sigma-Aldrich, 99.5%) added in a ratio of 1:1 (w/w) of solid to liquid. The slurry was mixed in a planetary mixer (Kurabo Mazerustar KK-50S, Osaka, Japan) in three 100 s intervals and then uniformly coated by hand on 15 μm aluminum foil with a 0.006' (∼150 μm) notch bar for an active mass loading around ∼9 mg cm−2. After drying for ∼2 h at 120 °C, the positive electrode coatings were calendared at 2000 atm and punched into 12.75 mm diameter circular electrodes. They were then dried at ≥90 ℃ for ∼10 h under vacuum and transferred inside an Ar-filled glovebox for fabrication of CR2325 (23 mm diameter by 2.5 mm height) coin cells.
CR2325 half coin cells were assembled with the fabricated positive electrode, two layers of polypropylene separator (Celgard #2300) and two layers of 1.4 cm diameter discs of 125 μm thick Li metal foil (Albermarle, >99.99%) as the negative electrode. They were constructed with a 400-series stainless-steel base (Kaga Steel, Japan), polypropylene gasket (Adair Plastics, Minneapolis, MN, USA), 304 stainless-steel spacer (Boker's, Inc., Minneapolis, MN, USA), stainless-steel disc spring (Schnorr Corporation, Ann Harbor, MI, USA), and a 300-series stainless-steel cap (Kaga Steel, Japan). Each cell contained 12–13 drops (∼20 μl per drop) of 1.2 M LiPF6 (Shenzhen CapChem, 99.9%) in a fluoroethylene carbonate (FEC)/dimethyl carbonate (DMC) 1:4 (v/v) solvent (Shenzhen Capchem, 99.99%) electrolyte. All electrolyte components were utilized as received and prepared in a glovebox. Coin cells were tested using E-One Moli Energy (Maple Ridge, BC, Canada) testers in 30.0 ± 0.1 °C temperature-controlled chambers.
Cells were cycled with a constant-current (CC) protocol between 3.0 V and UCVs of either 4.2 or 4.4 V vs Li+/Li, with two initial "formation" cycles at C/20 followed by C/5 for 100 cycles with another two C/20 "checkup" cycles every 50 cycles. The C-rate was calculated based on the active mass with a theoretical capacity of 155 mAh g−1 for the 4.2 V UCV and 190 mAh g−1 for the 4.4 V UCV.
Pouch cell electrochemical testing
204035-size dry vendor supplied NM64/artificial graphite (240 mAh) pouch cells were balanced to 4.5 V for high voltage operation. The same NM64 vendor material was used in coin and pouch cells, and the graphite in the pouch cell was Kaijin AML400. Pouch cells were machine made and vacuum sealed in a dry room in China before being shipped to Dalhousie University from Li-Fun Technology (Xinma Industry Zone, Golden Dragon Road, Tianyuan District, Zhuzhou City, Hunan Province, PRC, 412000).
The electrolyte used in the pouch cells consisted of a mixture of EC:DMC in a ratio of 15:85 (w/w, <20 ppm water, Shenzhen Capchem), 1.5 M LiPF6 (Capchem) salt, and additives by weight 2% FEC, 1% lithium difluorophosphphate (LFO), and 1% triallyl phosphate (TAP).
Prior to filling with electrolyte, pouch cells were transferred into a glovebox, where they were cut open and vacuum dried for 14 h at 120 °C to remove residual moisture present during cell manufacturing. After heating, all cells were filled with 0.85 ml (∼1.1 g) of electrolyte and vacuum sealed under −90 kPa pressure in a vacuum sealer (MSK-115 A, MTI Corp) for 4 s with a 165 °C sealing temperature on both top and bottom bars. Once filled and sealed in the glovebox, cells were charged to 1.5 V and held there for approximately 24 h at room temperature to make sure the electrodes were fully wetted with electrolyte. Once sufficiently wetted, pouch cells were transferred to a 40.0 ± 0.1 °C temperature-controlled chamber and connected to a Maccor Series 4000 (Tulsa, OK, USA) test system to complete a single formation cycle. Cells were then charged to either a 4.3 V or 4.4 V vs graphite UCV, held at that UCV for 1 h, discharged to 3.0 V, and then charged to ∼50% state-of-charge (SOC) corresponding to a voltage of 3.8 V. This formation cycle was completed using a nominal C/20 rate (12 mA). Next, the pouch cells were moved back into a glovebox where they were cut open, degassed, and vacuum-sealed again to remove any gasses produced during the formation process. For long-term cycling, the pouch cells were cycled on Neware Battery testers (China) using a constant-current, constant-voltage (CCCV) protocol between 3.0 V and either 4.3 or 4.4 V at C/3 in CCCV mode during charge with cut-off current corresponding to C/20 and CC mode during discharge at C/3, with C/20 "checkup" cycles every 50 cycles, all at 40 °C.
Results and Discussion
The NM64 positive electrode materials made with a Li/TM ratio of 1.24 by the all-dry synthesis process using M1 (hand grinding), hereafter referred to as M1-L124W00 and M1-L124W03 for the W-free and 0.3% W samples, respectively, show R-3m phase purity as illustrated in Figs. 3b and 3c. Figure 3a shows the reference vendor NM64 material's partial XRD pattern which also shows phase purity. Both M1 NM64 samples have a small peak around 21° which is likely evidence of short-range super-lattice ordering of the Li, Ni, and Mn atoms in the transition-metal layers due to the excess Li. 24 Table S1 lists the NiLi, which for M1-L124W00 is 3.37% and 3.93% for M1-L124W03, both similar to the vendor material which had 3.39% NiLi. Additionally, the peak positions in the M1 and M2 materials are at higher scattering angle than the vendor material, indicating a smaller unit cell for the vendor material than the all-dry synthesized materials, which is also observed in Table S1. An ICP-OES measurement of the vendor NM64 indicates a Li/TM ratio of 1.17 ± 0.01, lower than these all-dry synthesized samples, and the presence of 0.7% Co, both of which result in a larger unit cell. 18,25

Figure 3. XRD data (black circles) and Rietveld refinement (red line) results of NM64 made by (a) a vendor and reheated (RH) in the lab, (b) all-dry synthesis using M1 without W (M1-L124W00), and (c) with 0.3% W (M1-L124W03). All-dry synthesis materials had a Li/TM ratio of 1.24 and were JM then RH.
Download figure:
Standard image High-resolution imageFigure 4 demonstrates that NM64 samples with a Li/TM ratio of 1.24 made by M2 (auto grinding), hereafter referred to as M2-L124W00 and M2-L124W03 for the W-free and 0.3% W samples, respectively, show excellent R-3m phase purity without any obvious super-lattice ordering peaks. The M2 samples have 2.62% and 2.37% NiLi for M2-L124W00 and M2-L124W03, respectively, according to Table S1. Both the lack of super-lattice ordering peaks and lower NiLi compared to the M1 samples with the same Li/TM ratio indicate that well-mixed precursors are necessary for phase purity. Figure S1 illustrates that while the M1 hand ground precursors have more large particle agglomerates of varied sizes, the M2 auto ground samples have far more consistent particle sizes. Moreover, phase pure NM64 was obtained by the M2 process with a Li/TM as small as 1.16, denoted in Table SI, while material made by M1 was not phase pure below Li/TM = 1.20 (not shown). This emphasizes the importance of mixing the precursors well and selecting the appropriate calcination conditions which differ between M1 and M2, namely a higher final temperature of 950 vs 925 °C for M2 over M1, which may also contribute to the better phase purity of M2 samples.
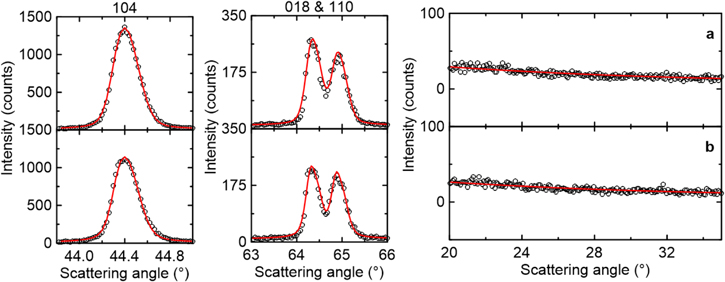
Figure 4. XRD data (black circles) and Rietveld refinement (red line) results of NM64 made by (a) all-dry synthesis using M2 without W (M2-L124W00), and (b) with 0.3% W (M2-L124W03). Both materials have a Li/TM of 1.24 ratio and were measured post-JM and RH.
Download figure:
Standard image High-resolution imageWhile the goal of the all-dry synthesis is to make purely single crystal materials, the pristine material made after the high-temperature calcination at either 925 or 950 °C (M1 or M2) consists of large crystallite agglomerates as shown in Fig. 5a for M1-L122W00. Therefore, it was necessary to break apart these agglomerates after JM which results in evenly dispersed single crystals, illustrated in Fig. 5b. These underwent RH at 750 °C to reduce the amount of residual Li compounds on the surface which did not appreciably affect the particle size as shown in Fig. 5c. Details of this process are described in the Experimental Details section above. All materials presented here have undergone this JM and RH procedure.

Figure 5. SEM micrographs of NM64 (M1-L122W00) (a) pristine, (b) post-JM, and (c) post-JM and RH.
Download figure:
Standard image High-resolution imageThe residual surface Li+ content was also tracked from the pristine, to post-JM, and to post-JM and RH samples. NM64 made with a series of Li/TMs from 1.16 to 1.24 using the M2 process are labelled M2-L116W00 to M2-L124W00 for W-free and M2-L116W03 to M2-L124W03 for samples with 0.3% W. Figures 6a and 6d show that the pristine materials made by M2 with and without W have considerable residual Li+. The first plateau around a pH of 10–11 is a combination of LiOH being titrated by HCl to LiCl and H2O, and Li2CO3 being titrated to LiHCO3 and LiCl. The second sloping plateau around a pH of 5–8 is only the titration of the LiHCO3 made in the first plateau into H2CO3 (or dissolved CO2) and LiCl. Therefore, the relative length of each plateau within a single titration indicates the ratio of LiOH and Li2CO3 present as residual Li+ on the NM64 particles' surface (see Ref. 22 for more details on acid-base titrations). Comparing the pristine samples in Figs. 6a and 6d to the post-JM samples in Figs. 6b and 6e show that while the total volume of HCl titrant used for each Li/TM sample is similar, there is clearly more Li2CO3 and less LiOH after JM than when pristine. This makes sense because the samples were stored in semi-dry air and underwent JM in dry air, both containing CO2, so conversion of LiOH to Li2CO3 could readily occur. However, after RH at 750 °C, all M2 materials have far lower residual Li+, comparable to the pristine vendor sample as illustrated in Figs. 6c and 6f. This indicates that Li+ that was unable to be incorporated into the layered-oxide structure during the initial heating was able to be incorporated after further breaking apart the agglomerates, creating more active surface area for this reaction during RH. This is supported by previous research showing that with 40% Mn and the amounts of Li tested here, heating under pure O2 gas flow should result in negligible Li loss to evaporation and therefore it must incorporate into the structure if it is no longer a residual surface species. 25
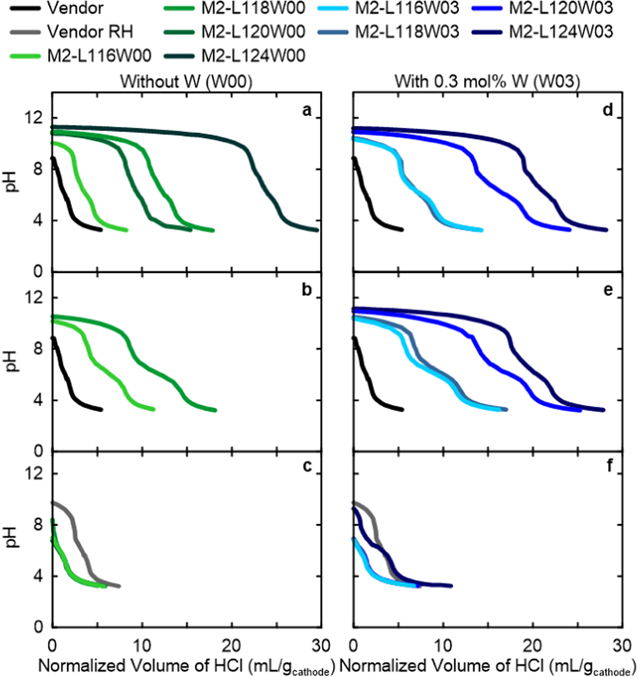
Figure 6. Raw titration data collected for samples (a), (d) after initial heating at 950 °C (pristine), (b), (e) post-JM, and (c), (f) post-JM and RH. The first column contains results for all-dry synthesized materials made with the M2 process without W (W00) and the second column shows the same but with 0.3% W (W03). The results for pristine and after RH vendor material is also shown in both columns.
Download figure:
Standard image High-resolution imageFigure 7 shows the residual Li+ content as calculated from the raw titration data of Fig. 6, which clearly shows little effect post-JM on the total residual Li+ (which is agnostic to the Li species) but shows a major decrease after subsequent RH. All samples, except for the M2-L124W03, have around 0.1 wt% of residual Li+, corresponding to the equivalent of 0.53 wt% Li2CO3. These values align with the amount of residual Li+ on the pristine vendor sample, indicating the effectiveness of the all-dry synthesis process.
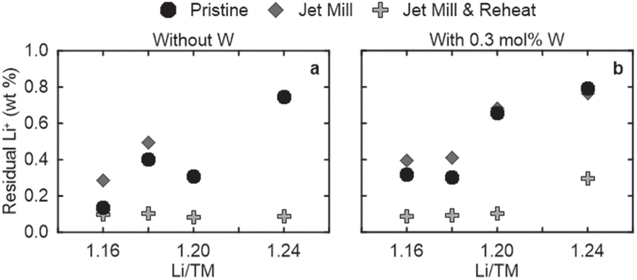
Figure 7. Titration data for samples studied after the various points in the synthesis of material (a) without W and (b) with 0.3% W made by M2. Data for after initial heating at 950 °C (pristine), post-JM, and post-JM and RH are plotted.
Download figure:
Standard image High-resolution imageNext, the use of W in the all-dry synthesis is discussed. W is known to primarily exist on the surface of layered-oxide positive electrode materials rather than as a bulk dopant. 17 As well, W inhibits the growth of primary crystallites, 15,16 which is supported by the comparison in Fig. 8. Samples made without W have larger median particle size (D50). For example, M2-L116W00 and M2-L118W00 have D50s of 3–5 μm whereas M2-L116W03 and M2-L118W03 have D50s around 2 μm each, as shown in Fig. S3e. However, for the higher Li/TM ratios of 1.20 and 1.24, the D50s increased from around 4 μm for M2-L116W00 and M2-L118W00 to 5–6 μm for M2-L120W03 and M2-L124W03 according to Fig. S3e. Figure 8 shows that at least for the Li/TMs of 1.16, 1.18, and 1.20, the primary crystallites do appear smaller when 0.3% W is present, so any increase in D50 for the higher Li/TMs is caused by particle agglomerates. Further agglomeration post-RH is supported by Fig. S3d which shows the change in D50 from post-JM to post-JM and RH. This may be caused by LixWyOz phases melting at 750 °C during the RH and upon cooling, fusing single crystals together.

Figure 8. SEM micrographs of the vendor material and all-dry synthesized samples made by the M2 process with various Li/TM ratios after JM and RH, with and without W.
Download figure:
Standard image High-resolution imageIt is also worth mentioning that NM64 made by the M1 process has smaller primary crystallites than the M2 analogues. Figures S2 and S4 show the SEM micrographs and PSDs of the M1 samples, with a 2.1 μm D50 for M1-L124W00 and 1.7 μm D50 for M1-L124W03, respectively.
NM64 samples made by the all-dry synthesis M1 procedure show good results in half coin cell testing when compared to the vendor material. For clarity, the voltage as a function of specific capacity curves were incremented by +0.4 V in Figs. 9a and 9d, which demonstrate that while the vendor RH NM64 sample has the largest first charge capacity, the all-dry synthesized materials are not much lower. At the 4.2 V vs Li+/Li UCV, the vendor RH material has 161 mAh g−1 on first charge, while M1-L124W00 and M1-L124W03 have 147 and 153 mAh g−1, respectively. At the 4.4 V vs Li+/Li UCV, the vendor material has 191 and 200 mAh g−1 on first charge for pristine and RH samples, while M1-L124W00 and M1-L124W03 have 187 and 191 mAh g−1, respectively. The W containing samples have consistently more capacity than those without W, likely due to the decreased particle size leading to a lower average Li+ diffusion path length.
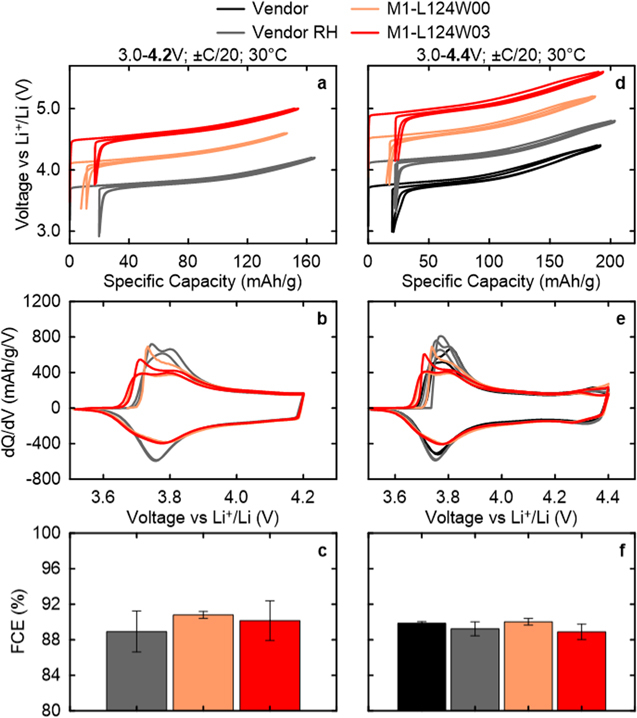
Figure 9. Formation data from coin half cells at 30 °C with vendor material and samples made via M1 with 4.2 and 4.4 V vs Li+/Li UCV: (a), (d) voltage vs specific capacity with voltage curves sequentially offset by +0.4 V; (b), (e) dQ/dV vs voltage; and (c), (f) first cycle efficiencies.
Download figure:
Standard image High-resolution imageMoreover, Figs. 9c and 9f show that the first cycle Coulombic efficiency (FCE) for the vendor material, M1-L124W00, and M1-L124W03 are all around 89%–91%. These results are on par with those found by Zheng et al. for NMC622 materials charged up to 4.3 V, 11 but at a higher UCV and without any Co present here.
The dQ/dV curves in Figs. 9b and 9e show that the polarization on first charge of the all-dry synthesized samples with 0.3% W is lower than those without W. The onset of the feature around 3.70 V in M1-L124W00 is shifted lower to about 3.67 V in M1-L124W03; however, on subsequent cycles they overlap. The reason for this initial polarization difference is unknown.
While the all-dry synthesized NM64 materials are tested exclusively in half coin cells, long-term cycling data at 40 °C has been collected for the vendor material in full pouch cells. Figure 10b shows that the vendor NM64 retains 91.1% of its initial capacity after 850 cycles at C/3 up to a 4.3 V vs graphite UCV, which corresponds to roughly 4.4 V vs Li+/Li in a half cell. Even at the strenuous 4.4 V vs graphite UCV, Fig. 10d illustrates that the vendor material retains 91.1% capacity after 633 cycles and only reaches 80.7% of the original capacity after 1290 cycles. It is therefore reasonable to expect that if the all-dry synthesized NM64 can match the performance of the vendor NM64 in half cells, with further development and optimization an all-dry synthesized material could achieve similar performance in full pouch cells.

Figure 10. Full pouch cell cycling capacity fade data at C/3 and 40 °C from the vendor NM64 material cycling up to (a), (b) 4.3 V vs graphite, and (c), (d) 4.4 V vs graphite UCV. The normalized capacity is relative to the fifth C/3 discharge. 4.3 V in a full cell corresponds approximately to a 4.4 V vs Li+/Li in a half cell.
Download figure:
Standard image High-resolution imageThe cycling data for the all-dry synthesized NM64 samples made by M1 are shown to match and outperform the vendor NM64 in half coin cells. Figures 11a and 11b show that at the 4.2 V UCV, the all-dry synthesized and vendor materials have excellent capacity retention. After 104 cycles, the vendor RH NM64 has retained 93.3% of its original capacity, while M1-L124W00 has 96.0% and for M1-L124W03 has 97.5% retained capacity, respectively. While the vendor RH NM64 has more initial capacity, due to its greater fade rate by 104 cycles, their capacities are essentially the same with 125, 125, and 127 mAh g−1 for the vendor, M1-L124W00, and M1-L124W03, respectively.
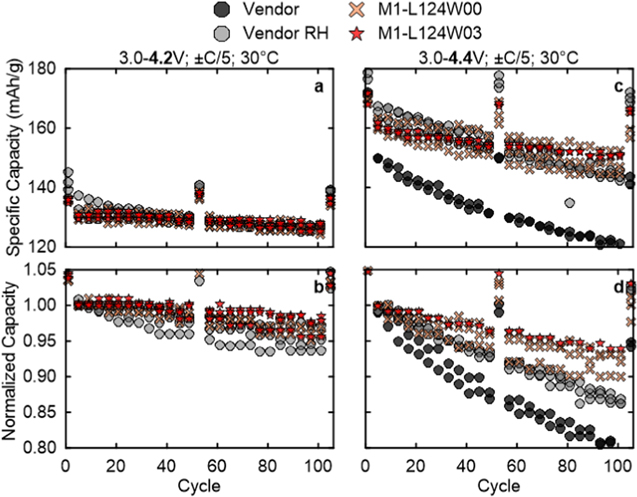
Figure 11. Half coin cell cycling at C/5 and 30 °C up to (a), (b) 4.2 V and (c), (d) 4.4 V vs Li+/Li UCV for NM64 made by M1 with Li/TM = 1.24 and compared to the vendor NM64.
Download figure:
Standard image High-resolution imageAt the 4.4 V UCV, Figs. 11c and 11d show much the same trend: initially the vendor RH NM64 has more capacity than either M1-L124W00 or M1-L124W03, but the all-dry synthesized materials have less fade over 104 cycles so end up with greater capacity. However, the pristine vendor NM64 inexplicably has a far lower capacity and worse fade than all groups, despite having lower residual Li+ than after RH, per the previous discussion. The retained capacity after 104 cycles is 78.8% and 87.0% for the pristine and RH vendor material, which corresponds to discharge capacities of 119 and 145 mAh g−1, respectively. Impressively, the corresponding retained capacity is 91.4% and 93.6% for M1-L124W00 and M1-L124W03, which equate to 147 and 151 mAh g−1 for each. Overall, the all-dry synthesized materials outperform the vendor material in retained capacity, and have the best performance with 0.3% W.
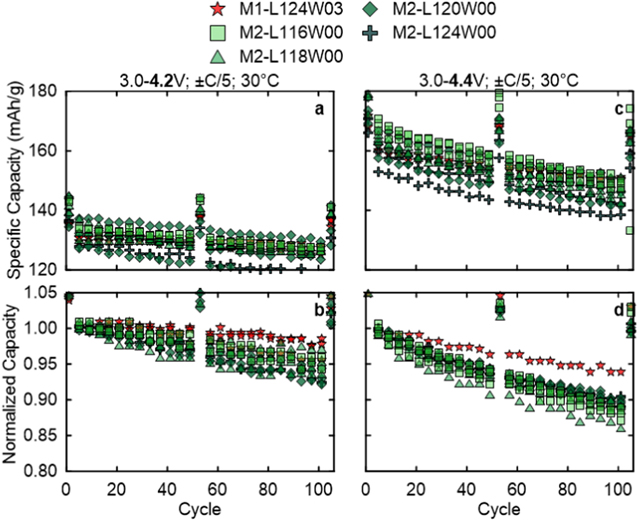
Now the all-dry synthesized NM64 made with the M2 procedure is compared to the best M1 sample, M1-L124W03, in half coin cells (see Fig. S5 for the first cycle data). Figures 12a and 12b show the discharge specific capacity and retained capacity with the 4.2 V UCV for the series of M2-L116W00 up to M2-L124W00. Compared to M1-L124W03, the M2 materials tend to have slightly higher discharge capacities, but with lower retained capacities. After 104 cycles, M2-L116W00 has 94.7% retained capacity for 126 mAh g−1, M2-L118W00 retains 95.3% capacity for 127 mAh g−1, M2-L120W00 has 93.7% retained capacity for 124 mAh g−1, and M2-L124W00 retains 92.5% capacity for 118 mAh g−1. At the 4.4 V UCV, again the M2 materials tend to start with higher discharge capacities than M1-L124W03 but through cycling have lower retained capacities. After 104 cycles, M2-L116W00 has 88.0% retained capacity for 149 mAh g−1, M2-L118W00 retains 87.9% capacity for 145 mAh g−1, M2-L120W00 has 89.4% retained capacity for 145 mAh g−1, and M2-L124W00 retains 88.8% capacity for 139 mAh g−1. Counter to the expected trend, NM64 with less excess Li have higher capacities despite having higher NiLi which inhibits Li+ diffusion. 26 Overall, the half coin cell cycling shows that all-dry synthesized NM64 by M1 or M2 have competitive performance.
Figure 12. Half coin cell cycling at C/5 and 30 °C up to (a), (b) 4.2 V and (c), (d) 4.4 V vs Li+/Li UCV for NM64 made by M2 with varied Li/TM and without W and compared to NM64 made by M1 with Li/TM = 1.24 with 0.3% W (M1-L124W03).
Download figure:
Standard image High-resolution image
Conclusions
In this work, two simple, all-dry synthesis processes were used to prepare single crystal NM64 positive electrode materials that matched and outperformed a reputable vendor material in half coin cell cycling. These processes do not use any solvents (including water) and produce only minimal waste. The all-dry synthesis using Method 1 (hand grinding, three heating steps) showed that single crystal NM64 with a ∼2 μm median particle size and < 4% NiLi was achieved and it retained 91.4% of its original capacity after 100 cycles at C/5 with a 4.4 V vs Li+/Li UCV. Additionally, without any added processing steps, a 0.3% W coating was added that reduced the particle size and resulted in a 93.6% capacity retention (151 mAh g−1). As well, NM64 made with a variety of Li/TMs in the Method 2 process (auto grinding, two heating steps) showed that with improved mixing, a lower Li/TM of 1.16 was sufficient to make a single crystal material with 4% NiLi. This NM64 also retained 88.0% of its initial capacity for 149 mAh g−1. Adding 0.3% W in this process was shown to generally reduce the median primary particle size, although it may have also caused further agglomerates due to melting of tungsten compounds during the post-jet milling reheating. The effect of tungsten on these single crystal materials will be studied in the future. Overall, the all-dry synthesis process has produced excellent single crystal NM64 positive electrode materials with the potential to be readily adopted at the mass manufacturing scale.
Acknowledgments
The authors acknowledge funding from NSERC and Tesla Canada under the Auspices of the Alliance Grants Program. M.G. and S.Y. acknowledge funding from the Nova Scotia Graduate Scholarship program. M.G. also acknowledges funding from the NSERC Postgraduate Scholarship—Doctoral and from the Killam Predoctoral Scholarship—Doctoral. A.M. acknowledges funding from the NSERC USRA program.
Supplementary data (1.6 MB DOCX)