
Abstract
Silicon-graphite composite anode materials for Li-ion cells were synthesized by embedding nano-Si into voids within natural graphite by mechanofusion, followed by carbon coating by chemical vapor deposition. In the resulting structure, voids within the natural graphite were completely filled with silicon nanoparticles encapsulated in carbon. This resulted in the silicon being protected from reaction with the electrolyte. The as-prepared silicon-graphite composites were shown to cycle well in electrodes with no special binders (PVDF) and in conventional electrolytes without any additives (i.e. no fluoroethylene carbonate). Furthermore, nearly all the Si within the voids were fully active. This provides a promising and simple strategy for silicon-graphite composites that can be used as a drop-in replacement for graphite to increase Li-ion cell capacity.
Export citation and abstract BibTeX RIS

This is an open access article distributed under the terms of the Creative Commons Attribution 4.0 License (CC BY, http://creativecommons.org/licenses/by/4.0/), which permits unrestricted reuse of the work in any medium, provided the original work is properly cited.
The development of high-energy-density lithium-ion batteries is significantly important. Graphite is the most widely used active material for lithium-ion battery anodes. Compared with graphite (LiC6, 890 Ah/L), silicon has a much higher volumetric capacity (Li15Si4, 2194 Ah/L). 1 In order to develop next-generation lithium-ion batteries, silicon-based negative electrode materials have been widely studied recent years, however fundamental challenges hinder their implementation. One of these key challenges is volume expansion. During lithiation and delithiation, silicon experiences huge volume changes (280%). 2 Repeated expansion and contraction of Si during lithiation and delithiation can result in particle pulverization and nanoporosification due to the resulting stress and strain. 3,4 For the whole electrode structure, this volume expansion can destroy the electrode's integrity and therefore electrical connection amongst active particles and the current collector can become lost. 5 It has been reported that nano-sized silicon can release the internal stress from expansion and so avoid particle fracture. 6 However, nanoparticles have a large surface area which is not desirable as it may increase reactivity with electrolyte. Another issue also due to the volume change of silicon, is the difficulty of forming a stable solid electrolyte interphase (SEI) on the surface of Si-based anode materials. Particle pulverization and damage to the SEI can lead to continuous side reactions at the silicon/electrolyte surface, causing the SEI to grow. The resulting thick SEI layer can cause high polarization and lithium loss and accelerate cell failure. 7
To address these challenges, a strategy of combining silicon with graphite or carbon has been investigated for a long time. 8–14 A simple blend of silicon and graphite does not work well because the Si component of the electrode still has the issues associated with volume expansion coupled with electrolyte reactivity. 15 Instead, Si-C composite materials have been used. These have been prepared by methods including spray drying, 11,16,17 chemical vapor deposition (CVD), 18 HF leaching of Si-SiO2 composites, 14 magnesiothermic reduction of silicon oxides, 19–22 electro-sparaying, 14 and pyrolysis of n-Si/polymer composites. 10 All these methods utilize solvents or silane gas. Also common to these studies is that the major portion of the capacity of the Si/C composites comes from Si, while the carbon phase is typically a disordered or hard carbon and does not contribute significantly to the capacity. As an example, Chao Li et al. employed rotary spray drying to make silicon-carbon nanotube spherical composites. 16 The prepared material showed 2500 mAh g−1 capacity after 500 cycles. As another example, Minseong Ko et al. synthesized silicon nanolayer embedded graphite composites via CVD. 18 A thin layer of amorphous silicon was deposited onto and within porous graphite particles, followed by the deposition of a carbon overlayer. By this method, a silicon layer was deposited both on the outside and inside surfaces of spherical graphite, which significantly improved energy density. Applying the final carbon coating resulted in good cycling performance. It is well known that applying carbon-coatings onto Si-based anode materials can enhance electric and ionic conductivity and help maintain a stable SEI layer. 23–25
Mechanofusion (MF) processing, developed in Japan in the 1980s, is a common method used on a large scale to create composite particles. 24,26 Mechanofusion is a dry process that only involves mechanical action on particles, making it sustainable synthesis method. In this method particles are exposed to high shear and compaction forces. During processing, no significant impact forces occur. MF not only can coat fine particles onto coarse powders but also can cause fine particles to become embedded within course particles. In previous publications, we described the use of MF to embed guest Si-alloy particles into porous graphite host particles for the preparation of silicon alloy/graphite composite anode materials. 24 Some of the resulting composites achieved, 950 mAh g−1 (1437 Ah/L) at 2 C rate and a capacity retention of 95%/100 cycles. To accomplish this, the particles required carbon coating to protect the guest Si-alloy particles from exposure to electrolyte. Despite these promising results, the guest alloy particles were only partially embedded. This is because they had a large size distribution, resulting in many guest particles being too large to be embedded. The critical size for embedding was found to be 1 μm, with any particles larger than this remaining on the surface of the graphite. 27
In this study, a silicon/graphite composite was synthesized by embedding fine Si guest particles into cavities within graphite particles via mechanofusion as a sustainable and low-cost dry method to make Si/C composite particles. The Si guest particles utilized were all below the critical embedding size, to ensure more complete embedding. In addition, pure Si guest particles were utilized, rather than a Si alloy, so that a higher capacity could be achieved with less guest particles.
Experimental
Material synthesis
A disperse nano silicon (n-Si) powder was made by ball milling 2 g of a mixture of 95 wt% n-Si (300 nm, 99%, SkySpring Nanomaterials, Inc.) and 5 wt% stearic acid (95%, Sigma-Aldrich) with 180 g of 0.125' stainless steel balls in a 65 mL hardened steal vial with a high energy ball mill (SPEX 8000). This milling step broke up aggregates of n-Si powder in the as-received sample. The stearic acid served as a dispersant during the milling and MF processes. After ball milling, the dispersed n-Si product was recovered from the milling media by ethanol washing. This produced an ethanol slurry, which was separated from the milling media by sieving. Finally, the ethanol was evaporated from the slurry at 120 °C overnight in air, leaving behind the dispersed n-Si powder. To embed 5 wt% n-Si in graphite, 1.385 g dispersed n-Si and 25 g natural spherical graphite (A3901, Asbury Carbons) were processed in air in a mechanofusion machine (Dry Particle Fusion Machine, DPM Solutions, Hebville, NS) with a 7.66 cm diameter chamber at 3000 rpm with a 1.0 mm press head gap and 0.5 mm scraper gap. The silicon-graphite composite product after 5 hours of mechanofusion processing is referred to here as Si@Gr.
Carbon coating by chemical vapor deposition (CVD) was conducted in a custom-made CVD system as described in Reference 11. 23 Briefly, the powder is placed in a rotating quartz tube with inner opposing screws, which maintains a fluidized bed while keeping the powder sample in the center of the reaction zone in the tube. The rotating tube is heated with a laboratory tube furnace. For CVD carbon coating in this study, about 9 g of Si@Gr was placed in the rotating tube, which was heated to 800 °C in argon atmosphere. The gas was then changed to ethylene at an 80 mL/min flow rate and the sample dwelled at 800 °C for 3 hours. The gas was then changed back to argon and the sample was allowed to cool to room temperature.
Thermogravimetric analysis
Thermogravimetric analysis (TGA) measurements were conducted with a SDT Q600 V20.9 Build 20 DSC-TGA analyzer. Oxygen was used as the gas flow. Samples were heated from 20 °C to 800 °C with a scan rate of 10 degrees per minute.
Electrode preparation
Electrode slurries were prepared by mixing 0.6300 g of active material, 0.0350 g of carbon black (Super C65, Imerys Graphite and Carbon) and 0.0350 g of polyvinylidene fluoride (MW ∼534000, Sigma-Aldrich), (corresponding to a mass ratio of 90:5:5) in N-methy2-pyrrolidone (Sigma-Aldrich, anhydrous 99.5%), which was utilized in an amount required to obtain an appropriate viscosity for coating electrodes. For graphite electrodes the active material was natural spherical graphite (A3901, Asbury Carbons). For Si/graphite composite electrodes the active material was the Si/graphite composite. For Si-graphite blended electrodes 0.0315 g n-Si and 0.5984 g natural spherical graphite (i.e. a 5/95 w/w ratio) were added to the electrode slurry as the active material. All slurries were mixed for 20 minutes with a 1' (2.54 cm) diameter Cowles blade at 5000 rpm and then spread onto a copper foil (Furukawa Electric, Japan) with a 0.008' (0.2 mm) coating bar. The coatings were dried in air for 1 hour at 120 °C and then cut into 1.3 cm2 disk electrodes. Electrode loadings were ∼1.3 mAh/cm2.
Material and electrode characterization
X-ray diffraction patterns were collected with a Rigaku Ultima IV diffractometer using Cu Kα radiation in 0.05° increments. True densities were measured with a He gas pycnometer (|Q|Pyc, InstruQuest). The specific surface area was determined by the multi-point Brunauer–Emmett–Teller (BET) method using a Nova 4200e Surface Area and Pore Size Analyzer (Quantachrome Instruments). Cycled electrodes for SEM analysis were obtained by disassembling cycled cells in an Ar-filled glove box. The harvested electrodes were sealed under Ar and then transferred to a cross-section polisher (JEOL IB-19530CP) under a blanket of Ar-gas. The cross-sectioned electrodes were then transferred also under a blanket of Ar-gas to a TESCAN MIRA3 scanning electron microscope (SEM) for imaging.
Electrochemical characterization
Electrodes were assembled in 2325-type coin cells with lithium foil (Aldrich 99.9%) as a counter/reference electrode. One layer of microporous separator (Celgard 2300) and a blown microfiber membrane (3 M Company) were used as separators. 1 M LiPF6 (Gotion Inc.) dissolved in ethylene carbonate (EC, Soul Brain), and diethyl carbonate (DEC, Soul Brain) (2:1 by volume) was employed as electrolyte. Before cell making, electrodes were dried at 120 °C in vacuum overnight. Coin cell assembly was carried out in an argon-filled glovebox. Cells were cycled between 5 mV to 0.9 V using a Neware 4000 test system at a temperature of 30.0 ± 0.2 °C. Cells were held at constant potential at the end of each discharge (lithiation) half-cycle until a lower current limit was reached to simulate constant current-constant voltage (CCCV) cycling. For the first cycle, the cells were discharged to 0.5 mV at 1/20 C with a 1/40 C lower current limit at the end of discharge and then charged to 0.9 V at 1/20 C. For subsequent cycles, the cells were charged and discharged at 1/5 C with a 1/20 C lower current limit at the end of discharge. Here C-rate was defined based on a 3579 mAh g−1 capacity for Si and a 372 mAh g−1 capacity for graphite. For rate tests, cells were cycled at C/20 for the first cycle and then the rate changed every 5 cycles from C/10 to 2 C. For the last 5 cycles, the rate was restored back to C/5.
Results and Discussion
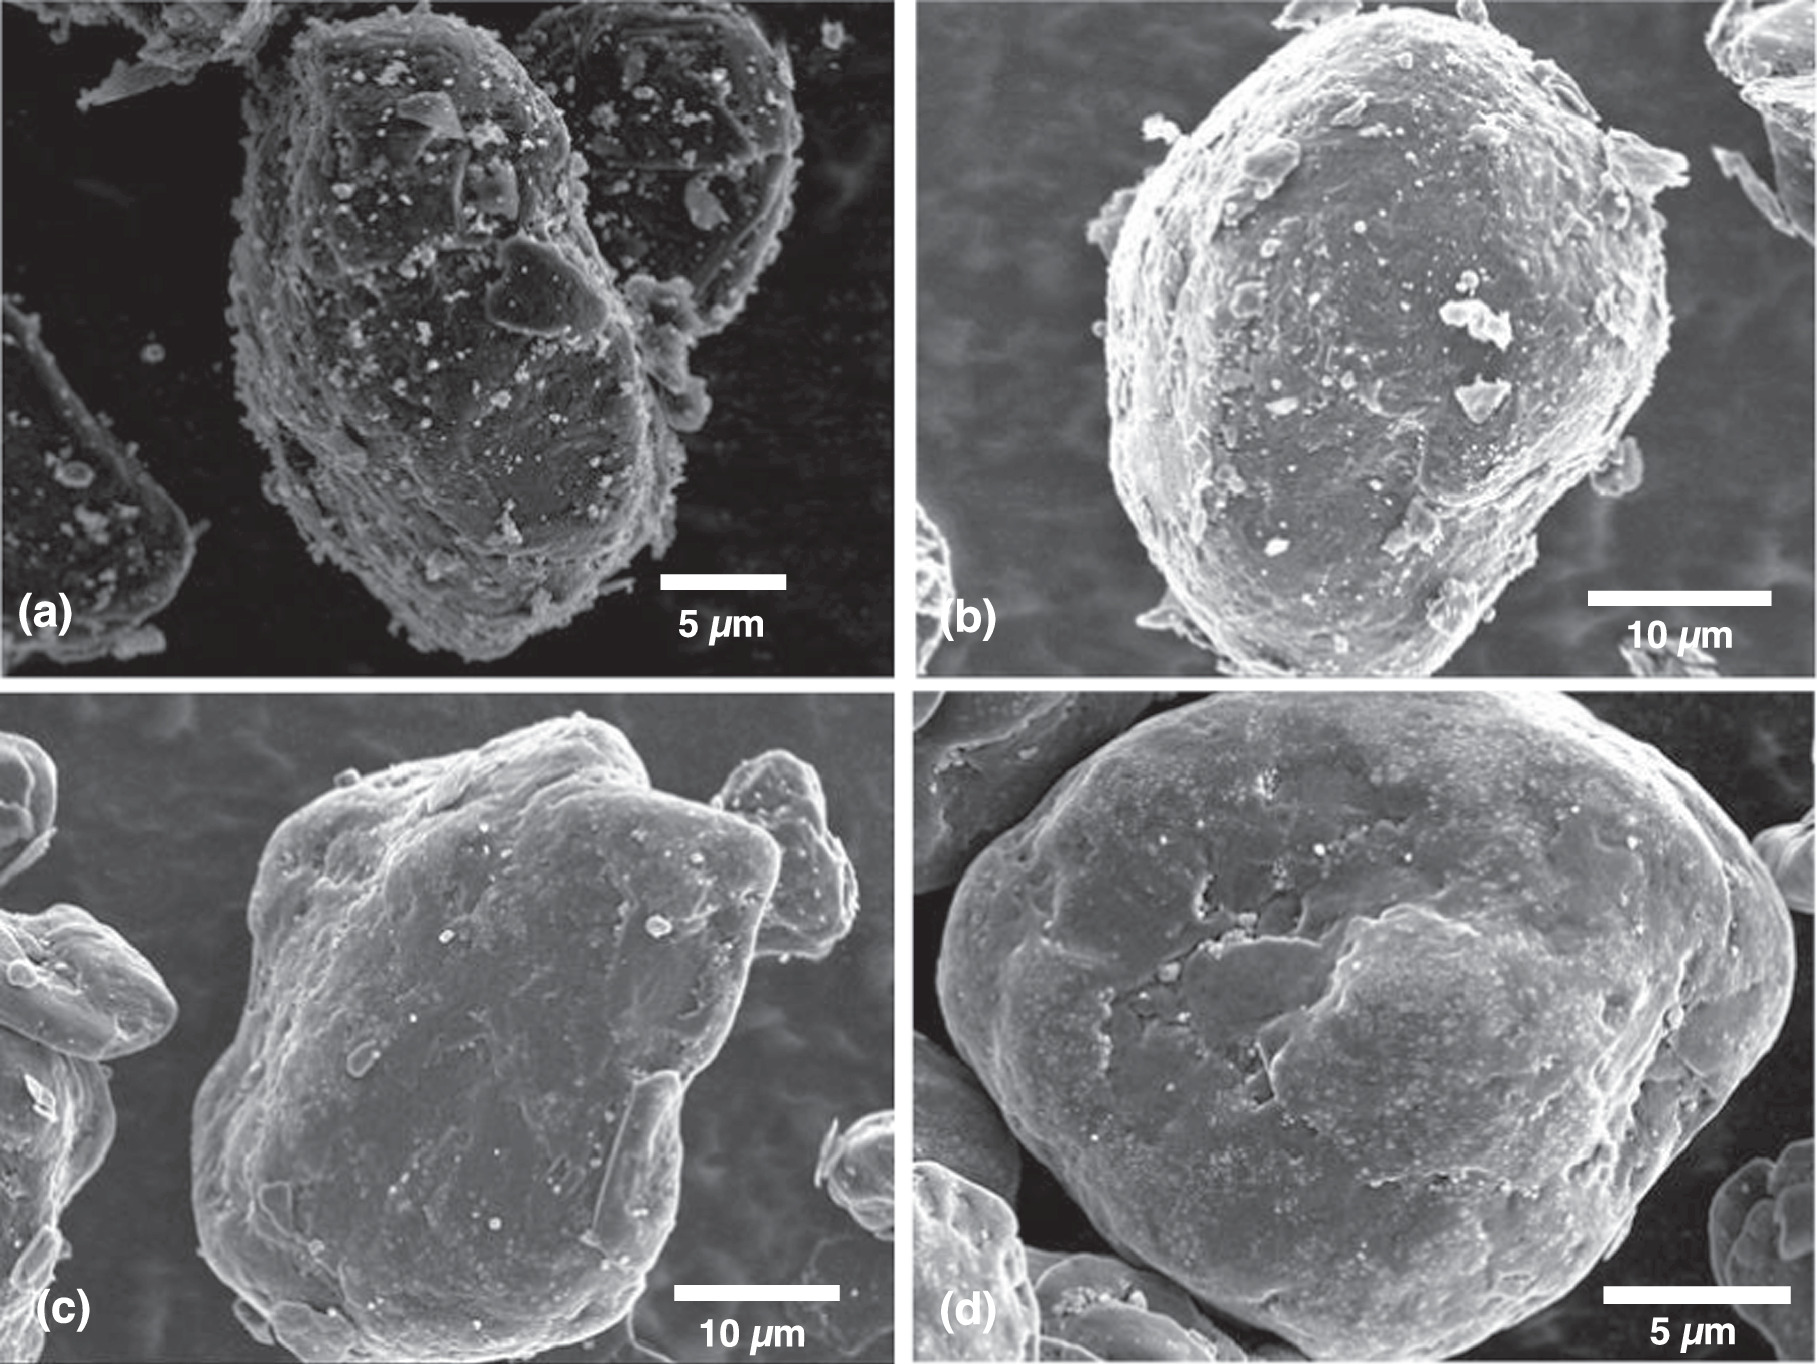
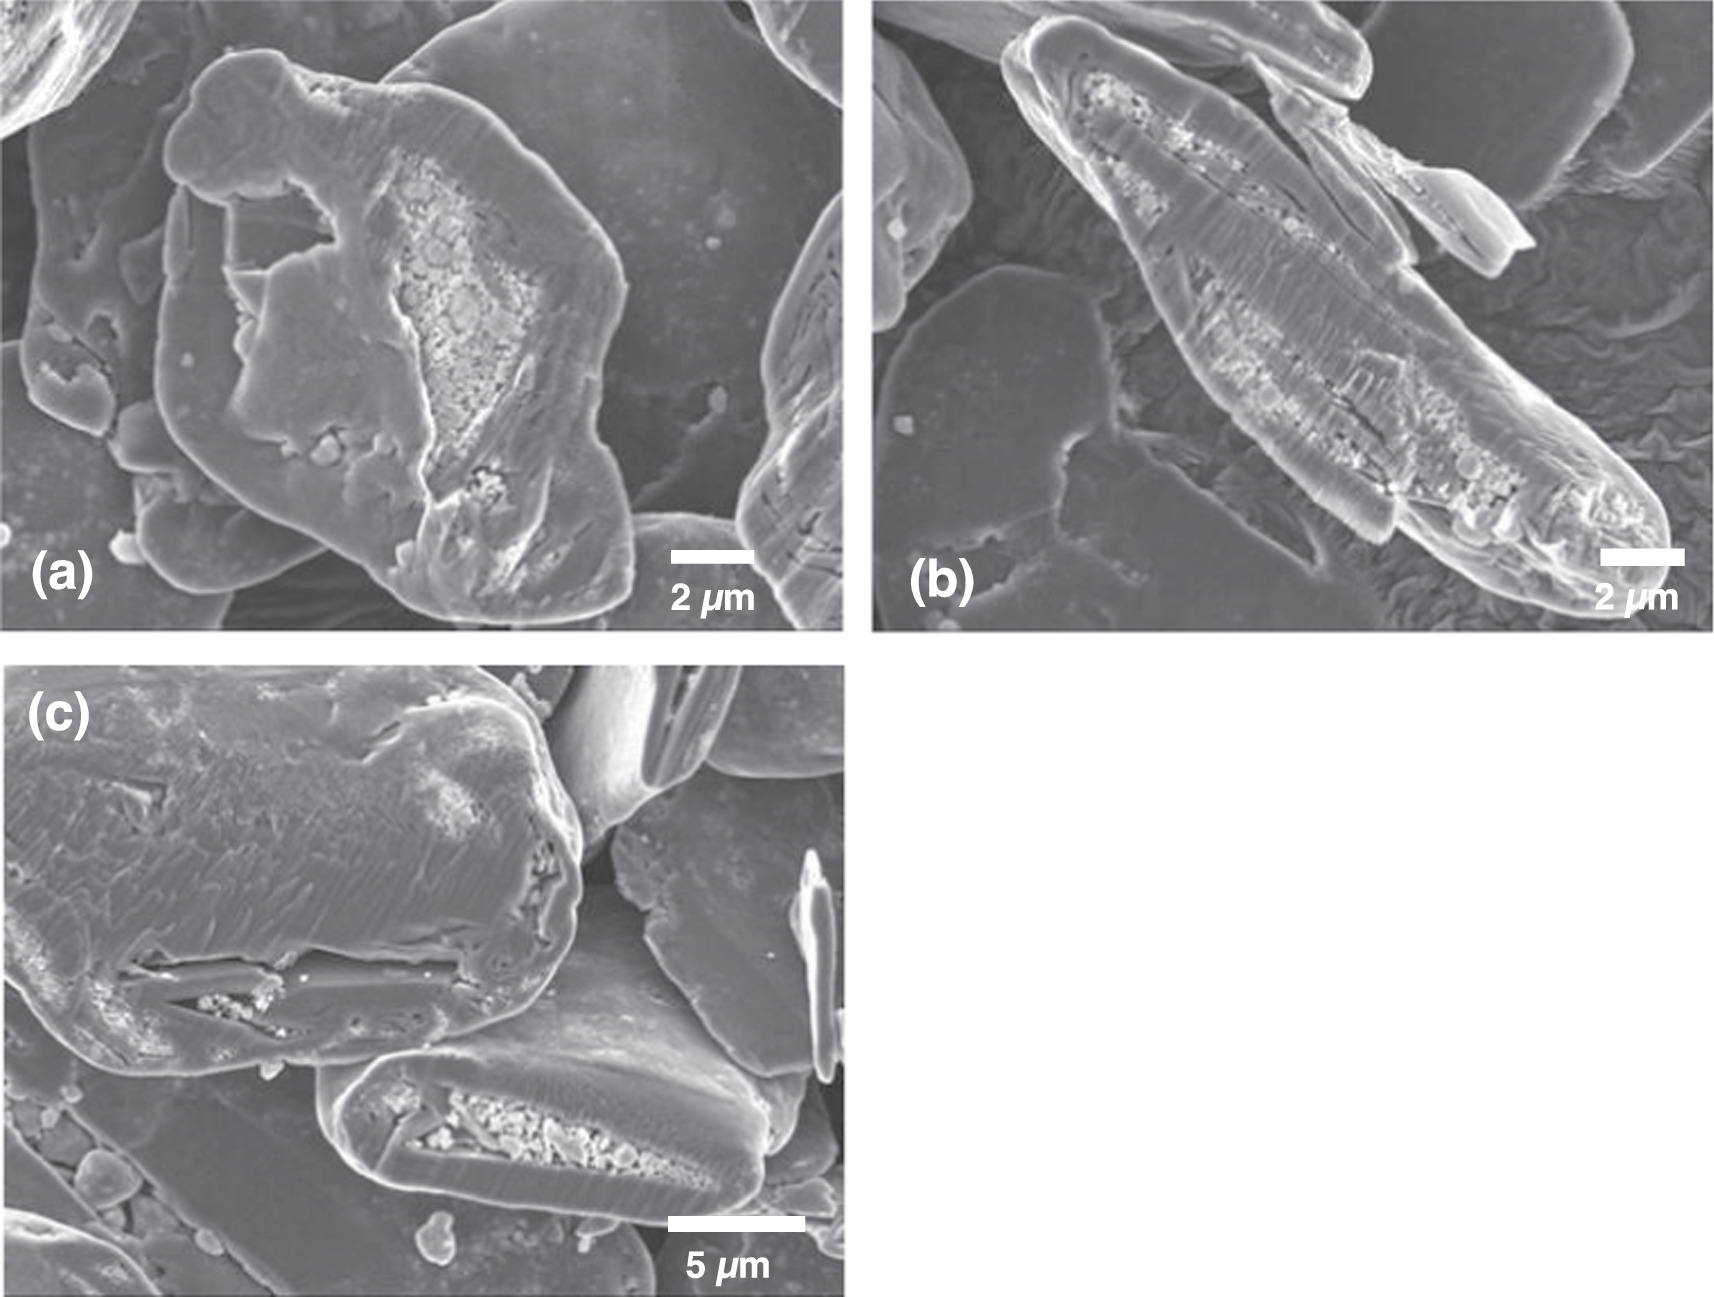
Figure 1a shows an SEM image of unprocessed graphite particles. The particles are rounded and are about 10 μm in size. On the surface of the particles individual graphite plates can be observed. A cross section of the particles, shown in Fig. 1b, reveals that the particles contain significant cavities. These cavities can account for 50% or more of the particle volume. The particles appear to be made up of sheets of graphite that are curled up. This morphology and the resulting large cavity volume is likely a consequence of the spheronization process used to make these particles from natural graphite. As a result of this morphology, this graphite has a rather large BET surface area of 4.96 m2 g−1, which is also indicative that many or most of the cavities are accessible to gas adsorption from the outside of the particle. We chose this graphite as a host for n-Si embedding because of this large accessible cavity volume.

Figure 1. SEM images of (a) pristine graphite particles, (b) a cross-section of pristine graphite particles, (c) as-received nano silicon, and (d) ball-milled silicon.
Download figure:
Standard image High-resolution imageFigure 1c shows an SEM image of the as received n-Si. It consists of small ∼300 nm Si particles that are aggregated together into up to 80 μm secondary particles. The surface area of the n-Si particles is 28 m2 g−1. If this material was used directly for mechanofusion with graphite, the secondary particles densified and aggregated further, resulting in a mixture of graphite and dense n-Si secondary particles that are up to 50 μm in size, as shown in Fig. S1. We have found that avoiding the aggregation of n-Si into large dense particles during mechanofusion with graphite represents one of the biggest challenges for embedding n-Si into graphite particles.
Ball milling the n-Si with stearic acid as a dispersant, resulted in most of the secondary particles being broken up into individual nanoparticles and secondary particles consisting of loosely aggregated nanoparticles, as shown in Fig. 1d. The ball milling process also increased the surface area from 28 m2 g−1 for unprocessed n-Si to 39 m2 g−1 for dispersed n-Si. As will be shown below, the dispersed n-Si can be successfully dispersed and embedded into graphite by mechanofusion without aggregating. Not using stearic acid as a dispersant resulted in n-Si aggregation. Therefore, the presence of stearic acid helps to avoid the aggregation of n-Si during mechanofusion.
Figure 2 shows how the dispersed n-Si/graphite mixture evolved during mechanofusion with processing time. After the first hour of processing (Fig. 2a), the n-Si and graphite particles became well mixed, with the n-Si particles being relatively uniformly absorbed on the graphite surface. The shape of the graphite did not change. After 2 hours of processing (Fig. 2b), the number of n-Si particles visible in the SEM images markedly decreased and the graphite surface started to be rounded. After 3 hours (Fig. 2c), the graphite particle surface became smooth. Few n-Si particles can be observed on the graphite surface. Instead, some of the n-Si particles reside just under the graphite surface and are visible in these images as bright spots. With a further 2 hours of processing (Fig. 2d), there was no further morphology change observed.

Figure 2. SEM image of n-Si and graphite after (a) 1 hour, (b) 2 hours, (c) 3 hours and (d) 5 hours of mechanofusion processing.
Download figure:
Standard image High-resolution imageFigures 3a–3c shows cross-section images of the final Si@Gr product. The cavities inside the graphite particles are filled with n-Si particles. However, some of the cavities remain empty. From looking at many particle cross-sections, it was observed that the filled cavities were often linked to a crack or fissure in the particle surface, while the empty cavities were never observed to have this property. From these observations, we suspect that all the empty cavities are not connected to the surface of the particles (inaccessible cavities), while all the filled cavities are in fact connected to a fissure on the particle surface (accessible cavities). It is not always apparent that accessible cavities are indeed accessible from SEM images since paths from the surface to the accessible cavities would not always be exposed by 2-dimensional cross-sections. As will be shown below, the results of carbon coating experiments confirm this model: all the n-Si filled cavities are accessible from the outside, while all of the empty cavities are inaccessible from the outside.

Figure 3. Cross-section SEM image of Si@Graphite.
Download figure:
Standard image High-resolution imageThat only accessible cavities are filled provides an explanation for the embedding process. During mechanofusion the n-Si particles seem to behave essentially like a fluid and fill any empty cavities they have access to from the surface, without disturbing the graphite host. Therefore, ideal graphite particles for the synthesis of Si@Gr would be ones that have a large fraction of empty cavities and where a large fraction of these is connected to the surface by some channel or fissure. We have found that spherical natural graphite is excellent for this purpose since they have these qualities. Alternately, ideal guest particles need to be small enough to fit in the channels connecting the accessible cavities to the particle surface. From earlier experiments, we have found that guest particles need to be less than 1 μm in size to be able to be embedded in this type of graphite by mechanofusion, while guest particles larger than this remain on the graphite surface. 27 From these considerations, we believe that the ∼300 nm size n-Si guest particles coupled with the high void fraction spherical natural graphite used here represent an ideal combination for creating Si@Gr particles by mechanofusion.
As further confirmation that the MF processing did not affect the host graphite, XRD patterns of the dispersed n-Si, graphite, and Si@Gr product particles are shown in Fig. S2. Si@Gr has the combined peaks of graphite and n-Si, while the crystalline structure of graphite after mechanofusion remained unchanged. The surface area of Si@Gr was also measured to be 7.51 m2 g−1, which is close to the predicted value of 6.66 m2 g−1 according to a physical mixture of n-Si and graphite in a 5:95 weight ratio.
After mechanofusion processing some of the Si@Gr particles were carbon coated by CVD. This was done to close off the paths from the particle surface leading to accessible cavities, to inhibit electrolyte from penetrating into these cavities and reacting with the n-Si during Li-ion cell operation. Figure 4a shows an SE SEM image of a Si@Gr particle after CVD carbon coating (CVD-Si@Gr). In comparison to Si@Gr, shown in Fig. 2c, the CVD-Si@Gr surface is smoother and fewer residual n-Si particles are visible on the particle surface. Some carbon fibers can also be seen on the surface of the particle that have grown on the surface during the CVD process. It is well known that transition metals catalyze carbon fiber growth under CVD conditions. The fibers observed here likely have grown from iron impurities that either originate from the ball milling process used to disperse the n-Si or the mechanofusion process itself. Figure 4b shows a BSE SEM image of the same particle. Using backscattered electrons, the subsurface n-Si particles can still be imaged, indicating that the carbon coating must be very thin. Despite the thin coating, the surface area of the CVD-Si@Gr particles has become greatly reduced (1.67 m2 g−1) compared to the surface area of Si@Gr (7.51 m2 g−1).
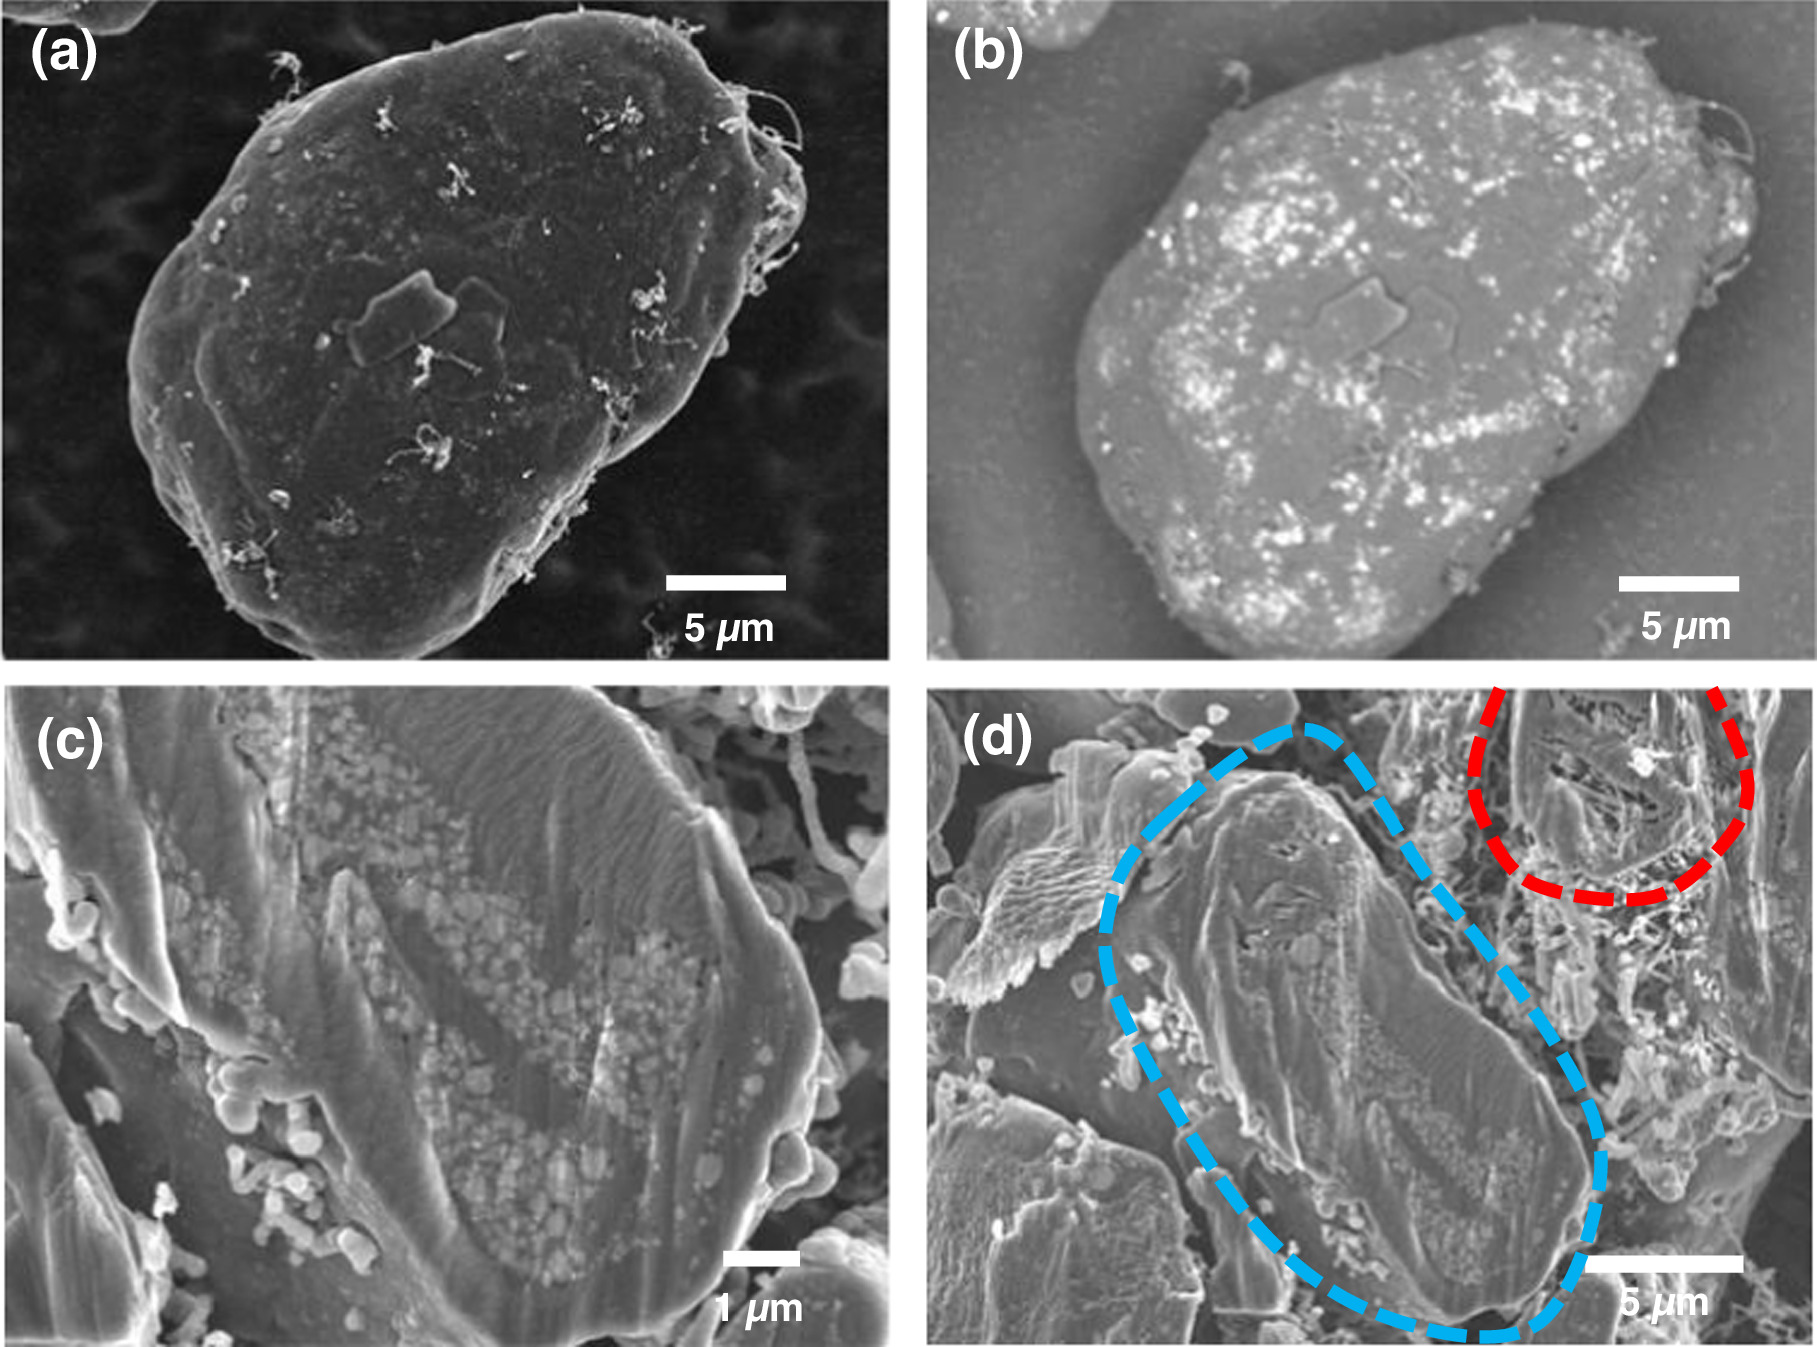
Figure 4. SEM images of CVD-Si@Gr composite particles: (a) and (b) show SE and BSE images of the same particle, (c) shows an SEM image of a cross-sectioned particle, and (d) shows cross-sectioned particles with accessible cavities (blue) and inaccessible cavities (red).
Download figure:
Standard image High-resolution imageFigure 4c shows an SEM image of a cross-sectioned CVD-Si@Gr particle, which shows that the n-Si particles embedded within the graphite cavities were carbon coated by the CVD process. This shows that the ethylene gas can penetrate into accessible cavities, resulting in carbon deposition within these cavities during CVD processing. In comparison to the carbon coating on the graphite, which is too thin to be visible in the cross-section image, the carbon coating on the n-Si particles is much thicker, being about 200 nm − 400 nm in thickness. Apparently, the n-Si surface must catalyze the decomposition of ethylene more efficiently than the surface of graphite. As a result of the thick carbon coating on the n-Si surfaces, most of the accessible cavities within the graphite particles containing embedded n-Si are essentially completely filled with n-Si and carbon. This large amount of carbon is apparent as low angle intensity in the XRD pattern of CVD-Si@Gr shown in Fig. S2.
The ability of the CVD process to fully coat the n-Si and essentially fill the accessible cavities explains the low surface area of the CVD-Si@Gr samples. In contrast to the accessible cavities, the inaccessible cavities remain unchanged after the CVD process, as shown in Fig. 4d, which shows an SEM image cross sectioned CVD-Si@Gr particle that contains accessible cavities and a CVD-Si@Gr particle containing inaccessible cavities. The particle with accessible cavities is filled with n-Si, which are coated with carbon. The particle with inaccessible cavities is empty. Either the ethylene cannot access the inaccessible cavities or a carbon layer is also deposited in these cavities, but is too thin to detect.
TGA measurements were made to determine how much carbon was deposited during the CVD coating process. The results of TGA measurements of the Si@Gr and CVD-Si@Gr samples are shown in Figs. S3a and S3b, respectively. The Si@Gr sample lost 89.34% of its mass after heating in air to 800 °C and then its mass became stable. This almost exactly corresponds to the expected net weight loss according to the full oxidation of Si@Gr into CO2(g) and SiO2(s). Assuming this full oxidation reaction, then according to the TGA results, the Si@Gr sample contained 4.97 wt% Si, corresponding to the sample's designed 5 wt% Si content. In contrast, the CVD-Si@Gr sample lost 93.02% of its mass during heating to 800 °C and then its mass became stable. Assuming full oxidation of the sample to CO2(g) and SiO2(s), this corresponds to the sample containing only 3.26 wt% Si. Given that the CVD-Si@Gr sample was 95% graphite and 5% Si prior to carbon coating, this means that amorphous carbon created during CVD accounts for 34.81 wt% of the CVD-Si@Gr sample. This large amount of deposited carbon is consistent with the large amount of carbon observed to fill the accessible cavities in the graphite particles after CVD processing.
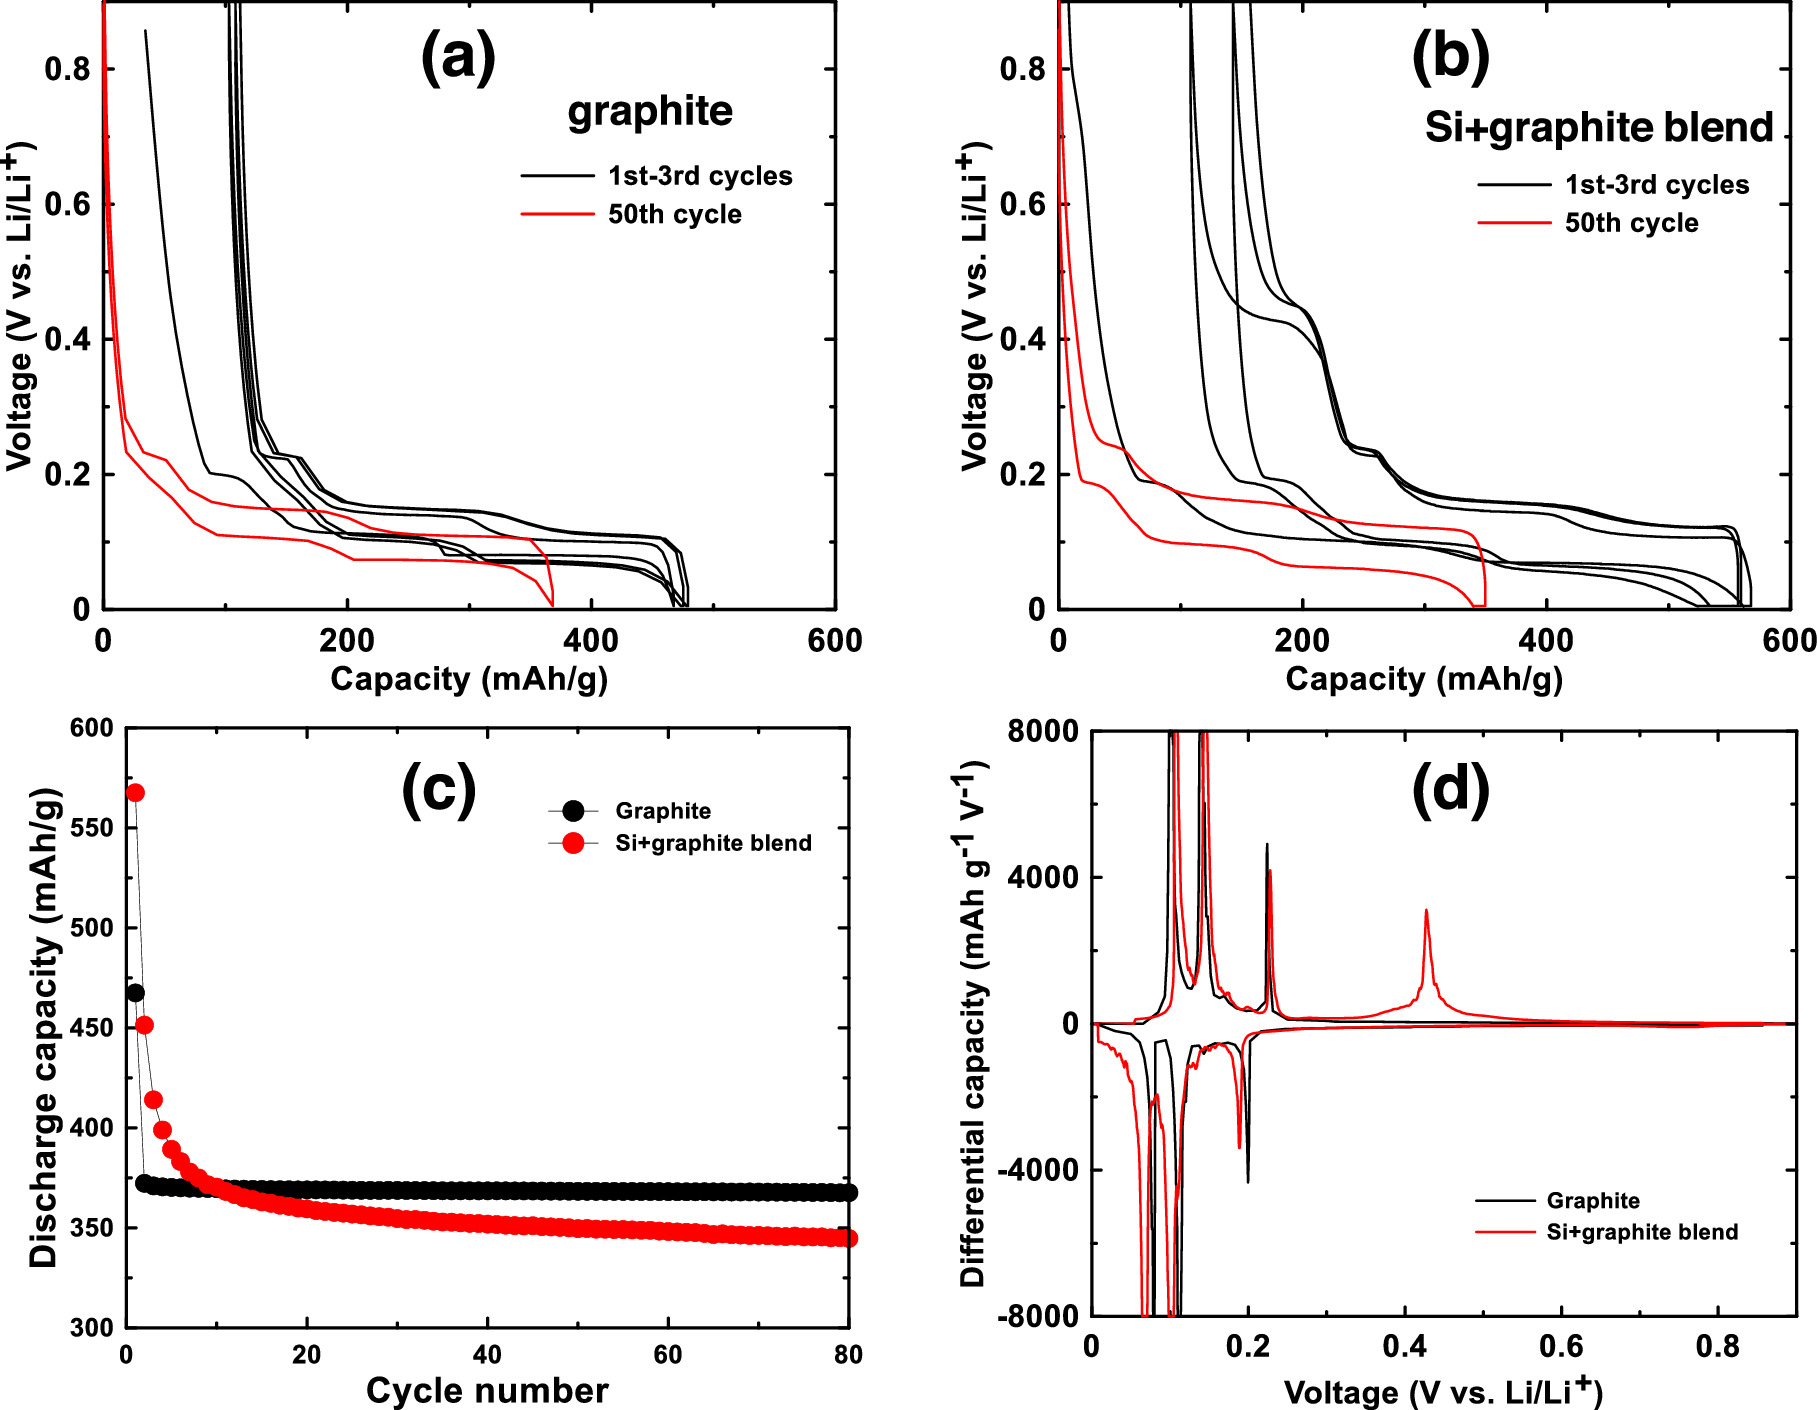
Figure 5a shows the voltage curve of the porous host graphite for the first 3 cycles and for the 50th cycle. Differential capacity curves of this cell for the 1st, 10th and 50th cycles are shown in Fig. S4a. It has a relatively high irreversible capacity of 100 mAh g−1 due to its high surface area, but it has a high reversible capacity (367 mAh g−1) and staging plateaus characteristic of a high degree of graphitization. Figure 5b shows the voltage curve of an electrode made with a 5/95 w/w blend of Si and graphite for the first 3 cycles and for the 50th cycle. Differential capacity curves of this cell for the 1st, 10th and 50th cycles are shown in Fig. S4b. During the first cycle, capacity due to the added Si can clearly be seen during delithiation as a plateau at about 0.45 V due to the delithiation of the Li15Si4 phase. This corresponds to a sharp peak at 0.43 V in the Si-graphite blended electrode differential capacity curve. All of the other peaks in the differential capacity curve correspond to those of graphite. Because of the added Si, the active material capacity increased to about 450 mAh g−1 compared to pure graphite. However, the addition of Si has also noticeably increased the electrode polarization, with a larger difference in potentials between the graphite staging plateaus during lithiation and delithiation. Such high polarization would decrease the energy efficiency of a Li-ion cell. Furthermore the 0.45 V Li15Si4 delithiation plateau quickly diminishes during cycling and by cycle 10 it is nearly gone. This suggests that the active silicon in this electrode is rapidly fading. This is expected behavior for silicon in an electrode with PVDF binder and cycling with no electrolyte additives.

Figure 5. Voltage profiles of the first three cycles and of the 50th cycle of (a) a graphite electrode and (b) a Si-graphite blend electrode. (c) Discharge capacity and (d) differential capacity of a graphite electrode and a Si-graphite blend electrode.
Download figure:
Standard image High-resolution imageFigure 5c shows a plot of the capacity vs. cycle number of the graphite electrode and the electrode made with a silicon-graphite blend. The graphite electrode has no capacity fade over the 80 cycles shown, while the silicon-graphite blend initially fades rapidly, and then exhibits roughly linear fade after cycle 20. To estimate how much of this capacity is attributable to silicon and to graphite, it is noted that approximately 95% of the delithiation capacity of Li15Si4 occurs between 0.3 V and 0.9 V, while about 95% of the delithiation capacity of graphite occurs between 0.005 V and 0.3 V. This can be seen readily in the differential capacity curves of the Si blended electrode compared to the Si-graphite blended electrode shown in Fig. 5d. Above 0.3 V the graphite electrode has very little delithiation capacity, while the Si-graphite blended electrode has substantial capacity in this region. From this property, the capacity contribution of graphite (CGr) and silicon (CSi) can be estimated from the delithiation capacity according to:


Where C(0.005–0.3V) is the delithiation capacity (in mAh per g of active mass) between 0.005 V and 0.3 V and C(0.3–0.9V) is the delithiation capacity (in mAh per g of active mass) between 0.3 V and 0.9 V. From the simultaneous solution of Eqs. 1 and 2 the capacities of graphite and Si are:


Figures 6a and 6b shows a plot of the Si and graphite contribution to the delithiation capacity, respectively, of the Si-graphite blended electrode calculated according to Eqs. 1 and 2 for the first 50 cycles. Figure 6a shows the Si contribution to the Si-graphite blended electrode, which fades rapidly, consistent with the vanishing Li15Si4 delithiation peak in the differential capacity curves during cycling. The graphite contribution to the Si-graphite blended electrode capacity calculated according to Eq. 3 is shown in Fig. 6b. Initially, the graphite contribution capacity is 370 mAh g−1, which is similar to the capacity of the pure graphite electrode, but after the first cycle the capacity drops to about 365 mAh g−1. This is likely due to increased impedance, as observed in the shifting of the graphite peaks in differential capacity curves, caused by the presence of Si and its associated SEI. The graphite capacity contribution then stays constant until about cycle 40, but then starts to decrease as cell polarization increases.
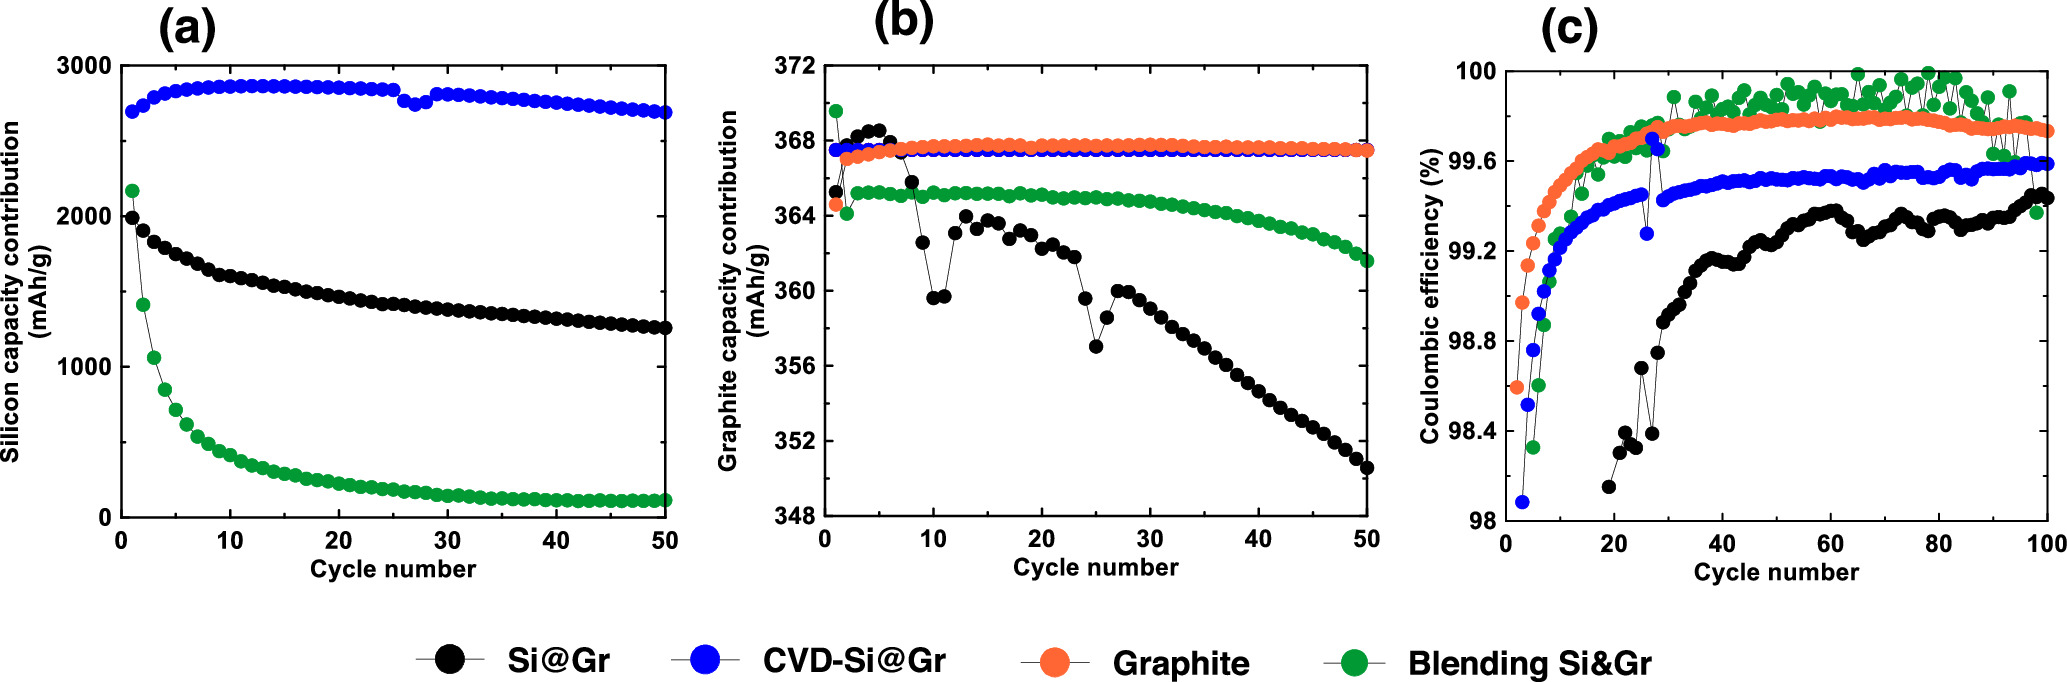
Figure 6 (a) Si contribution and (b) graphite contribution to the active material capacity vs. cycle number. (c) Coulombic efficiency of electrodes in this study as a function of cycle number.
Download figure:
Standard image High-resolution imageFigure 6c shows the coulombic efficiency (CE) of the graphite and Si-graphite blended electrodes. Initially the Si-graphite blended electrode has poor CE due to the reactivity of Si with electrolyte. After the Si capacity has faded and most of the active capacity is due to the graphite component only, the CE of the Si-graphite blended electrode becomes similar to the pure graphite electrode. From these results it can be concluded that in the Si-graphite blended electrode, the Si component of the electrode fades rapidly, while the graphite component does not exhibit significant fade. In addition, greater voltage polarization in the blended electrode was observed compared to that of pure graphite due to the presence of Si.
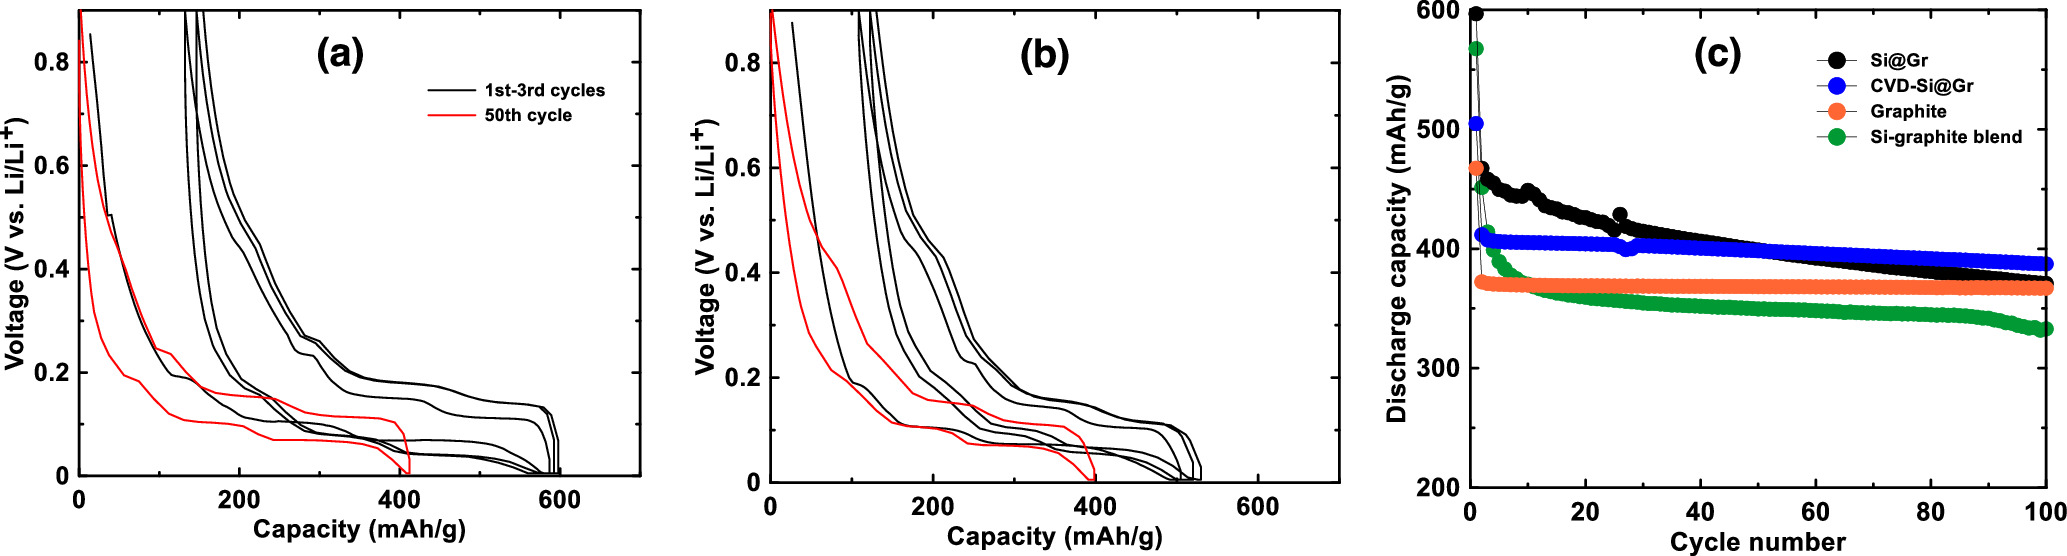
Figures 7a and 7b show the voltage curves of Si@Gr and CVD-Si@Gr respectively. The discharge capacity and CE of these electrodes are shown in Figs. 7c and 6c. Differential capacity plots of these electrodes are shown in Figs. S4c and S4d. For the Si@Gr electrode, the Si and graphite capacity contributions as a function of cycle number were calculated in the same way as the Si-graphite blended electrode and the results are shown in Figs. 6a and 6b. This calculation is an approximation, since the Li15Si4 peak is highly suppressed in this electrode, which can occur due to cell polarization. As with the Si-graphite blended electrode, Si@Gr has a high voltage polarization compared to pure graphite, which can be seen as shifts in the potential of the graphite peaks in the differential capacity curves of this cell. It also has a high initial capacity and initial rapid fade. However, the capacity retention of Si@Gr is improved compared to the simple Si-graphite blend. This suggests that the Si@Gr structure can mitigate the degradation of silicon to some extent. As shown in Fig. 7a, Si@Gr has a greatly improved Si contribution to the capacity compared to the Si-graphite blend electrode. However, the Si capacity contribution is still only about 2000 mAh g−1, which is much less than the 3578 mAh g−1 theoretical capacity for Si. This indicates that not all of the Si is active in this electrode. In addition, both the Si and graphite capacity contributions exhibit fade.

Figure 7. Voltage profiles of (a) Si@Gr and (b) CVD-Si@Gr (black line: 1–3 cycles; red line: 50th cycle). (c) Discharge capacity of graphite, a Si-graphite blend, and silicon graphite composites.
Download figure:
Standard image High-resolution imageThe reason for the above behavior can be seen in Figs. 8a and 8b, which shows SEM images and C, Si, P, and composite compositional maps of a cross section of a Si@Gr electrode after the first and thirty-second cycles, respectively. After the first cycle the Si particles appear nearly pristine. The phosphorous map shows almost no contrast, indicating an absence of electrolyte decomposition products that include P (from LiPF6). After the 32nd cycle, shown in Fig. 8b, two types of Si particles can be observed, corresponding to active and inactive Si. Circled in blue are Si particles that have nearly disintegrated. This morphology is characteristic of cycled active Si, as a consequence of nanoporosification from repeated volume expansion/contraction cycles. 3,4 Circled in red are Si particles that appear pristine. This Si has not experienced any volume expansion and is therefore inactive. The presence of this inactive Si is consistent with the less than expected Si component capacity of the Si@Gr electrode shown in Fig. 6a. In the P-compositional map of this electrode after 32 cycles, shown in Fig. 8b, there is distinctly higher P-concentration in the Si-containing regions, indicating the presence of electrolyte decomposition products, which is consistent with the low CE exhibited by this electrode during cycling.
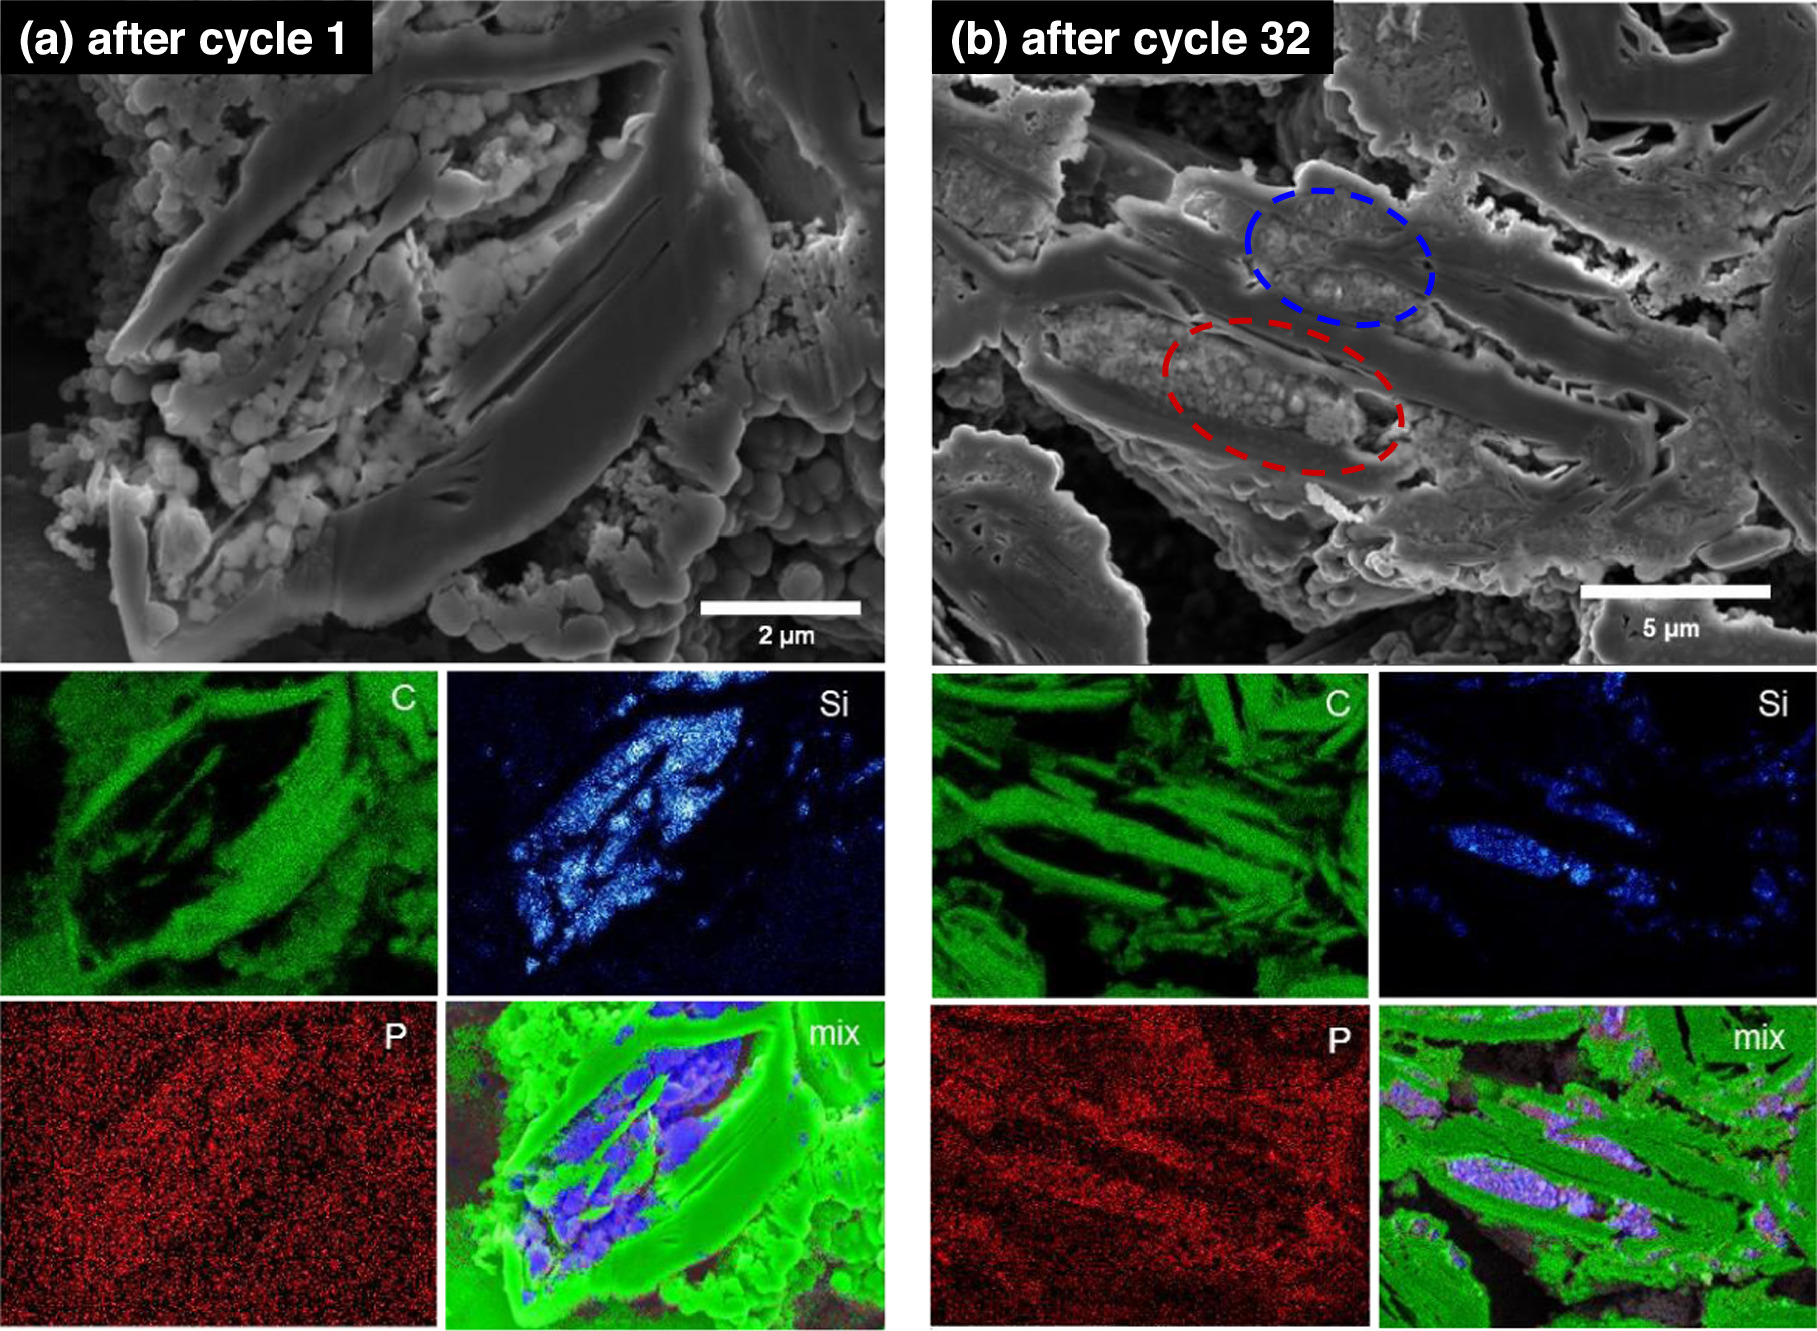
Figure 8. SEM images and EDS C, Si, P, and composite compositional maps of Si@Gr electrodes after (a) one cycle and (b) 32 cycles.
Download figure:
Standard image High-resolution imageFigures 7b and 7c show the voltage curve and discharge capacity vs. cycle number of the CVD-Si@Gr electrode. Differential capacity curves of this cell are shown in Fig. S4d. Initially, this electrode has a lower discharge capacity than the Si@Gr electrode. However, the CVD-Si@Gr electrode exhibits much less capacity fade and maintains about 390 mAh g−1 capacity over 100 cycles. To calculate the Si and graphite contributions to the capacity, Eqs. 1 and 2 could not be used, since the result of this calculation showed that Si had substantial capacity below 0.3 V during delithiation. As shown in the differential capacity curve, the Li15Si4 peak is highly suppressed during cycling. This may be due to cell polarization or because the Si is bound to a substrate (here the substrate being the CVD deposited carbon). 1 Instead, the Si contribution to the capacity was calculated by subtracting from the total capacity, the capacity of graphite (367.5 mAh/g for the graphite used in this study) and amorphous carbon (225 mAh g−1). 23 In other words, it was assumed that all electrode components except for Si cycled at their full capacity. The result of this calculation is that Si capacity contribution of CVD-Si@Gr reaches about 3000 mAh g−1 and experiences 8% capacity fade over 50 cycles. This is close to the theoretical capacity of Si. Therefore, the assumption that the graphite and CVD deposited carbon are cycling at their full capacity must be a good one, since unless all components were cycling near their full capacities, the total capacity of the electrode could not be accounted for.
The high Si capacity indicates that most of the Si is active in this electrode during cycling. This is significantly improved performance compared to the Si component cycling in the mixed Si-Gr and Si@Gr electrodes. It is particularly impressive performance for Si in an electrode with no special binders and in a cell with no special electrolyte additives. Cell polarization of the CVD-Si@Gr cell is also low, with no difference in the potentials of the peaks due to graphite staging during cycling compared to pure graphite, as shown in Figs. S4a and S4d. This would result in high energy efficiency in a practical application. The CE of CVD-Si@Gr plotted vs. cycle number is shown in Fig. 6c and is improved (∼99.6%) compared to Si@Gr (∼99.4%), but it is lower than that of graphite (∼99.8%). This shows that the deposited carbon reduces side reactions of Si with electrolyte compared to Si@Gr, but the extent of electrochemical side reactions is still greater than that for pure graphite. Additionally, damage to the graphite by the mechanofusion process may have caused the CE to become reduced.
The above behavior can be understood from the cross-section image and corresponding C, Si, P, and composite compositional maps of the CVD-Si@Gr electrode after 1 cycle and after 32 cycles, shown in Figs. 9a and 9b, respectively. After the first cycle, void spaces are present around the many of the embedded silicon particles, presumably as a result of their volume expansion and contraction. Otherwise, the Si particles appear to be almost pristine. As with the Si@Gr electrode, the P-compositional map shows almost no contrast, indicating an absence of P-containing electrolyte decomposition products. After 32 cycles, (Fig. 9b) almost no distinct Si particles can be found. Instead, the carbon particles now contain regions of Si mixed with carbon. This is likely a result of repeated volume expansion and contraction of the Si, which results in the formation of a homogenous Si/C composite. Therefore, in this case nanoporosification has induced mixing of the Si with the CVD deposited carbon.

Figure 9. SEM images and EDS C, Si, P, and composite compositional maps of CVD-Si@Gr electrodes after (a) one cycle and (b) 32 cycles.
Download figure:
Standard image High-resolution imageThe observation that nearly all of the Si is in this form, is consistent with the near theoretical capacity of the Si component of this electrode. The phosphorous map now shows some distinct contrast with concentration of the phosphorous in the Si containing regions. This shows that although the CVD-Si@Gr electrode's reaction with the electrolyte may be slower than for the Si@Gr electrode, as indicated by CVD-Si@Gr's higher CE, electrolyte is still accessing the inside of the composite, resulting in a lower CE than graphite. A clue to how the electrolyte infiltrates the Si@Gr electrode may be seen in the SEM images shown in Figs. 9a and 9b. After one cycle internal porosity around some of the Si particles may be seen in Fig. 9a. This porosity would form by the Si first expanding its surrounding carbon matrix during lithiation, then when the lithiated Si contracts during delithiation, the surrounding carbon matrix does not contract, leaving voids. The formation of voids increases during cycling and by cycle 32, as shown in Fig. 9b, many internal voids can be seen. These voids likely provide a pathway for electrolyte infiltration into the composite material during cycling.
Figure 10 shows the capacity of the electrodes prepared in this study during cycling at different rates. The capacity of all electrodes is relatively unaffected by the increasing rate until the rate reaches 1 C. At a 1 C rate the CVD-Si@Gr electrode maintains the highest capacity of about 345 mAh g−1. This may be due to the carbon-coating layer imparting electronic conductivity and also reducing the size of the SEI layer. The Si-graphite blend has the poorest rate performance at 1 C, due to the high impedance observed in this electrode from excessive SEI formation. At 2 C graphite has the capacity (∼100 mAh g−1) of all the electrodes, with the Si-containing electrodes having very low capacities (∼50 mAh/g). This may be due to an increased SEI layer thickness, as in the case of the Si-graphite blend electrode, or, in the case of CVD-Si@Gr, issues in transport of lithium from the Si to the graphite in void spaces that contain no electrolyte.

Figure 10. Rate tests of Si@Gr, CVD-Si@Gr, graphite, and Si graphite blend electrodes.
Download figure:
Standard image High-resolution image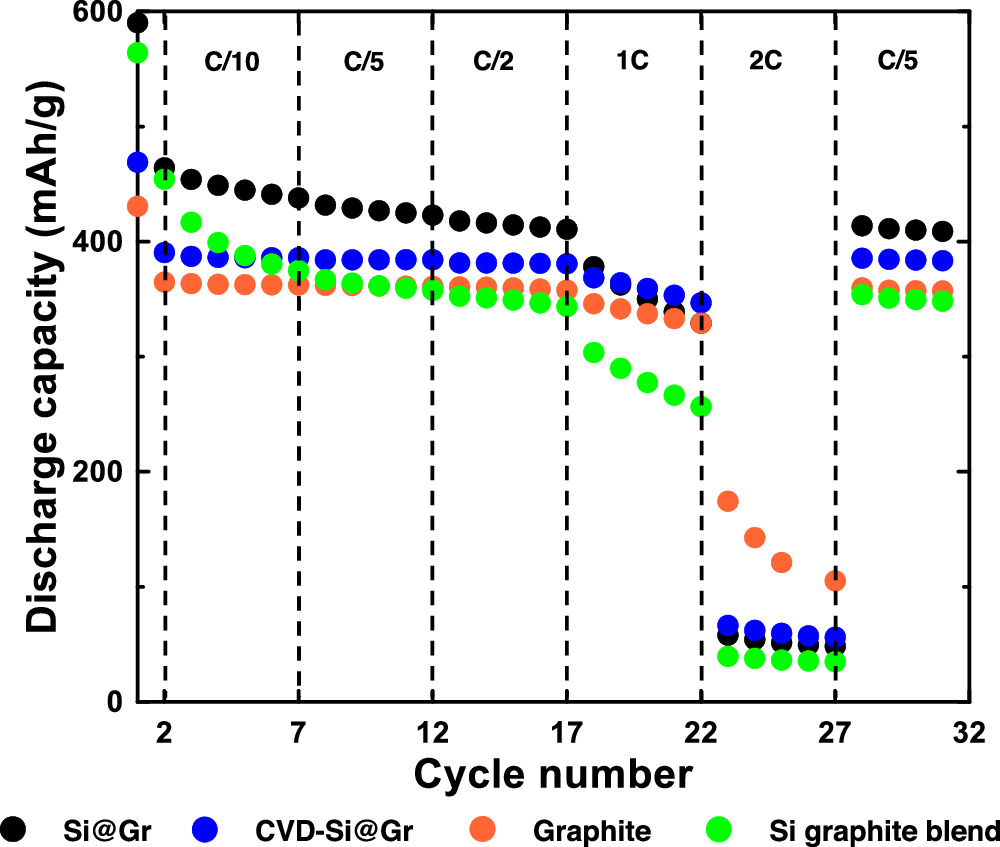
Table I compares the obtained electrochemical performance of CVD-Si@Gr to C/Si composites from previous studies. Overall, the ∼400 mAh g−1 capacity of CVD-Si@Gr represents only a modest increase compared to graphite. Higher capacities have been obtained in previous studies. Comparison with previous studies is also difficult, since previous studies either used a functional binder or FEC in the electrolyte. Here, excellent cycling retention was achieved without using either. It also represents a new approach, where highly crystalline graphite is responsible for the bulk of the capacity and only a small amount of Si is added for capacity enhancement. In future studies it would be desirable to increase the capacity of the CVD-Si@Gr composite. Its low capacity is primarily due to the large amount of vapor deposited carbon (34 wt%) within its structure. If the amount of deposited carbon could be reduced to something more reasonable like ∼5 wt%, then the capacity could be increased to ∼480 mAh g−1. This is clearly an avenue for future studies.
Table I. A summary of the characteristics of some Si-C composite anode materials.
| Material | ICE (%) | Reversible capacity (mAh/g) | Cycles | Retention (%) | Reference |
|---|---|---|---|---|---|
| CVD-Si@Gr | 77 | 407 | 100 | 94.8 | this work |
| Si@void@C | 75.8 | 627.5 | 100 | 69.3 | 14 |
| Si/C microspheres | 72 | 1192 | 200 | 62.5 | 13 |
| Si/C@C microspheres | 87.1 | 1269.6 | 820 | 87.1 | 11 |
| Si@C | 69 | 1019 | 100 | 67 | 10 |
| M-pSi@C | not reported | 1702 | 250 | 95 | 17 |
| LSP-Si@CNT | 84.4 | 1862 | 500 | 91.9 | 19 |
| Si@C-Ni | 71.1 | 1140 | 500 | 71 | 20 |
| PCF/Si | 67.2 | 1006 | 400 | 88.6 | 21 |
| H-SiNS/C | 55 | 1670 | 500 | 99.8 | 22 |
Despite its lower capacity than other examples of Si-C composites, the simple and sustainable synthesis method used to make CVD-Si@Gr makes it highly attractive for implementation in commercial cells. Table S1 lists the reagents and process steps used to synthesize the composites listed in Table I, so that their synthesis methods may be compared. The reference composites listed in Table I all require the use of solvents. In fact, more solvent is used during the synthesis of the reference composites than the amount of composite materials produced. This would increase cost and environmental impact. Furthermore, some of the reference Si-C composite materials require many processing steps in their synthesis, with some examples requiring up to 32 processing steps and with some including up to 15 reagents (some being toxic); also increasing cost.
In contrast to other studies, the CVD-Si@Gr described in this study only required 5 process steps to make. However, Steps 2–4 listed in Table S1 were implemented as a powder recovery method only because a laboratory SPEX mill was used to disperse the n-Si powder. On a large scale, a rotary ball mill would likely be used for this process. Such mills are designed to be discharged by opening a side port equipped with a screen (to retain the balls within the mill) while the mill is rotating. Therefore, it may be envisioned that on a large scale the method described here would be an all-dry process requiring only 3 processing steps:
- 1.disperse n-Si by ball milling with stearic acid
- 2.mechanofusion n-Si and graphite
- 3.CVD
Such an all-dry process would be highly attractive for practical implementation, since the mechanofusion process (Step 2) is already used for natural graphite spheronization, 28 and the CVD process is already used as a carbon coating method for lithium battery graphites. 29 Therefore only one additional processing step (Step 1) is required over existing natural graphite manufacturing processes. Furthermore, the ball milling process used in Step 1 is commonly used for particle size reduction in natural graphite beneficiation. 30,31 As such, a graphite materials manufacturer may be able to implement the production of CVD-Si@Gr using already existing equipment and processes. By using an approach that utilizes processes that are already used in materials manufacturing, using only a few low-cost and sustainable reagents, using few processing steps, and utilizing all-dry green chemistry; CVD-Si@Gr may be a drop-in solution both for materials manufacturers and for battery makers. We believe such an approach is an important area for research that can immediately impact commercial Li-ion batteries.
Conclusion
Mechanofusion was used to embed n-Si particles into void spaces within natural graphite. It was found that during mechanofusion the n-Si particles behaved like a fluid and penetrated only into void spaces or cavities that were accessible from cracks or fissures in the graphite particle surface. The resulting Si@Gr composites were formulated in electrodes with PVDF binder and cycled vs lithium in cells with no special electrolyte additives. The Si@Gr composite had improved cycling compared to a Si-graphite mixture, but still suffered from severe capacity fade. This was due to electrolyte penetration into the Si-containing voids within the graphite, resulting in severe capacity fade of the Si phase and SEI growth that caused impedance and capacity fade also of the graphite phase. To improve cycling performance, carbon was chemical vapor deposited onto Si@Gr particles. The resulting CVD-Si@Gr sample achieved good cycling performance with conventional PVDF binder and FEC-free electrolyte. After 50 cycles, most silicon was still active with ∼2750 mAh g−1 capacity from the Si phase and a 396.4 mAh g−1 capacity overall.
This study sheds light on a promising approach to a scalable method to synthesize silicon/graphite composites as drop-in substitutes for graphite that require no special binders or electrolyte additives to cycle in lithium-ion batteries. Future work will focus on increasing the capacity further, especially by reducing the amount of deposited carbon. Utilizing carbon hosts with a large fraction of accessible cavities and a small fraction of inaccessible cavities would also aid in improving capacity.
Acknowledgments
The authors acknowledge funding from NSERC and NOVONIX Battery Technology Solutions under the auspices of the NSERC Alliance grants program [grant number ALLRP 558364 − 20].
Supplementary data (0.8 MB PDF)