
Abstract
In the "Li0-free" architecture, cells are manufactured with a bare anode current collector and the Li metal anode is plated in situ during the first charging step. While this architecture has many attractive qualities from manufacturing and energy density perspectives, stable Li plating in solid-state "Li0-free" cells can be challenging. It is generally accepted that the Li overpotential affects Li homogeneity in "Li0-free" cells. We demonstrate that the nucleation overpotential for Li plating in solid-state "Li0-free" cells using commercial current collectors can be eliminated by introducing metal clusters that guide Li nucleation. Au is used as model alloying metal cluster. Here, we demonstrate stable Li plating with thickness 16.5 μm (3.3 mAh cm−2) in oxide solid-state electrolyte "Li0-free" cells enabled by Au metal clusters. It is shown that 97% of the in situ plated Li can be reversibly stripped at 60 °C and 2.5 MPa. Conversely, Au interlayers which are flat and continuous instead of clustered in morphology consistently showed short-circuiting during in situ Li plating, limiting Li electrodeposition to <0.1 mAh cm−2. These results can help guide future studies of Li nucleation and growth at solid/solid interfaces, as well as offer alternative manufacturing pathways for "Li0-free" solid-state batteries.
Export citation and abstract BibTeX RIS
Solid-state batteries (SSBs) have potential to offer higher energy densities than current state-of-the-art Li-ion batteries, while also alleviating safety concerns. 1–3 For these energy density increases to be realized, a thin (<25 μm) Li metal anode is required. 4 Manufacturing of SSBs with thin Li metal anodes is complicated by the high reactivity of Li, which forms a thin passivation layer even in controlled environments. 5 The passivation layer on Li also hinders the formation of a low-resistance interface between Li and the solid-state electrolyte (SSE), which has been shown to impact cell cycling performance. 6–8 However, state-of-the-art cathodes like LiNi1-y-zMnyCozO2 are produced in the fully lithiated state, so any Li metal in the as-manufactured SSB will diminish the energy density. 9 Therefore, it is highly desirable to manufacture "Li0-free" ("anode-free") SSBs to avoid handling of highly reactive Li during manufacturing as well as remove excess Li in the cell. In "Li0-free" cells, the anode current collector (CC) is bare when the cell is assembled. Then, Li is plated in situ at the CC/SSE interface during the first charging step using stored Li from the cathode active material. 10,11 The "Li0-free" cell architecture could increase energy density above that of conventional SSBs by eliminating excess Li as well as decrease cell costs by simplifying the manufacturing process. 11–13
Wang et al. first demonstrated uniform in situ Li deposition and cycling in the solid-state system using a bare Cu CC, showing a high Coulombic efficiency of 99%. 14 However, in situ plating of the Li anode comes with a myriad of challenges. 15,16 One is the necessity to achieve intimate contact at the CC/SSE interface before in situ plating. Without conformal CC/SSE contact during plating, hot spots with amplified local current density may form, leading to short-circuiting of the cell. Thus far, all demonstrated "Li0-free" cells rely on high pressure or temperature CC/SSE interface formation steps. "Li0-free" cells with the relatively soft SSE Li6PS5Cl utilize high-pressure pre-forming steps (225–520 MPa) and/or high-pressure cycling to maintain CC/SSE contact. 17–19 However, the garnet Li7La3Zr2O12 (LLZO) SSE cannot be deformed easily at room temperature, so LLZO "Li0-free" cells require high-temperature (900 °C) CC/SSE lamination. 14,15,20 High pressure or temperature CC/SSE interface formation steps increase the complexity of "Li0-free" cell manufacturing and may chemically bond the CC to the SSE, which could affect the Li nucleation overpotential and therefore the homogeneity of plated Li.
Lowering the Li nucleation overpotential has been identified as an important endeavor to enable uniform Li plating in "Li0-free" cells. 21 The work of Lee et al. on "Li0-free" SSBs hypothesized that decreasing the nucleation overpotential of Li both enables stable Li plating and improves the uniformity of Li deposition. 17 In that study, a 10 μm Ag-C layer was interposed between the sulfide SSE and CC before performing warm isostatic pressing at 490 MPa to improve interfacial contact. Although it was theorized that the solubility of Ag with Li reduced the nucleation overpotential, the exact change in overpotential was not quantified by analyzing the voltage profile during Li electrodeposition. The Li nucleation overpotential is observed in the voltage profile when the voltage first goes below 0 V, then through a minima before reaching a higher steady-state value. 22,23 This phenomenon has been well-studied in liquid electrolyte systems with varying interlayers imposed on CCs by Yan et al. 24 Common CC materials like Cu and Ni, which are insoluble with Li, show a distinct nucleation overpotential similar to what is observed in solid-state "Li0-free" cells with Cu or Ni CCs. Interlayers which can alloy with Li, including Ag and Au, were shown to have no nucleation overpotential for Li plating in liquid electrolyte cells. Yan et al. also showed that Au could be patterned on the CC to control the nucleation of Li and act as a seed for Li growth. While the effect of alloying interlayers on Li nucleation has been well-studied in conventional liquid-electrolyte systems, less is understood about the role of alloying interlayers in solid-state "Li0-free" cells. Both Kim et al. and Krauskopf et al. investigated the role of alloy interlayers in the solid-state system using Au coated LLZO. 22,25 These studies concur that Au interlayers are effective in reducing the nucleation overpotential for Li plating but did not address other factors that may contribute to the nucleation overpotential in solid-state systems. Another study using sulfide electrolyte "Li0-free" cells showed that a Te coating on the Cu CC could lower, but not eliminate, the nucleation overpotential. 19 Importantly, mechanical contributions from the de-bonding of the CC/SSE interface are also expected to contribute to the nucleation overpotential in solid-state "Li0-free" cells. 14,15 Therefore, it is desirable to eliminate the high pressure/temperature CC/SSE formation steps both from a manufacturing perspective and to further reduce the Li nucleation overpotential.
Here, we aimed to eliminate the nucleation overpotential in solid-state "Li0-free" cells by a two-prong approach: integrating metal clusters that promote Li nucleation at the LLZO surface combined with eliminating the high-temperature CC/SSE lamination step to remove the contribution of mechanical de-bonding to the nucleation overpotential. Crucially, we postulate that the metal clusters serve two purposes as both a means to promote Li nucleation similar to what was shown by Yan et al. in liquid electrolytes, and as points of electrical contact to evenly distribute the current across the CC/SSE interface. Owing to the ease of integration using a common sputtering technique, Au is used as a model cluster. In this work, we demonstrate stable Li metal plating of 3.3 mAh cm−2 in Cu/LLZO "Li0-free" cells with no CC/SSE lamination by imposing a clustered Au metal interlayer on the LLZO surface. By heating Au-coated LLZO, de-wetting of the Au occurs to form discrete Au clusters on the LLZO surface. We hypothesize that these Au agglomerates play an important role in providing uniformly distributed nucleation sites to enable homogeneous Li metal plating. It is shown that the Li nucleation overpotential can be eliminated in a solid-state "Li0-free" cell and that the voltage response during plating for this solid-state "Li0-free" cell closely matches that of Li plating in a liquid electrolyte system. First, the morphology of the Au-coated LLZO is characterized using scanning electron microscopy (SEM) and atomic force microscopy (AFM). The in situ formed Li anode morphology is examined during both plating and stripping using focused-ion beam (FIB) milling combined with SEM and electrochemical impedance spectroscopy (EIS). The alloying/de-alloying of the metal interlayer is shown to be repeatable and reversible through multiple cycles of plating and stripping the in situ formed Li metal anode. These results illustrate the importance of controlled nucleation during in situ Li plating, as well as demonstrate the feasibility of stable Li plating in "Li0-free" cells without the requirement of CC/SSE lamination.
Experimental
Materials
LLZO billets (d = 12.7 mm) with composition Li6.5La3Ta0.5Zr1.5O12 were densified using rapid-induction hot-pressing, as previously described. 26 Each billet was cut into pellets ∼2 mm thick using a diamond saw. X-ray diffraction (Rigaku Corp.) was used to confirm the phase purity of the LLZO pellets after hot-pressing. The pellets were ground with sandpaper up to 1,200 grit, followed by a sequence of polishing steps using diamond paste up to a final roughness of 0.1 μm. For Au-Clusters samples (cells with a clustered Au interlayer morphology as characterized in Characterization of Au interlayer section), one side of the polished pellet was Au coated at this point using a desktop sputtering system (Denton Desk V) with power of 20 mA for a time of 5 min The estimated thickness of the Au layer is ∼160 nm based on AFM measurements of an Au-coated glass slide using identical deposition parameters (Fig. S1). Next, the pellets were heat treated to 400 °C in an argon-filled glovebox (Vacuum Atmospheres Co.) with atmosphere < 1 ppm O2, which has been shown previously to remove contaminants from the LLZO surface. 27 The thick Li/LLZO interface was prepared by scraping the oxide layer on Li foil (Alfa Aesar) with thickness 750 μm before punching the Li into discs (d = 11 mm) and applying it to the un-coated LLZO surface. Discs (d = 12.7 mm) of 35 μm battery grade Ni foil (Targray) were pressed on the other surface of the Li foil, as well as placed onto the opposite surface of the LLZO pellet to protect the surface. These cells were conditioned at 170 °C for 8 h at ∼1 MPa inside the glovebox to minimize the thick Li/LLZO interfacial resistance. At this point, Au-Flat samples (cells with a flat interlayer morphology as characterized in Characterization of Au interlayer section) were removed from the glovebox in a sealed vial, and quickly transferred to the Au sputterer and Au coated using the same parameters as reported for Au-Clusters samples. It is estimated that the Au-Flat samples were exposed to air outside the glovebox for <30 seconds during transfer. To confirm that the brief exposure to air was not the reason for failure of Au-Flat cells, an Au-Clusters cell was exposed to air for the same amount of time before in situ Li plating. This cell exhibited stable Li deposition similar to Au-Clusters cells not exposed to air (Fig. S2). To investigate the effect of the Au-Clusters size on Li plating, the heat treatment temperature was increased to 600 °C. It was observed that the Au-Clusters increased in size but no significant differences in Li plating behavior were observed (Fig. S3). Therefore, a 400 °C heat treatment was utilized for all Au-Clusters samples henceforth. To complete the cell assembly, a battery-grade Cu foil (Targray) with thickness 10 μm (d = 12.7 mm) was placed on the Au coated LLZO surface before cell testing and the stack was subjected to 2.5 MPa pressure.
Electrochemical testing
Electrochemical testing was performed using a Bio-logic VMP-300 potentiostat/galvanostat. The cell stack described above was tested at a temperature of 60 °C under 2.5 MPa pressure using a load frame (Imada, Inc.) with custom pressure clamp. Li was plated from the thick Li counter electrode to the bare Cu foil electrode using a current density of 0.2 mA cm−2. During cycling experiments, Li was stripped from the in situ plated Li electrode using a current density of 0.2 mA cm−2. Potentiostatic electrochemical impedance spectroscopy (PEIS) was performed on the cells as-assembled (before in situ plating), after in situ plating, and between stripping and plating during cycling experiments. An AC perturbation voltage of 5 mV was applied over a frequency range of 7 MHz to 1 Hz.
Operando galvanostatic electrochemical impedance spectroscopy (GEIS) was conducted during stripping of in situ plated Li at 0.1 mA cm−2 and room temperature. These experiments were conducted at room temperature due to the loss of resolution in GEIS at elevated temperatures. An AC perturbation current of 0.015 mA cm−2 oscillating around the DC stripping current was applied over a frequency range of 7 MHz to 1 Hz.
Cross sectional and surface analysis
To examine the Cu/Li/LLZO interface, cross-sections were cut using focused ion beam (FIB) milling and imaged using a Thermo Fisher Helios G4 Plasma FIB UXe. FIB milling was conducted using an acceleration voltage of 30 kV, and an initial beam current of 0.5 μA followed by a cleaning beam current of 0.2 μA. The cross-sectional scanning electron microscope (SEM) images were obtained on the same system using an accelerating voltage of 3 kV and beam current of 0.2 nA. Energy-dispersive X-ray spectroscopy (EDS) was used to identify Au-rich phases in the in situ plated Li metal using the same system under an accelerating voltage of 8 kV and beam current of 1.2 nA. Surface SEM images were acquired using a TESCAN MIRA3 SEM using an accelerating voltage of 5 kV and beam intensity setting of 5. Surface EDS maps were acquired also using the TESCAN MIRA3 SEM using an accelerating voltage of 8 kV and beam intensity setting of 15. AFM images were acquired with a Veeco Dimension Icon AFM using a Bruker ScanAsyst-Air AFM tip. The data was analyzed using Nanoscope Analysis 2.0 software. X-ray photoelectron spectroscopy (XPS) was conducted using a Kratos Axis Ultra DLD. Survey scans used a pass energy of 160 eV, while core scans used a pass energy of 20 eV.
Results and Discussion
Characterization of Au interlayer
In this study, two distinct morphologies of Au on the LLZO surface were investigated. To form a clustered Au morphology on the LLZO surface, the LLZO was Au coated prior to a 400 °C heat treatment which is typically performed to reduce the thick Li/LLZO interfacial resistance. These samples will be referred to as Au-Clusters. To examine how the Au morphology effects Li plating, a flat Au interlayer was also formed on the LLZO surface by coating the LLZO after the 400 °C heat treatment. These samples will be referred to as Au-Flat. The morphology of the Au interlayers on the LLZO surface was characterized using SEM and AFM. SEM images (Fig. 1a) show that the surface of the Au-Flat LLZO is relatively uniform with some small particulate growth on the LLZO surface. EDS mapping of Au-Flat LLZO (Figs. S4a–S4c) confirms that the Au is distributed homogeneously over the surface. The particulate growth on the surface of the Au-Flat LLZO is likely Li2CO3, which has previously been shown to form on the LLZO surface. 27 This is supported by EDS mapping showing elevated O content corresponding to the particulate growth. The surface of the Au-Clusters LLZO (Fig. 1b) shows the Au layer has coarsened and separated into discrete islands of Au on the LLZO surface. This is confirmed by EDS mapping of the Au on the LLZO surface (Figs. S4d–S4f). This phenomenon has been observed previously when annealing Au thin films on silicon and glass surfaces. 28–31 These previous studies demonstrated that the morphology of the Au formed depended on the duration of annealing, with the Au clusters coarsening as the annealing time is increased. 29
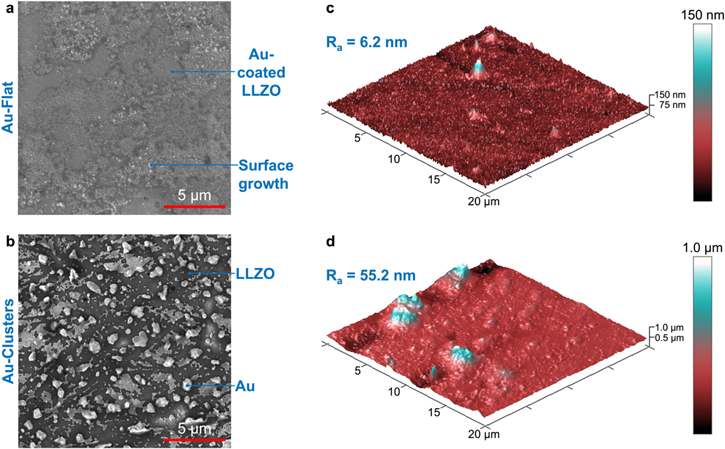
Figure 1. SEM images of Au-coated LLZO surface with Au layer deposited (a) after heat-treatment (Au-Flat) and (b) before heat-treatment (Au-Clusters), as well as AFM images of the LLZO surface with (c) Au-Flat and (d) Au-Clusters, where Ra is average roughness.
Download figure:
Standard image High-resolution imageThe morphology of the Au layer was also examined using SEM at different locations on the LLZO surface to compare differences at the center of the pellet vs the edge. Au-Flat samples demonstrated consistent morphology regardless of location on the pellet (Figs. S5a,S5b). However, it was observed that the Au-Clusters layer had different Au morphology at the edge vs the center of the LLZO pellet (Figs. S5c,S5d). While the Au layer separated into discrete islands over the majority of the LLZO surface, near the edges the Au layer is mostly intact with a few small pinholes. EDS mapping confirms the identification of the Au layer on top of the LLZO (Fig. S4g–S4i). It is hypothesized that densifying the LLZO through the rapid-induction hot-press method leads to variations in the density or grain morphology of the LLZO pellet. This may be due to gradients in temperature or pressure associated with the rapid-induction hot-pressing procedure. A previous study including electron back-scatter diffraction of the grain structure of rapid-induction hot-pressed Al-doped LLZO over a 6 mm radial section appears to show variation in microstructure with position. 32 However, the different elemental doping of the Al-doped LLZO studied previously will likely lead to different grain characteristics in the Ta-doped LLZO here. 33 In order to fully understand the behavior of Au on the LLZO surface during annealing, the density and grain morphology of Ta-doped hot-pressed LLZO should be fully characterized.
AFM was used to examine the 3D morphology of the Au interlayers observed with SEM. It can be seen in Fig. 1c that the surface of the Au-Flat LLZO is mostly uniform in height with a few small variations that reach ∼150 nm. The average roughness (Ra) of the Au-Flat sample was calculated to be 6.2 nm. This roughness value increases to 55.5 nm for the Au-Clusters sample. AFM imaging of the Au-Clusters surface (Fig. 1d) shows numerous small clusters with height around 500 nm, and a few clusters with height reaching 1,000 nm. X-ray photoelectron spectroscopy (XPS) was used to investigate surface chemistry differences in the Au-Flat and Au-Clusters samples (Fig. S6). Both samples were found to have peaks corresponding to Au, C, and O, where C and O can be attributed to the previously discussed Li2CO3 formation on the LLZO surface. Interestingly, the Au-Clusters sample also shows a small (0.67 atomic percent) amount of Na. This Na may diffuse into the Au interlayer during the heat treatment from small impurities in the LLZO, as the Li2CO3 precursor used in solid-state synthesis of LLZO is known to contain a small amount of Na2O. Next, the difference in Au interlayers will be correlated to electrochemical behavior during in situ Li plating.
Lithium plating
To show the effect of Au morphology on in situ Li plating, cells with a Cu CC, Au-coated LLZO, and thick Li counter electrode were assembled (Figs. 2a, 2b). This cell construction differs from previous reports of "Li0-free" LLZO cells in that the Cu CC is placed on the surface instead of laminating at 900 °C to produce conformal contact between Cu/LLZO. 14,15,20 The open circuit voltage (OCV) of the Au-Flat cell was 1.8 V, while the OCV of the Au-Clusters cell was measured to be 1.1 V (Fig. S7). The discrepancy in OCV values between the Au-Flat and Au-Clusters cell may be caused by the small amount of Na contained in the Au-Clusters interlayer, as shown by XPS measurements (Fig. S6). The potential response of the cells upon application of a constant current (0.2 mA cm−2) was recorded, and Fig. 2c shows representative voltage profiles during initial in situ Li plating for both Au-Flat and Au-Clusters cells. Past works of in situ Li plating on bare CCs show a drop of potential below zero to a minimum, followed by a decrease in polarization to an asymptotic value. 15,20,22,23 This initial drop in potential is sometimes referred to as the Li nucleation overpotential, meaning that it is the overpotential required to nucleate Li on a bare CC. In contrast, the Au-Clusters cell exhibits an alloying nucleation overpotential above 0 V before first plateauing at ∼215 mV. This voltage dip is a well-known phenomenon of the overpotential needed to nucleate a new phase in a Li alloying material. 34,35 Importantly, this alloying nucleation overpotential is distinct from what is typically seen in "Li0-free" cells at a potential below 0 V. The Li nucleation overpotential seen below 0 V represents the nucleation energy of Li on the CC, and from mechanical stresses associated with debonding the CC from the SSE. 14,15
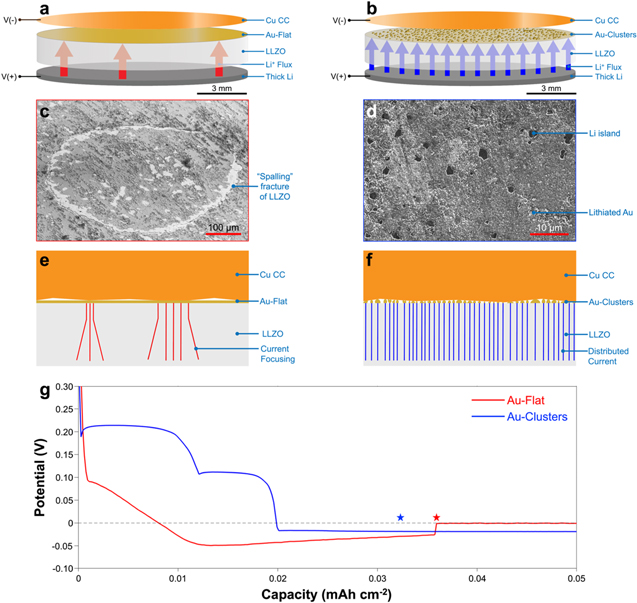
Figure 2. (a) Schematic of in situ Li plating in a cell with Au-Flat interlayer. (b) Schematic of in situ Li plating in a cell with Au-Clusters interlayer. (c) "Spalling"-type failure of LLZO after in situ Li plating of Au-Flat cell. (d) Li islands formed on Au-coated LLZO surface upon initial in situ Li plating of Au-Clusters cell. (e) Schematic showing hypothesized Cu/LLZO contact with Au-Flat leading to current focusing. (f) Schematic showing hypothesized Cu/LLZO contact with Au-Clusters leading to distributed current. (g) Potential response upon initial in situ plating for Au-Flat (red) and Au-Clusters (blue) cells. The sudden drop of polarization voltage for the Au-Flat cell, likely corresponding to short-circuiting, is marked by a red star. A blue star marks the charge passed for the Au-Clusters cell corresponding to the SEM image in d.
Download figure:
Standard image High-resolution imageAfter the alloying nucleation overpotential is observed, the Au-Clusters cells show two lithiation plateaus consistent with previous studies of Au lithiation in liquid electrolyte systems. 24,36 The two plateaus likely correspond to the formation of Li2Au (∼215 mV) and Li3Au (∼100 mV). 37 Using the capacity associated with each voltage plateau, the amount of active Au participating in the alloying reaction can be estimated. The voltage plateau at ∼215 mV corresponds to a capacity of ∼12 μAh cm−2, or 55 μg of active Au participating in the formation of Li2Au. This corresponds to ∼15% of the total Au estimated to have been deposited initially (Fig. S1), indicating that most Au does not electrochemically alloy with Li. Therefore, the remaining ∼85% of Au which does not electrochemically alloy with Li may chemically alloy with Li after in situ Li is plated or may remain as elemental Au due to kinetic limitations. It has been shown that at 60 °C, a flat layer of Au will chemically alloy with Li without an electrochemical driving force. 38 Therefore, Au which is not electrochemically lithiated initially may be chemically lithiated after in situ Li is plated. However, the morphology of the Au may limit the reactivity and kinetically limit the Li/Au reaction. Here, the Au is in the form of ∼1 μm clusters, while the previous study showing chemical Au/Li alloying was performed using a thin (100 nm) flat layer of Au. The outer shell of the Au clusters may alloy with Li, while the inside remains as elemental Au. Further study of the lithiation mechanism of Au clusters at a solid/solid interface is needed to understand the limited electrochemical activity of the Au studied here. The second voltage plateau at ∼100 mV corresponds to a capacity of ∼8 μAh cm−2, or 25 μg of Au participating in the formation of Li3Au. This indicates that not all Li2Au formed may be converted to Li3Au. After the second voltage plateau, the potential of the cell drops below zero, followed by a sustained negative potential indicating the onset of Li metal plating. While previous reports of "Li0-free" cells exhibit an overpotential at this point associated with the nucleation of Li metal, the Au-Clusters cell does not show any nucleation overpotential below 0 V. 14,15,20 This indicates that the overpotential required to nucleate Li on lithiated Au is negligible. Notably, the voltage profile of the Au-Clusters cell is distinctly similar to that of lithiation on Au coated Cu in liquid electrolyte cells. 24
The Au-Flat cell has a different potential response, showing a steady slope instead of two distinct voltage plateaus. A previous study of LLZO SSE with a flat Au CC only recorded one voltage plateau at 200 mV with no secondary plateau, which was hypothesized to be due to kinetic limitations. Here, current focusing leading to localized increased current densities may cause similar kinetic limitations that prevent defined voltage plateaus during plating of Au-Flat cells. While the Au-Clusters cell does not show any nucleation overpotential, the nucleation overpotential for the Au-Flat cell cannot be accurately evaluated because failure occurs before a steady-state voltage can be achieved. The increase in voltage after the minimum for the Au-Flat cell may indicate a nucleation overpotential or may be due to Li filament growth through the LLZO leading to a decrease in cell resistance before failure. Post-mortem analysis of the Au-Flat cell after failure reveals "spalling"-type failure of the LLZO (Fig. 2b) as well as Li-filled cracks in the LLZO (Fig. S8). These types of failure indicate increased local current density, likely caused by imperfect Cu/LLZO contact. 39 Previous studies have shown that Li can be plated in situ at the Cu/LLZO interface without the presence of interlayers if conformal contact can be made through a high-temperature lamination process. 14 It is likely that in the Au-Flat cells, where the Cu CC has been placed on the LLZO surface instead of bonded to the LLZO surface, lack of intimate and uniform Cu/LLZO contact leads to the formation of "hot-spots" and short-circuiting.
Conversely, the Au-Clusters cell shows stable in situ Li plating to the chosen capacity of 3.3 mAh cm−2 (16.5 μm thickness). This capacity of Li plated was chosen to match a typical cathode loading of 3 mAh cm−2 with an additional 10% of excess Li, assuming that during commercial cell operation the Li anode will not be fully depleted. 4,14 While the Au-Flat cell shows failure indicative of local increased current density (Fig. 2b, at a similar amount of charge passed the Au-Clusters cell has multiple distributed Li islands (<5 μm) on the LLZO surface (Fig. 2d). It is also evident that the surface morphology of the Au on the LLZO surface has changed after in situ Li plating (Fig. 2d) compared to Fig. 1b (before charge is passed). The difference in Au morphology may be due to swelling of the Au during lithiation, as the conversion of Au to Li3Au corresponds with an increase of 3.34x the original Au volume. 37
Based on the different in situ Li plating behaviors exhibited by Au-Clusters vs Au-Flat cells, it is hypothesized that the Au interlayer morphology affects the current distribution across the LLZO surface. In Au-Flat cells, the Au-coated LLZO surface has little height variation as evidenced by Fig. 1c. This may lead to disparity of Cu/LLZO contact across the LLZO surface, leading to some regions with increased local current density (Fig. 2e). In contrast, the non-continuous Au interlayer in Au-Clusters cells with Au height up to ∼1 μm above the LLZO surface (Fig. 1d) may provide enhanced Cu/LLZO contact and seeded nucleation sites for in situ plating of Li (Fig. 2f). Due to the large number of Au clusters to act as seeds for Li nucleation, the current density is spread more evenly across the face of the LLZO, leading to stable Li deposition. Seeded nucleation of Li in a liquid electrolyte system was previously explored by Yan et al. 24 This work demonstrated that patterned Au on a Cu CC could act as a seed for Li deposition. It is hypothesized that for clustered Au on LLZO, the Au interlayer performs similarly to seed in situ Li deposition. The XPS results (Fig. S6) show that there are also slight chemical differences in the Au-Flat and Au-Clusters interlayers, with the Au-Clusters interlayer containing 0.67 atomic percent Na. Previous work has shown that introducing an Na-K eutectic liquid between the Li and LLZO increased the maximum current density achievable without short-circuiting. 40 This same study also showed that the Li-Na system will not form liquid phases at room temperature (or 60 °C), and therefore a similar effect to the Na-K eutectic liquid is not expected to enhance plating stability of Li in this current study. Therefore, we attribute the morphology of the Au layer to be the controlling factor in stable Li plating. Based on the consistent short-circuiting of Au-Flat cells, this type of Au interlayer was not studied further. To better understand the in situ Li plating behavior in Au-Clusters cells, the Li morphology was examined using focused ion beam milling and SEM.
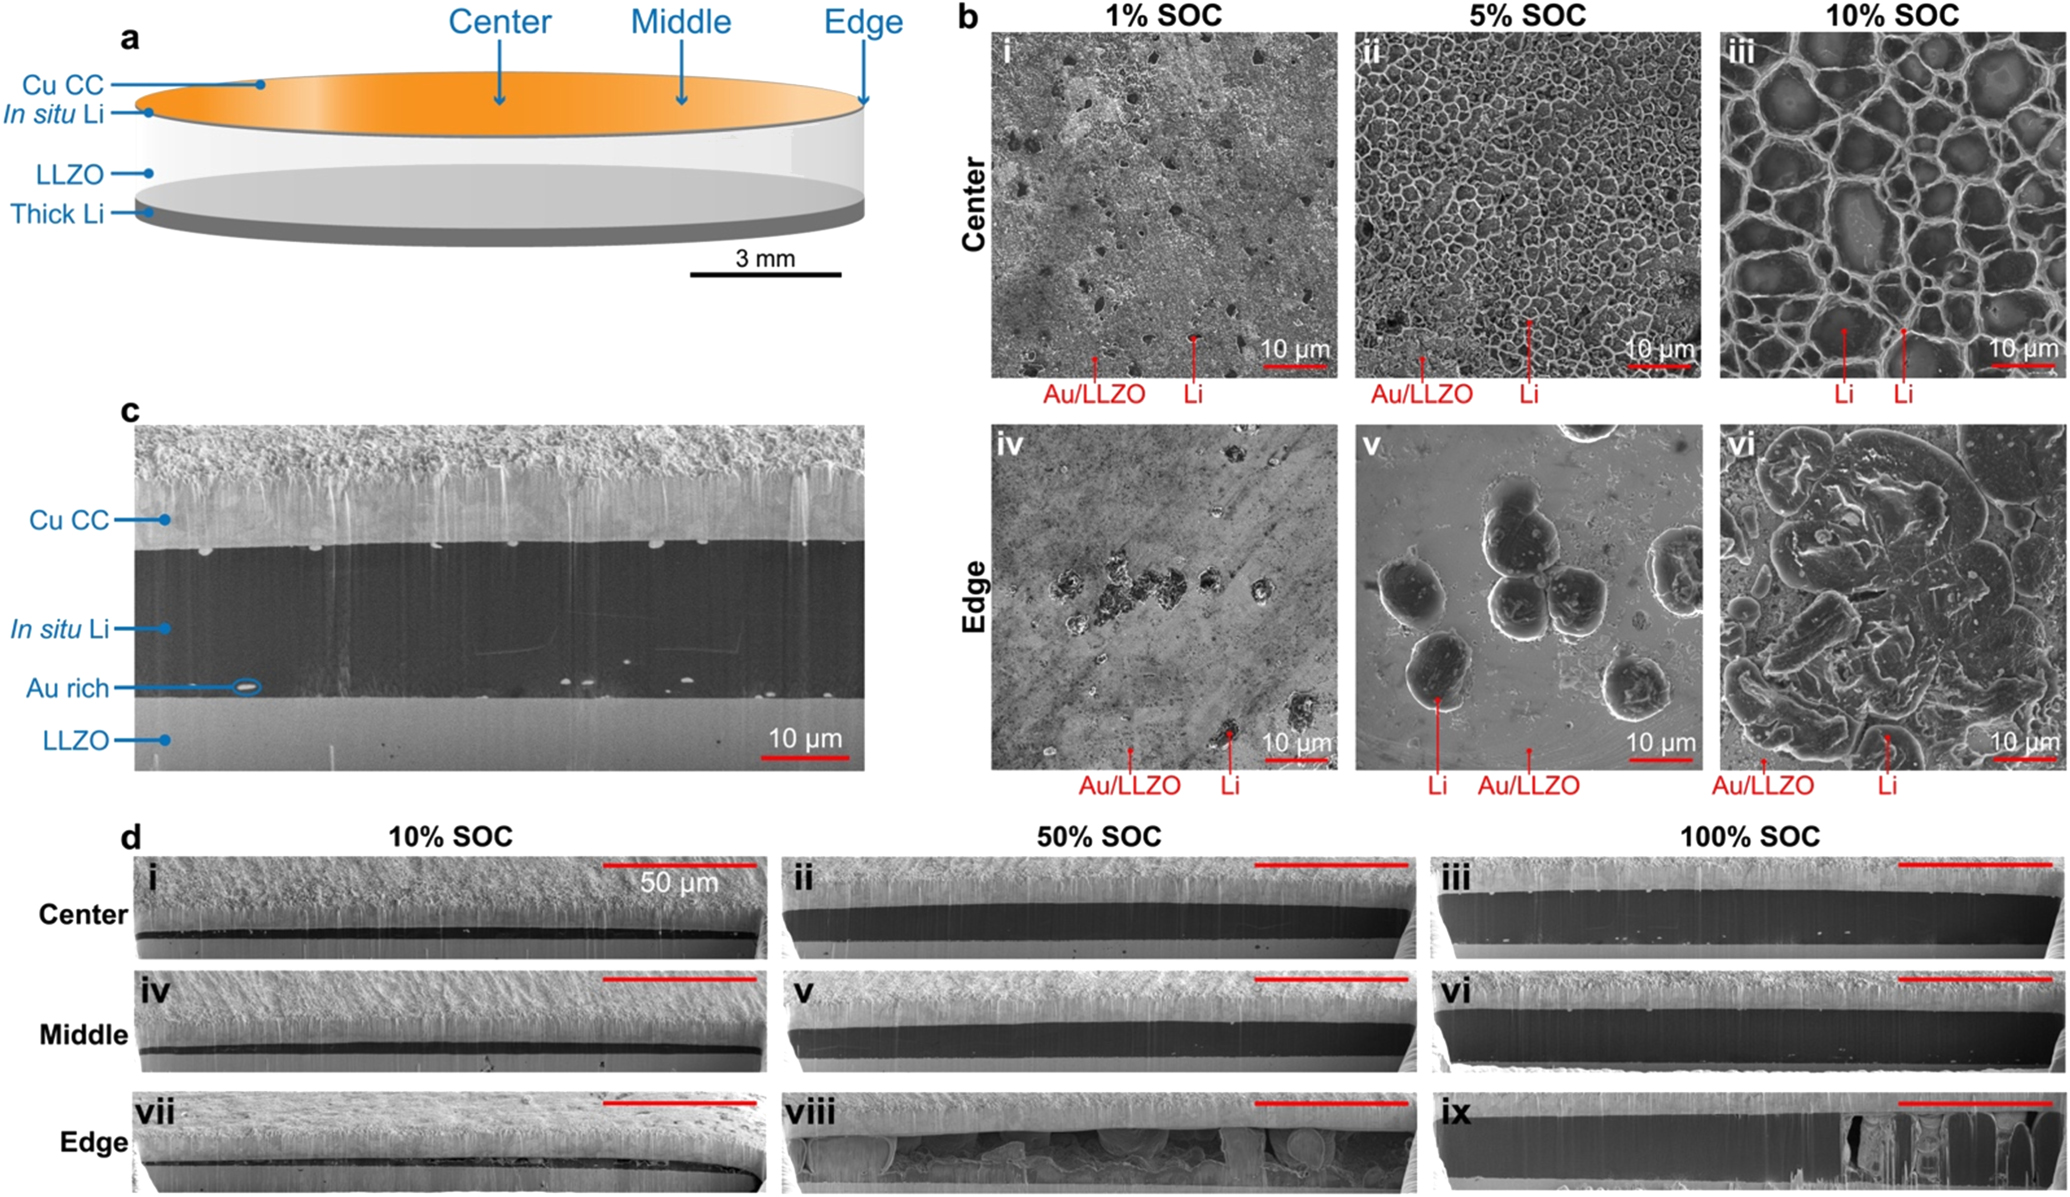
The in situ plated Li morphology was examined as a function of state-of-charge (SOC) and position on the face of the cell (center, middle, or edge) (Fig. 3a). The Cu CC was removed from the face of the Au coated LLZO, and SEM was used to image the LLZO surface at 1, 5, and 10% SOC. As seen in Fig. S5c–S5d, the morphology of the Au interlayer for the Au-Clusters cells varies between the center and edges of the sample. Therefore, both the center and the edge of the LLZO surface were imaged using SEM at varying SOC. At 1% SOC in the center of the LLZO surface, the Au morphology has changed due to the onset of in situ Li plating as described previously (Fig. 3bi). Numerous small islands (< 5 μm) of in situ plated Li have formed. As the SOC is increased to 5%, a dimpled fracture morphology of the in situ Li is observed as a consequence of peeling of the Cu CC (Fig. 3bii). The dimpled fracture surface morphology is typical of ductile materials such as Li. 41 It appears that at 5% SOC, the Li has started to form a continuous layer in the center, although the Au clusters are still visible beneath the fractured Li (Fig. S9). At 10% SOC, the Au clusters are no longer visible beneath the fractured in situ plated Li (Fig. 3b iii). It is believed that the contrast seen in this image is a result of surface topography, where the edges of the Li dimples are higher than the center, resulting in increased brightness at the edges. It is evident that the size of the dimples in the fracture surface have increased compared to the sample at 5% SOC. It is hypothesized that the increase in dimple size with SOC is due to a decrease in the volume fraction of inclusions in the Li, where the Au clusters may act as inclusions. In ductile materials, voids frequently nucleate at inclusions and spread until void linkup occurs, which determines the size of the dimples on the fracture surface. 41 When the inclusion volume fraction decreases as more in situ Li is plated and the amount of Au clusters remains the same, the dimple size may increase as shown in Fig. 3b ii-iii.

Figure 3. (a) Schematic of a cell with in situ plated Li metal electrode denoting the positions of center, middle, and edge used in FIB/SEM characterization. (b) SEM of LLZO surface at 1, 5 and 10% state-of-charge (SOC) during plating both in the center of the sample (i-iii) and the edge (iv-vi). (c) Cross-sectional SEM image after FIB milling of cell at 100% SOC in center of the sample showing position of Cu CC, in situ Li, and LLZO as seen in part d. (d) Cross-sectional SEM images at 10, 50, and 100% SOC at center, middle, and edge positions of in situ plated Li. All scale bars in c are 50 μm.
Download figure:
Standard image High-resolution imageThe in situ plated Li morphology at the edge of the LLZO surface shows markedly different morphology than at the center of the LLZO surface. At 1% SOC, a few Li islands with diameter ∼5 μm have formed. Compared to the center of the sample, there are fewer Li islands and each Li island is larger. The morphology of the islands in the center vs the edge of the LLZO surface also varies. While the small islands in the center have relatively flat tops, the islands at the edge of the LLZO appear to be rough. As the SOC is increased to 5%, these islands grow in size to diameter ∼10 μm before beginning to coalesce at 10% SOC. Although the Li shows signs of coalescence at 10% SOC, the surface coverage of Li on LLZO is not complete. It is also noted that on the edge of the sample, the Li does not have a morphology consistent with a fracture surface, unlike at the center of the sample. This could be due to reduced pressure at the edge of the LLZO surface. Previous studies of in situ Li plating on the LLZO surface which used the same pressure fixture as in this study showed using pressure-sensitive paper that the pressure was concentrated in the center of the sample. 15 It is hypothesized that the differences of in situ plated Li morphology at the edges of the LLZO surface vs the center is due to both the differences in Au interlayer morphology shown previously, and perhaps inhomogeneity of pressure across the cell radially.
At 10% SOC a continuous layer of in situ plated Li metal had formed in the center of the cell, so for SOC ≥10% cross-sections of the LLZO/ situ Li/Cu interface were milled using a plasma focused ion beam (FIB) and examined using SEM. Previous studies have suggested that using plasma FIB milling with Xe-ion sources is less destructive to the Li morphology than traditional Ga-ion FIB milling, without the need to use cryogenic temperatures. 42 FIB milling and SEM imaging were carried out at 10, 50 and 100% SOC in the center, middle and edge of the cell. For each sample, 3 FIB cuts were made at the center, middle, and edge of the cell. Fig. S10 illustrates these cuts for a sample with 3.3 mAh cm−2 of in situ Li plated, and shows that the edge of the sample has the most variability in Li morphology, with more voids observed in the cross-section closest to the edge of the sample. Therefore, for cross-sections labeled "Edge" in Figs. 3–5, the FIB cut was made as close as possible to the edge of the sample for maximum variability in Li morphology to be observed. A typical cross-section of a cell at 100% SOC is shown in Fig. 3c, and the orientation of the LLZO, Li, and CC in Fig. 3c is the same as in the cross-sections in Fig. 3d. The cross-section shows that the in situ plated Li is dense and conformal to the LLZO and CC in the center of the sample. Small, bright secondary phase particulates can also be observed in the in situ plated Li cross-section. These particulates are observed to be near the CC, near the LLZO surface, and interspersed throughout the in situ plated Li. EDS was performed on a cross-section of in situ plated Li and showed that the particulates are an Au-rich phase (Fig. S11). Based on the charge passed during the alloying plateaus shown in Fig. 2g, not all Au in the interlayer alloys with Li. Therefore, these particulates may be Au clusters that did not alloy with Li, or may be a partially lithiated Au phase.
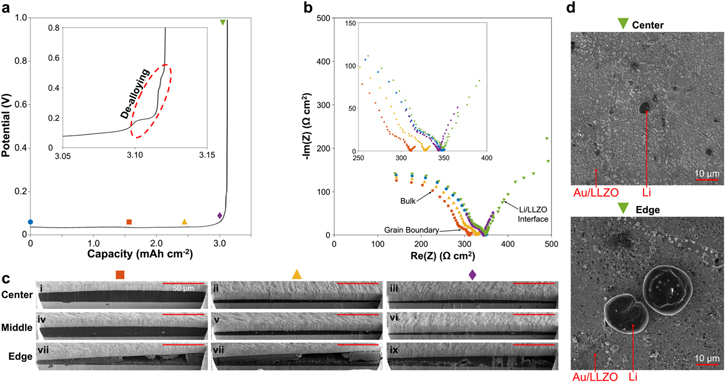
Figure 4. (a) Potential response during stripping of in situ plated Li, with inset showing polarization up to 1 V. Each symbol (circle, square, triangle, diamond, and inverted triangle) represents a GEIS measurement superimposed during the DC stripping at 0.2 mA cm−2. (b) GEIS spectra collected at the indicated points in a. (c) Ex situ cross-sectional SEM images of the LLZO/in situ Li/Cu interface at the corresponding points to a and b. All scale bars in c are 50 μm. (d) Ex situ SEM of the LLZO surface after polarization to 1 V showing differing residual Li at center of sample vs edges.
Download figure:
Standard image High-resolution image
Figure 5. (a) Potential response during plating and stripping of in situ plated Li at 0.2 mA cm−2 and 60 °C showing 97.4% recovery during stripping of in situ plated Li. (b) Inset of graph a showing potential response during in situ plating of Li upon initial cell assembly (black) and after plating 3.3 mAh cm−2 then stripping to 1 V polarization (red), where all plating and stripping was carried out at 0.2 mA cm−2 and 60 °C. (c) Ex situ cross-sectional SEM images of the LLZO/in situ Li/Cu interface after plating 3.3 mAh cm−2, stripping to 1 V polarization, then re-plating 3.3 mAh cm−2. (d) Cycling at 0.2 mA cm−2 with capacity 3.3 mAh cm−2 at 2.5 MPa and 60 °C. Full CE data vs. cycle data is shown in Fig. S14.
Download figure:
Standard image High-resolution image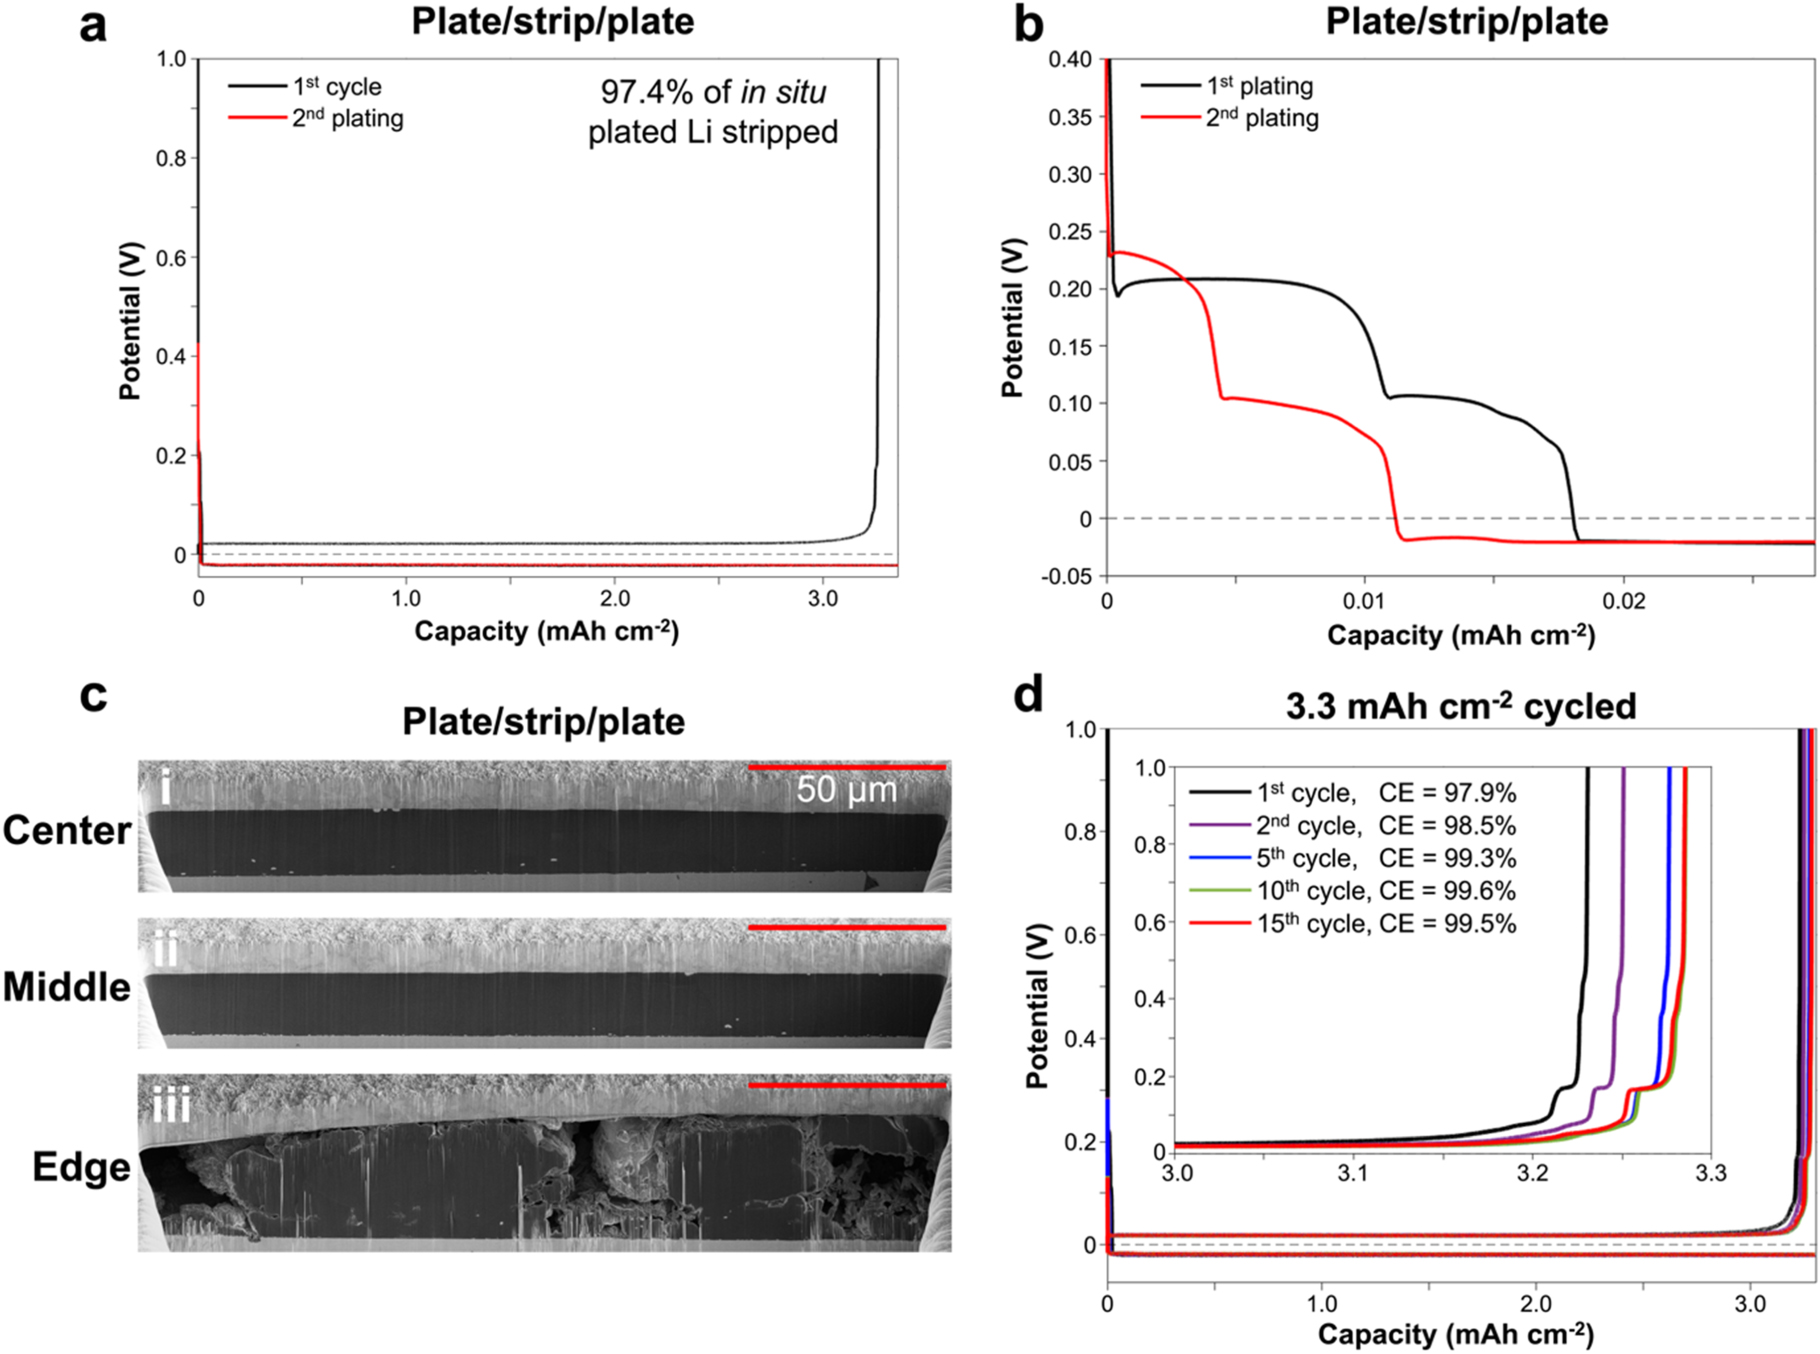
Cross-sections shown in Fig. 3d reveal the in situ plated Li to be homogeneous and uniform in thickness in the center and middle of the cells at 10, 50, and 100% SOC. Au-rich clusters are dispersed throughout the in situ plated Li cross-sections in the center and middle for all SOC examined, although the distribution of the clusters is not uniform. At 100% SOC, 3.3 mAh cm−2 of Li has been plated, which should correspond to a Li thickness of 16.5 μm. At both the center and middle of the sample, the thickness of the in situ plated Li layer is measured to vary between 16 − 18 μm over the 200 μm wide milled cross-sections. This indicates that there is some non-uniformity in the thickness of in situ plated Li. At the edge of the sample, voids are present in the in situ plated Li at 10, 50, and 100% SOC. At 10% SOC, differing morphology of the Au interlayer can be observed (Fig. S12). In some places, thin bands of Au can be observed, which correspond to the flat Au morphology observed at the edge of the LLZO surface in Fig. S5. Other parts of the cross-section show Au particulates interspersed in the plated Li. The Au morphology, which is dependent on the position, may vary within the span of the 200 μm cross-sectional cuts, leading to varying Li morphology. At 100% SOC on the edge of the cell, the in situ plated Li thickness reaches 25 μm in some regions, while other regions have large voids. The combined surface and cross-sectional SEM measurements as SOC is increased reveal the effect of initial Li nucleate morphology on the homogeneity of the fully plated in situ Li. While many small and flat Li islands quickly merge into a continuous layer by 10% SOC in the center of the cell, large and uneven Li islands at the edge do not merge as the SOC is increased. This results in voids in the in situ plated Li at the edges, while the Li in the center and middle of the cell is dense and homogeneous. Next, the morphology of the in situ plated Li will be examined under anodic current (in situ Li stripping).
Lithium stripping
With the in situ plated Li morphology characterized, the impact of morphology on stripping in situ plated Li was examined. Cells were stripped at 0.1 mA cm−2 to a cutoff voltage of 1 V at room temperature under 2.5 MPa pressure. While in situ Li was plated at 60 °C, stripping was performed at room temperature to record operando galvanostatic electrochemical impedance spectra (GEIS) during the stripping process. At designated points, an AC current with magnitude 0.015 mA cm−2 was imposed in addition to the DC stripping current of 0.1 mA cm−2 to perform the GEIS measurements in operando. Under these conditions, 92% of the in situ plated Li was recovered during stripping. The impedance spectra were collected at five specific points during stripping: at 0% DOD (blue circle), 50% DOD (orange square), 75% DOD (yellow triangle), when the cell polarized to 2x the average voltage from 0%-50% DOD (purple diamond), and during polarization to 1 V (green inverted triangle). The potential response during stripping of in situ formed Li is shown in Fig. 4a, and the corresponding Nyquist plots obtained through GEIS measurements are shown in Fig. 4b. Some shifting of the impedance spectra is observed in the Nyquist plot at 50 and 75% DOD. While decreases in cell impedance can be evidence of soft short-circuiting, it is seen that in the final two GEIS measurements the bulk and grain boundary impedances still closely correspond with the initial measurement at 0% DOD. Therefore, the shifting in impedance spectra is likely due to temperature fluctuations in the glovebox during testing. The potential response during stripping is similar to previous reports of stripping in situ Li using Cu/LLZO with no Au interlayer. 20 First, a "quasi-stable" period of stripping is observed where the cell voltage remains steady during stripping. The GEIS spectra at 0, 50 and 75% SOC are included in this "quasi-stable" regime of stripping, where a small Li/LLZO interfacial resistance can be observed. The "quasi-stable" regime is then followed by an unstable voltage polarization of the cell where the Li/LLZO interfacial resistance increases quickly. 43 The GEIS spectra marked by the purple diamond and green inverted triangle are included in this unstable regime, and this is supported by the increases in interfacial resistance represented at low frequencies in the Nyquist plot in Fig. 4b. It is noted that while Li/LLZO interfacial resistance is usually represented by a semicircle in the Nyquist plot, the low frequency limit for GEIS measurements was limited to 1 Hz to avoid distortion of the DC stripping behavior by the long acquisition time of measurements below 1 Hz. The stripping behavior of the Au seeded in situ plated Li differs from previous studies in the unstable stripping regime during polarization to 1 V, as shown in the inset of Fig. 4a. A plateau is visible at ∼180 mV, likely corresponding to de-alloying of Li and Au. The de-alloying of Li from Au in liquid electrolytes has been studied using transmission electron microscopy, and while intermediate phases could not be identified, the final phase of Li de-alloying from Au was LiAu3. Therefore, it is likely that after polarization of the cell to 1 V, the lithiated Au is not completely transformed back to pure Au.
The morphology of the in situ plated Li was characterized by FIB milling at the interface with cross-sectional SEM for the first 3 selected points during stripping. At the last selected point during stripping (after polarization to 1 V), the morphology of the remaining Li was characterized by SEM of the LLZO surface. This is because after polarization to 1 V, there was no longer adhesion between the LLZO and Cu. In the center of the sample, Li is stripped homogeneously over the points observed (Fig. 4c), and after stripping to 1 V polarization some Li particulates are still visible on the Au coated LLZO surface. After polarization to 1 V, the Au on the LLZO surface appears to have contracted compared to the lithiated Au (Fig. 3bi) due to a decreased density after some de-alloying of Li. In the middle of the sample, the Li is stripped with no voids over the first two points characterized at 50 and 75% SOC. This changes when the stripping of Li enters the unstable phase, corresponding to the accelerating formation of voids (marked by a purple diamond). At this point voids have formed in the in situ Li in the middle of the sample, but not at the center (Fig. S13). The preferential formation of voids in the Li at the middle of the sample may be due to lower pressure radially outwards from the center of the cell or may be caused by the closer position to the edge of the sample, where the Li stripping is limited. Cross-sectional SEM analysis of the Li at the edge of the sample during stripping shows large voids present, consistent with the morphology seen during in situ Li plating at the edge. After polarization to 1 V, large (∼10 μm) spherules of Li are still present on the LLZO surface (Fig. 4d). It appears that the limited recovery (8% irreversible) of in situ plated Li in this cell configuration is due to the Li at the edge of the sample, which has irregular morphology. This irregular morphology may lead to contact loss with the CC or LLZO during stripping, decreasing the accessible Li capacity. Electrochemical and cross-sectional SEM characterization in the previous sections showed that the Au clusters go through alloying/de-alloying transitions during plating and stripping, as well as some physical separation from the LLZO surface as in situ Li is plated. Next, we examine the feasibility of re-plating in situ Li in a cell that has been stripped to 1 V despite possible changes in Au cluster distribution.
Cycling behavior
To investigate the repeatability of in situ Li plating after stripping, cells were plated and stripped at 0.2 mA cm−2 to a cutoff voltage of 1 V at 60 °C under 2.5 MPa pressure. In the first cycle at 60 °C, 97.4% of the in situ plated Li is stripped, an increase of 5% compared to room temperature stripping at 0.1 mA cm−2. After stripping, in situ Li plating is repeated, and 3.3 mAh cm−2 of Li are re-plated with stable deposition behavior (Fig. 5a). The voltage profiles for in situ Li plating during the 1st and 2nd cycles are steady and nearly identical other than the initial voltage plateaus corresponding to Au alloying. When in situ Li is re-plated, the first voltage plateau is shortened, corresponding to a reduced capacity of 4 μAh cm−2 during re-plating compared to 10 μAh cm−2 during the first plating (Fig. 5b). This first voltage plateau likely corresponds to the formation of Li2Au, and the reduced capacity of this plateau may indicate that after cell polarization to 1 V some Li2Au remains and is not de-alloyed from Li. Krauskopf et al. also found that Li could not be completely stripped from a formed Li2Au alloy on the LLZO surface. 22 The incomplete de-alloying of Li2Au is also supported by the change in alloying nucleation overpotential behavior during re-plating of in situ Li. The first plating voltage profile shows an alloying nucleation overpotential before the plateau at ∼215 mV corresponding to the nucleation of Li2Au, as discussed earlier. Upon re-plating of Li, this nucleation overpotential disappears. Studies of Li alloys by Huggins have shown that if some secondary phase is already present due to incomplete de-alloying, no nucleation overpotential is observed on the next cycle. 35 Therefore, the presence of Li2Au from incomplete de-alloying likely prevents the alloying nucleation overpotential on the re-plating of Li. The capacity of the second Au alloying plateau corresponding to the formation of Li3Au remains constant for the 1st and 2nd Li platings at 7 μAh cm−2. Therefore, it is likely that the reduced capacity corresponding to the first alloying plateau is caused by incomplete de-alloying of Li2Au after cell polarization to 1 V. The consistent capacity of the Au alloying plateau corresponding to the formation of Li3Au suggests that the repeated in situ plating of Li is enabled again by the Au clusters, similar to the first plating.
The morphology of the in situ plated Li was characterized after plating, stripped, and re-plating to examine where excess Li may accumulate and if re-plated Li was homogeneous (Fig. 5c). Cross-sectional SEM showed that at the center and middle of the sample, re-plated in situ Li was uniform and consistent with the morphology observed during the first plating (Fig. 3d). At the center and middle of the sample, the re-plated in situ Li thickness was measured to range between 15–17 μm. However, the edge of the sample showed both large voids and regions where the Li thickness reached up to 32 μm. It appears that due to incomplete Li stripping at the edge of the sample, as evidenced in Fig. 4d, some Li may accumulate at the edge of the sample after re-plating. To investigate the CE of stripping in situ plated Li over multiple cycles, cells were cycled at 0.2 mA cm−2 with 3.3 mAh cm−2 of Li plated, followed by stripping to a voltage cutoff of 1 V at 60 °C under 2.5 MPa pressure (Fig. 5d). A high first-cycle CE of 97.9% was recorded, increasing to 99.5% on the 15th cycle (Fig. S14). As demonstrated in Fig. 4d, the irreversibility during stripping is likely due to irregular Li morphology at the edges of the cell, leading to contact loss between the Li and CC or LLZO. Over each cycle, excess Li will remain after stripping in areas where there is poor contact between the Li and CC or LLZO. The build-up of this Li may enhance the contact between the plated Li and CC or LLZO by filling in gaps of contact, therefore producing the increase of CE over cycle that is shown in Fig. S14. It has been shown that relatively high (97.9%) first-cycle CE can be achieved, and that Li can be re-plated in situ even after polarizing the cell to 1 V and the Au clusters are redistributed during initial plating/stripping. The repeatability of Li plating after stripping shows promise for seeded Au interlayers to enable long cycle-life "Li0-free" batteries.
Conclusions
In this work, we demonstrated stable Li metal plating of 16.5 μm (3.3 mAh cm−2) in LLZO "Li0-free" cells enabled by seeded nucleation of Li metal. Cells with a flat Au layer on the LLZO surface repeatedly short-circuited during in situ Li plating, limiting Li electrodeposition to <0.1 mAh cm−2. Performing a heat treatment of the Au-coated LLZO transformed the flat Au layer into discrete clusters of Au, which may act as seeds for Li nucleation and lead to stable Li plating. The "Li0-free" cells were assembled without high temperature or pressure interface formation steps which are usually required to facilitate intimate CC/SSE contact. The protrusion of the Au clusters from the LLZO surface may create beneficial electrical contact between the CC/SSE, preventing localized current density increases. However, it was found that the Au morphology varied over the LLZO surface, and that this Au morphology influenced the morphology of the in situ plated Li. Over the majority of the LLZO surface, where the Au formed clusters, the Li plated uniformly and was able to be stripped nearly reversibly. Near the edge of the LLZO pellet where the Au layer remained mostly intact with a few pinholes, the Li plated irregularly with large voids in the microstructure and was not able to be completely stripped. Clearly, the morphology of the Au layer impacts the morphology of the plated Li, which in turn affects the reversibility of Li plating and stripping. Future work should focus on optimizing the heat treatment time and temperature of Au-coated LLZO to achieve the segregation of the Au layer across the entire surface of the LLZO. Cross-sectional SEM of in situ plated Li shows that Au clusters are present in the in situ plated Li throughout plating and stripping, and that the clusters are present both by the LLZO surface, current collector surface, and distributed in the Li. It was shown that the effect of the Au seed layer was repeatable over a second cycle after the in situ plated Li was stripped and the cell polarized to 1 V. Finally, it was shown that LLZO "Li0-free" cells cycled with a high CE of 97.9% on the first cycle, increasing to 99.% on the 15th cycle.
For the first time, we have clearly demonstrated the elimination of the Li nucleation overpotential by interposing an alloying interlayer in a solid-state "Li0-free" cell using commercial Cu current collectors. Past studies of Li nucleation overpotential in solid-state "Li0-free" cells assume mechanical contributions to the nucleation overpotential, including CC/SSE delamination. This work, which included an Au interlayer in a "Li0-free" cell with no CC/SSE lamination, showed a potential response during Li plating remarkably similar to what has been demonstrated in a liquid electrolyte system with different mechanical environment. These results motivate further examination of the contributions to Li nucleation overpotential, and how the nucleation overpotential in turn affects Li plating morphology and the reversibility of stripping. Finally, the demonstration of stable Li plating with no CC/SSE lamination or pre-formation steps challenges the previous assumption that intimate CC/SSE contact is needed to facilitate stable plating in "Li0-free" cells. While intimate CC/SSE contact is one path for stable Li plating, it is shown here that many distributed electrical contacts (Au seed clusters) can be sufficient to evenly distribute the current density across the cell. These findings could have important implications for manufacturing pathways of "Li0-free" cells.
Acknowledgments
The authors acknowledge the University of Michigan College of Engineering for financial support and the Michigan Center for Materials Characterization for the use of the instruments and staff assistance. C.H. and J.S. would like to acknowledge support from the Mechano-Chemical Understanding of Solid Ion Conductors, an Energy Frontier Research Center funded by the U.S. Department of Energy, Office of Science, Office of Basic Energy Science under grant no. DE-SC0023438.
Declaration of interests
CGH and JS have filed a provisional US patent related to this work, application number 63/426,817. JS is CTO of Zakuro, Inc.
Supplementary data (11.6 MB DOCX)