
Abstract
A conversion reaction mechanism of Cu3B2O6 during the electrochemical reduction in a Li-ion battery test cell was revealed. Different experimental techniques were used: X-ray diffraction (XRD), in situ synchrotron diffraction, quasi in situ X-ray photoelectron and Auger-electron spectroscopy (XPS and AES), and ex situ scanning electron microscopy (SEM). The reduction process changes the initial oxidation state of copper from Cu(II) to Cu(0). After the subsequent oxidation, only the Cu(I) state was recovered. However, a very high amount of carbon in the cathode mixture (65% w/w) enables the reversion of the Cu(II) state due to improved electronic conductivity. Synchrotron in situ diffraction did not indicate any significant change in the lattice parameters of Cu3B2O6 during any stage of reduction, which excludes a Li-intercalation mechanism.
Export citation and abstract BibTeX RIS
The present rechargeable lithium-ion batteries operate based on intercalation processes. These processes require electrode materials with open crystallographic structures, into which lithium ions can be inserted without reconstructive phase transitions. The change of the metal oxidation state is therefore limited by the available vacant sites for Li-ions in the underlying crystal structures. Higher capacities can be achieved in a conversion reaction, which does not preserve the initial structure type.1 So far, the electrochemical conversion reactions have been observed in various compounds such as oxysalts,2 fluorides,3 and nitrides.4 Some of them provide high capacities from hundreds of mAh/g for the cathodes to several thousands of mAh/g for anodes. For simple transition metals oxides, it is possible to reach capacities of 400–700 mAh/g (Ref. 1), while typical capacities in intercalation mechanism are 100–200 mAh/g.5 The conversion mechanism relies on an access of all oxidation states during the redox reaction down to the neutral metallic state. The general reaction of a conversion mechanism can be written as

During the first discharging, an electrode material MaXb is reduced to a nanosized metal or cluster M in a LiaX matrix, where X denotes oxygen or another anion like F, Cl or Br. Such particles are embedded in an organic or inorganic environment, formed by degradation products of the electrolyte. In the following cycles the sizes of the metallic clusters or nanoparticles do not change significantly, allowing sufficient reaction activity and keeping the diffusion paths of lithium as short as necessary.
Promising candidates for such electrode materials are transition metal borates, mainly because of the low weight of boron and its high electronegativity. In this paper, the investigations were focused on Cu3B2O6, which was used as the initial cathode material in lithium test cells.
The Cu3B2O6 copper borate with a triclinic symmetry represents a pronounced layered structure with an average distance between neighboring layers of about 2.8313 Å.6 Within each layer, the Cu atoms have a nearly quadratic planar coordination of oxygen atoms. The shortest Cu-O distance to the oxygen atom in the neighboring layer is 2.4021 Å. There are separated CuO4-polyhedra, corner-sharing with each other or with BO3-groups, Cu2O6-dimers and Cu4O10-tetramers from edge-shared CuO4 squares (Fig. 1). The BO3 groups are connected with each other and with CuO4-polyhedra only via corners. Such a crystal structure could serve as a host lattice for intercalation.
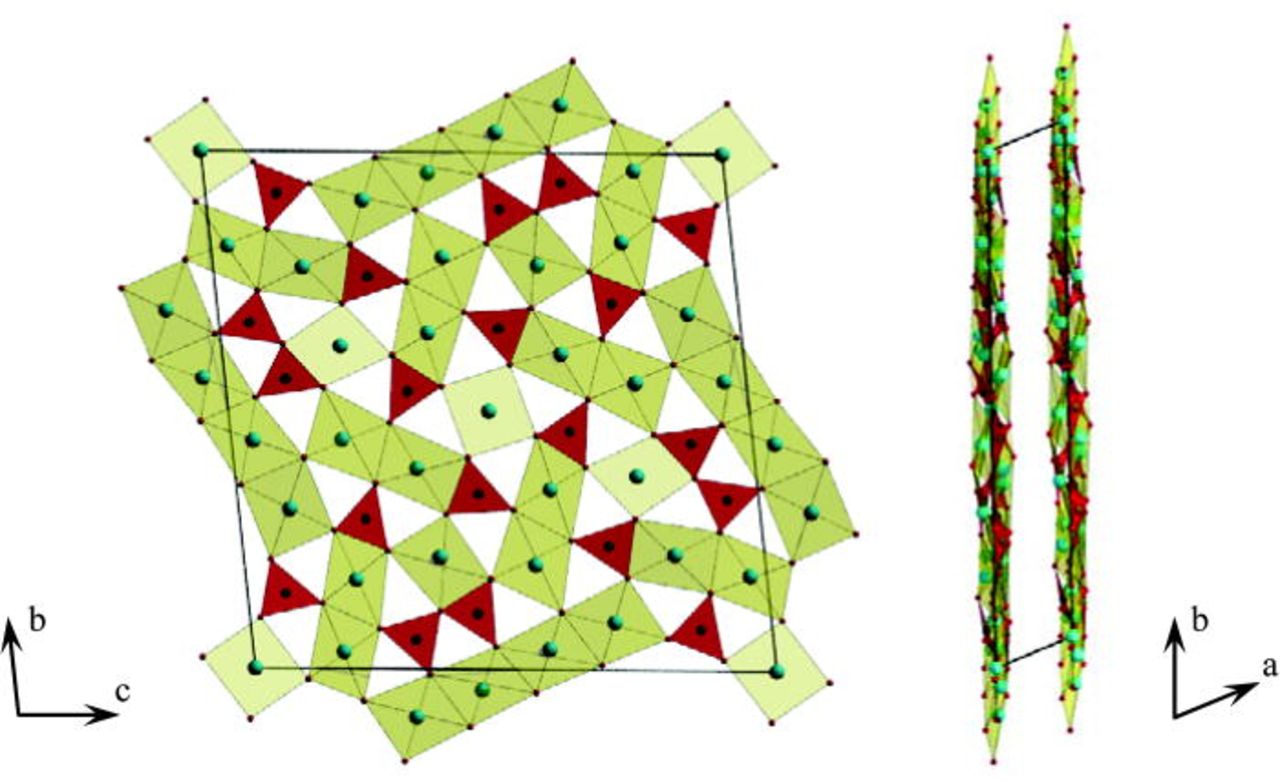
Figure 1. (Color online) Crystal structure of Cu3B2O6. The average distance between neighboring layers is about 2.8313 Å.6
In contrast to Cu3B2O6, other borates M3B2O6 with M2+ = Mg, Ni, Co, crystallize in a completely different structure type: only separated BO3-triangles and practically undistorted MO6-octahedra are present, which form a three-dimensional network. For these phases, a conversion reaction mechanism during lithiation was confirmed by Débart et al.7 Based on their work, a conversion reaction mechanism was also postulated for Cu3B2O6. In situ X-ray patterns in Ref. 7 were only recorded in steps of 1 Li per formula unit. However, some peculiarities of the Cu3B2O6 structure qualify this material also for a possible intercalation system, at least for low degrees of Li-insertion: On one hand, sufficient space is available between the layers, and the average O-O distance of 2.929 Å is sufficient as concluded from the even shorter O-O distance of 2.858 Å in Li0.35CoO2.8 Furthermore, Cu(II) can adopt quite different coordinations due to pronounced Jahn-Teller distortions and can easily transform into Cu(I). Such an intercalation behaviour was initially found in CuS up to an approximate composition LiCuS (Ref. 9), followed by a conversion reaction with the formation of Li2S together with Cu and Cu1.96S. An example for multiple step reaction is copper nitride.4 In the first cycle, intercalation of lithium takes place into open structure of Cu3N, following by the conversion of copper nitride into Cu dispersed in a Li3N matrix.
The aim of this work was to reveal the reaction mechanism of Cu3B2O6 during electrochemical reduction by Li-uptake. For this, in situ synchrotron powder diffraction, quasi in situ XPS and AES, quasi in situ XRD and ex situ SEM investigations were applied. The crystal structure of the overall composition "Li1Cu3B2O6" was studied in detail. Furthermore, the Solid-Electrolyte Interphase (SEI) on the surface of the Cu3B2O6 cathode particles was analyzed for the different electrolyte salts LiFP6 and LiBOB. Finally, the cycle stability was investigated in dependence on the amount of carbon as the conducting additive in the cathode mixture.
Experimental
Synthesis
The copper borate Cu3B2O6 was prepared by a solid-state reaction. Stoichiometric amounts of CuO copper oxide and boric acid H3BO3 were mixed, pressed into pellets, and put into a furnace at 900°C. After 24 h, the material was reground, pressed into pellets and heated for additional 24 h. The obtained green powder was characterized by XRD which confirmed the purity of the Cu3B2O6 phase.6 This phase crystallizes in a triclinic structure with a = 3.3620(3) Å, b = 19.681(2) Å, c = 19.673(2) Å, α = 88.821(6)°, β = 69.703(6)°, γ = 70.063(7)°. The particles size of the active material affects the capacity stability during cycling.10 Hence, one sample was cryomilled (CryoMill, Retsch) at about 77 K for 1 h at vibration frequency of 25 Hz, with carbon black (15% w/w) to reduce the particles size and to coat the particles inherently with carbon for improved electronic conductivity.
Characterization techniques
Electrochemical experiments on the Cu3B2O6 cathodes were controlled by a multichannel potentiostatic-galvanostatic system VMP3 (Perkin-Elmer Instruments, United States) with Swagelok test cells11 at a constant temperature of 25°C. The cathodes were prepared by mixing the Cu3B2O6 powder with super-pure carbon black (Super P Li) as a conducting additive and a polyvinilidene fluoride electrode binder (Solef PVDF 1013) in an 8:1:1 weight ratio. About 15 mg of the mixture were pressed on a 12 mm diameter aluminium mesh (Goodfellow) and dried at 100°C in vacuum for at least 1 h. Anodes were made from a metal lithium foil (Aldrich), and two glass fiber layers were used as separator. Two different electrolytes were used to elucidate their specific impact on the electrochemical behaviour. One was a solution of a 1 M lithium hexafluorophosphate (LiPF6) in a 1:1 mixture of ethylene carbonate (EC) with dimethyl carbonate (DMC) (Novolyte LP-30). The second one was a fluor-free 0.7 M solution of chelated borate anion bis(oxalate)borate (LiBOB) (Ref. 12) in a 1:1 mixture of ethylene carbonate (EC) with ethylmethyl carbonate (EMC). The cells were assembled in a glovebox under argon atmosphere with H2O and O2 contents of less than 1 ppm. Cyclic voltammetry (CV) and galvanostatic cycling with potential limitation (GCPL) were performed within the voltage range from 1.0 to 4.8 V (vs. Li/Li+). The low voltage limit of 1.0 V was chosen to assure that carbon acts only as a conductive agentand to avoid any side reactions at very low cut-off voltages like Li-plating.
X-ray powder diffraction patterns of the Cu3B2O6 pristine material and the cathode mixtures in different states of electrochemical charge were collected with a STOE STADI P diffractometer using Cu- Kα1 radiation (λ = 1.54060 Å).
In situ synchrotron diffraction data were collected at the beamline B2 (Ref. 13) at HASYLAB/DESY (Hamburg, Germany). The radiation wavelength of 0.68842(1) Å was determined from the positions of eight reflections from a LaB6 reference material. For data collection, a high resolution image-plate detector (OBI) was used.14 As battery, a Swagelok-type in situ test cell was used.15
X-ray photoelectron spectra (XPS) were taken with a PHI 5600 CI apparatus (Physical Electronics) equipped with a hemispherical analyzer using monochromatic Al Kα radiation (1486.6 eV). High resolution scans were performed at the Li 1s, B 1s, C 1s, F 1s, O 1s, Cu 2p3/2 and the Cu LMM (Auger transition) binding energy regions. The XP spectra were corrected in binding energy (BE) by using the photoemission lines of carbon (C 1s) at 284.8 eV. Peak assignments were made with respect to the reference compounds metallic Cu, Cu2O with CuO admixture, and B2O3.
Microstructural characterization was performed by means of scanning electron microscopy (SEM) with a Leo 1530 Gemini electron microscope (Zeiss/Leo) equipped with an In-lens detector. The gun acceleration voltage was set to 20 kV.
To obtain reliable results, the XPS and XRD experiments were performed under quasi in situ conditions. For this, the cells were discharged into a specific electrochemical state and disassembled inside the glovebox. The recovered cathode material was washed by DMC (Aldrich) to remove any residual electrolyte traces avoiding any contact with air and moisture during the whole sample handling. For XRD, the sample was sealed between two parts of adhesive tape. For XPS, the specimen was placed on a sample holder and transferred inside a special transport container.16 Five lithiation steps were studied (Fig. 2): (i) Cu3B2O6 cathode-mixture (pristine), (ii) after transfer of 3 Li ions (half-discharged state), (iii) after full discharge to 1 V (with about 6 Li ions transferred), (iv) after recharge to 4.8 V (with about 3 Li ions remaining in the material), and (v) again discharged to 1 V (with 6 Li ions in the material).
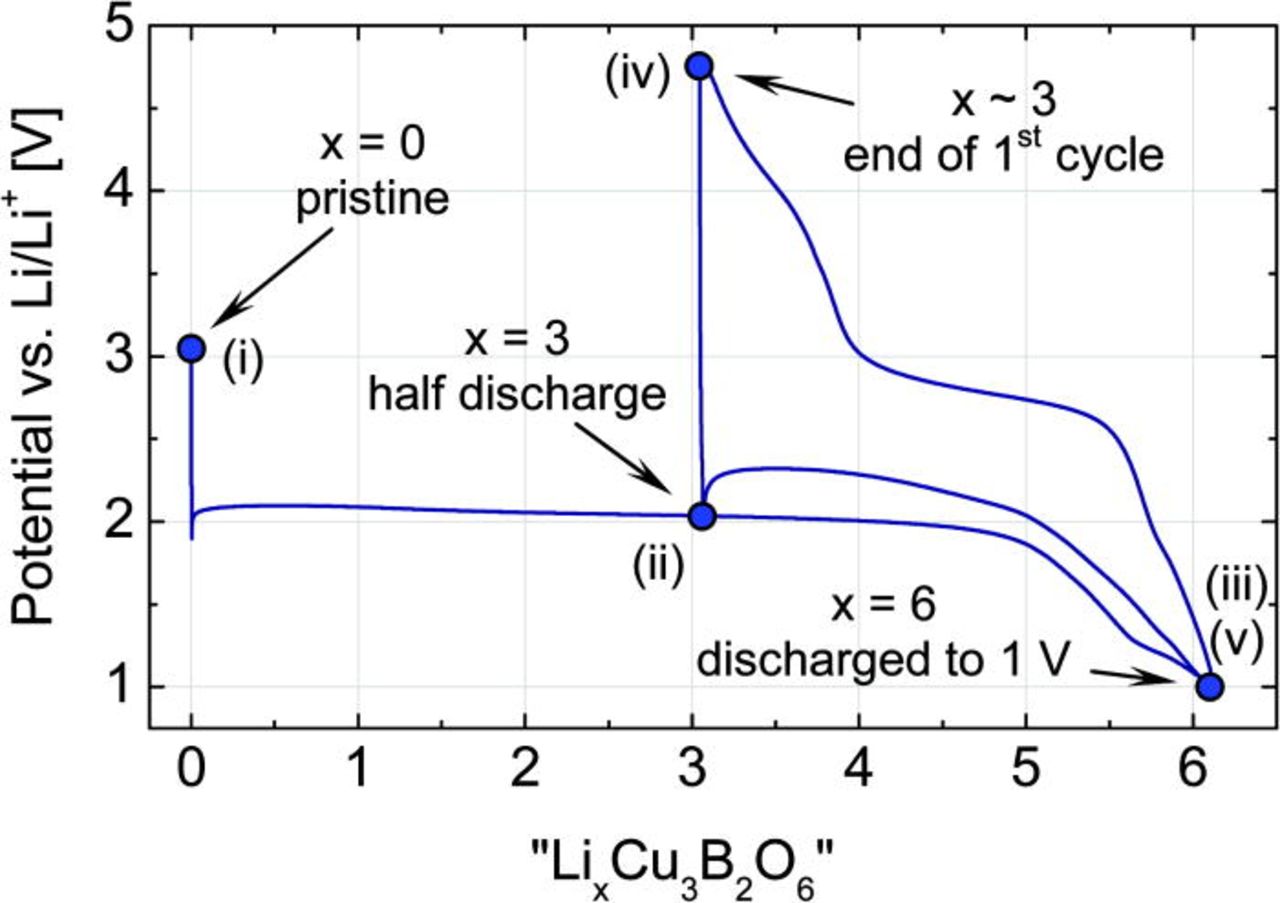
Figure 2. (Color online) Potential-composition profile of the first cycle of a Cu3B2O6 cathode between 1 and 4.8 V at a C/10 rate. The five labeled states were studied by XRD and XPS.
Results and Discussion
Electrochemical characterization of Cu3B2O6 with LiPF6- containing electrolyte
The cyclic voltammetry (CV) scans (Fig. 3) were recorded at a rate of 0.01 mV/s. The first reduction peak is broad, asymmetric and represents rather two peaks at 1.9 and at 1.8V. Such a peak shape could be an indication for lithium insertion into the crystal structure between the layers and copper reduction from Cu(II) to Cu(0) via intermediate Cu(I). The broad symmetric oxidation peak is centered around 2.8 V. During the next cycles, the center of the reduction peak shifts to 2.0 V, while the position of the oxidation peak remains at the same potential level.
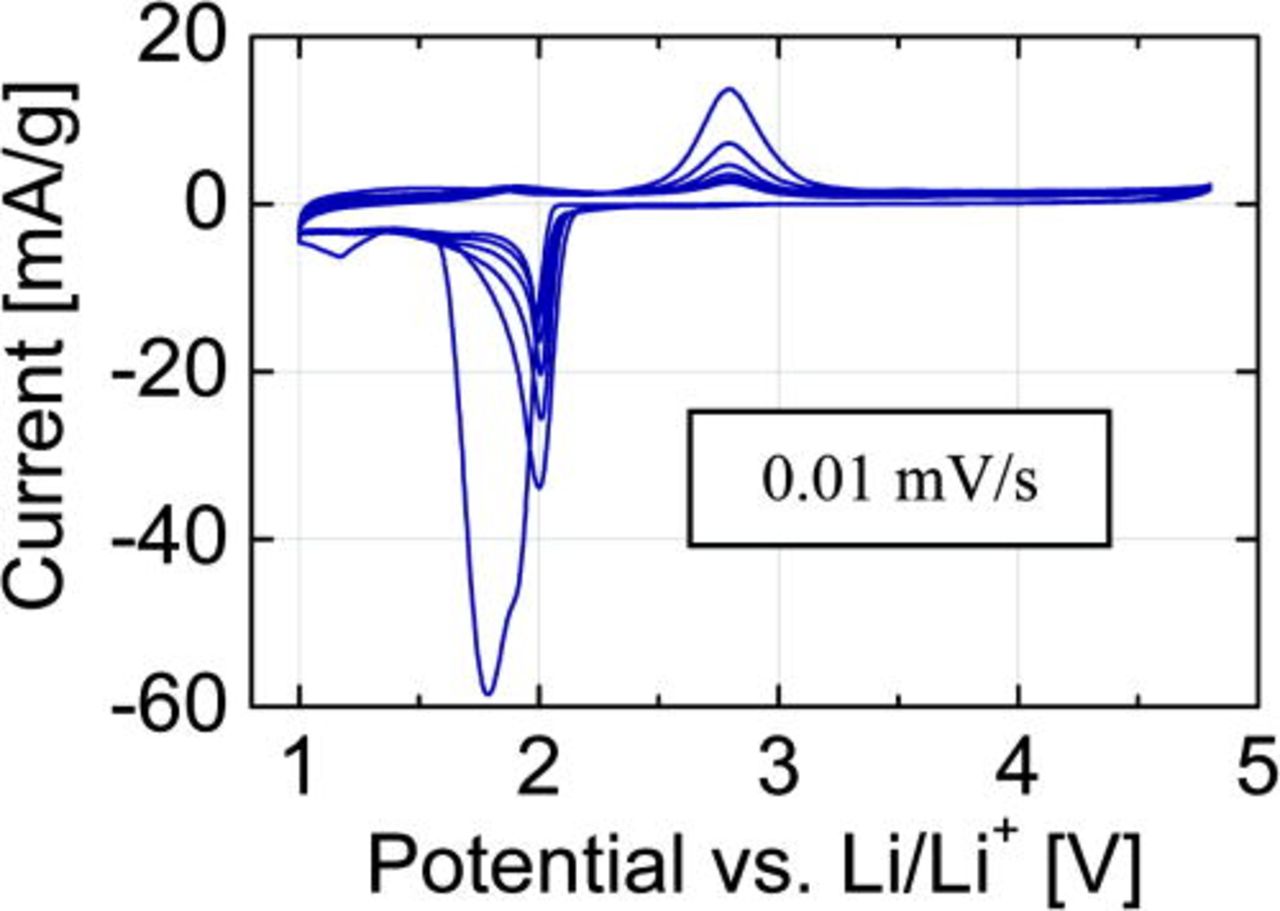
Figure 3. (Color online) CV profile of the Cu3B2O6 cathode material with LiPF6-containing electrolyte, recorded at the rate of 0.01 mV/s.
The GCPL profiles were taken at C/5, C/10 and C/20 rates (Figs. 4a, 4b and 4c), where the 1 C-rate is defined as 1 Li per formula unit exchanged in 1 h. During the first discharging, the reduction process is visible as a long and flat plateau at 2.02, 2.04, and 2.09 V for C/5 (a), C/10 (b) and C/20 (c), respectively. The cryomilled sample with 15% (w/w) carbon content was checked at C/10 rate (Fig. 4d) with the plateau at 2.08 V during discharge.
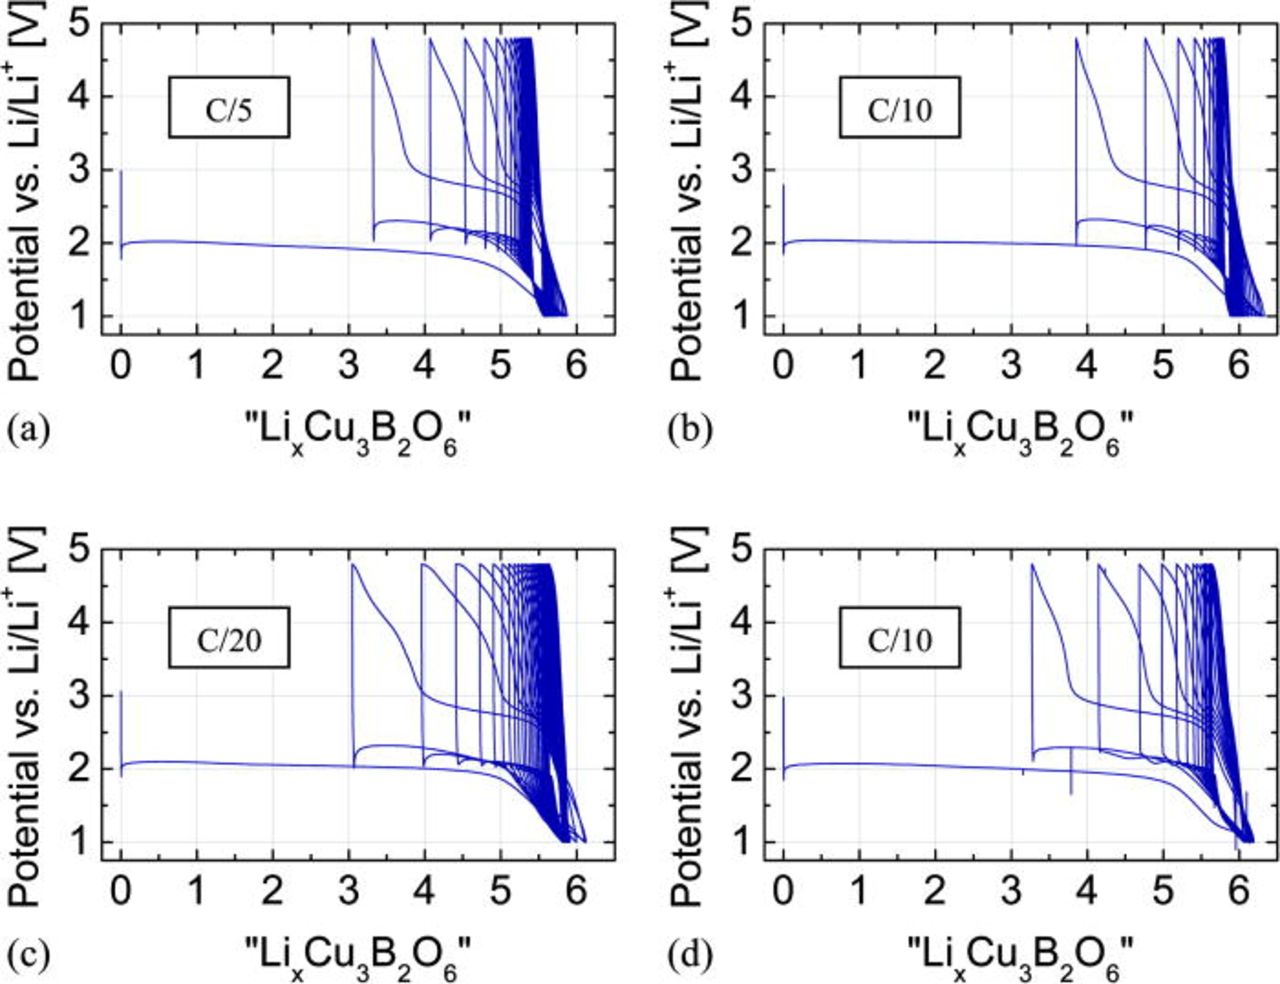
Figure 4. (Color online) Potential profiles of the Cu3B2O6 electrode mixture with LiPF6-containing electrolyte vs. lithium content x, assumed as equivalent to the number of electrons, calculated from charge flow. The profiles were taken using different current rate: (a) C/5; (b) C/10; (c) C/20; (d) C/10 – the cryomilled sample with 15% (w/w) carbon content.
The full reduction of copper from Cu(II) to the metal form Cu(0) requires six lithium ions per formula unit, corresponding to the discharge capacity of 522 mA/g. At 1 V, all measured test cells showed values close to this theoretical one, 5.9 for C/5, 6.3 for C/10, and 6.1 for C/20. The achieved capacities after the initial discharge are: 510, 550, and 532 mAh/g, respectively. The first successive charge capacity corresponds to about three extracted Li-ions, or ∼260 mA/g. This value points to an oxidation of copper from Cu(0) to Cu(I). The lower discharge capacities in subsequent cycles indicate a pronounced fatigue of this electrode material (Fig. 9).
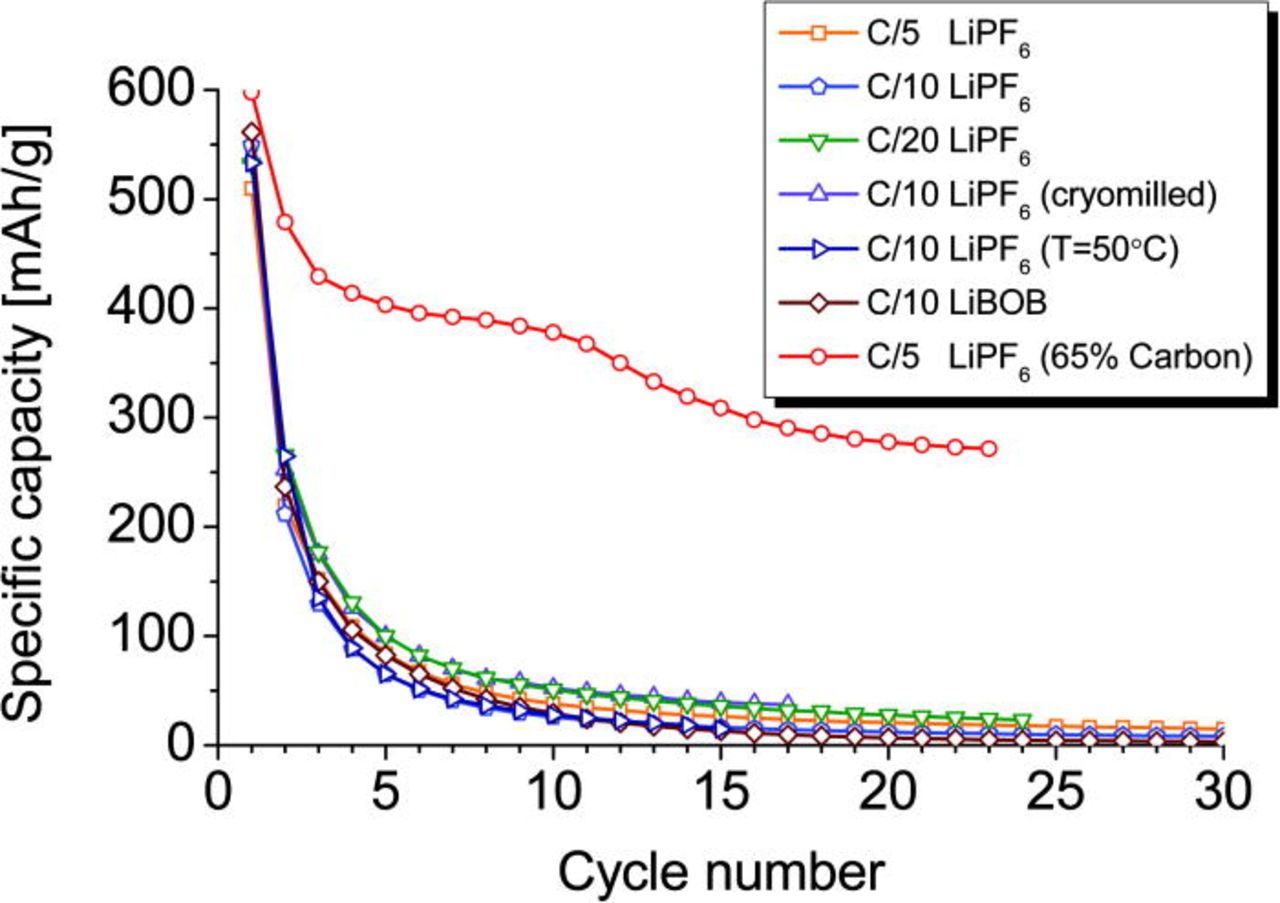
Figure 9. (Color online) Discharge capacity vs. number of cycles. LiPF6- and LiBOB-containing electrolytes were used for comparison. Different charge rates and operation temperatures were also applied. Data for a very carbon-rich electrode mixture are also included.
Electrochemical characterization of Cu3B2O6 with LiBOB- containing electrolyte
The electrochemical behaviour of the Cu3B2O6-based electrode mixture was also tested with the fluor-free electrolyte salt LiBOB. The CV profile (Fig. 5) in the first cycle shows a very broad asymmetric reduction peak with a maximum around 1.8 V. The oxidation peak is again observed at 2.8 V as in the previous case with the LiPF6–containing electrolyte. In the second cycle, the reduction peak is much less pronounced and shifted to 2.0 V.
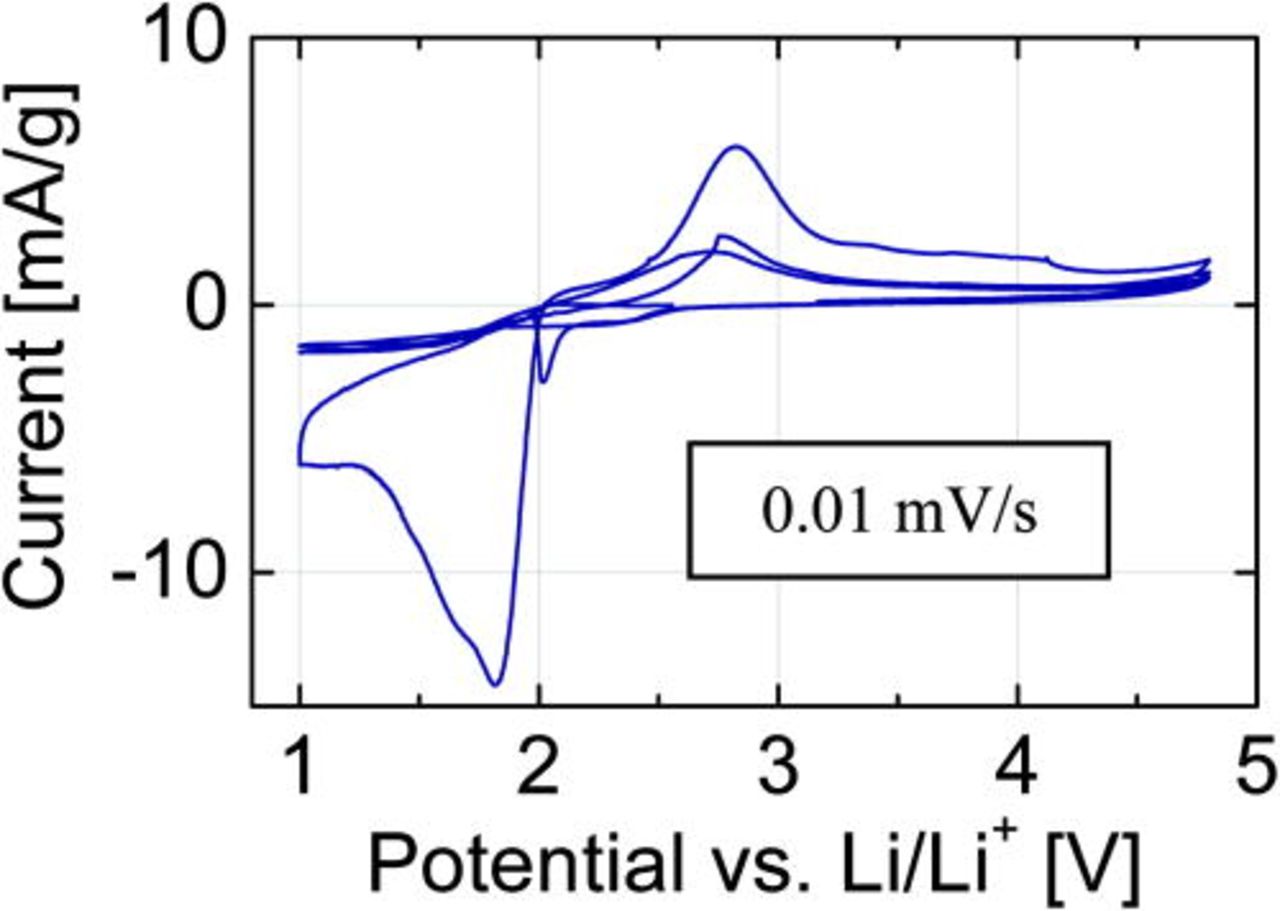
Figure 5. (Color online) As in Fig. 3 but for a LiBOB-containing electrolyte.
Galvanostatic cycling was performed at the rate of C/10, and the potential profile is shown in Fig. 6. During the first discharge, the reduction process is reflected in a broad plateau at 2.06 V. The oxidation processes show again S-shaped profiles, except in the high potential region (> 4.5 V), where a characteristic "valley" shape appears. This behaviour is probably caused by the instability of the LiBOB-containing electrolyte at such high potentials.
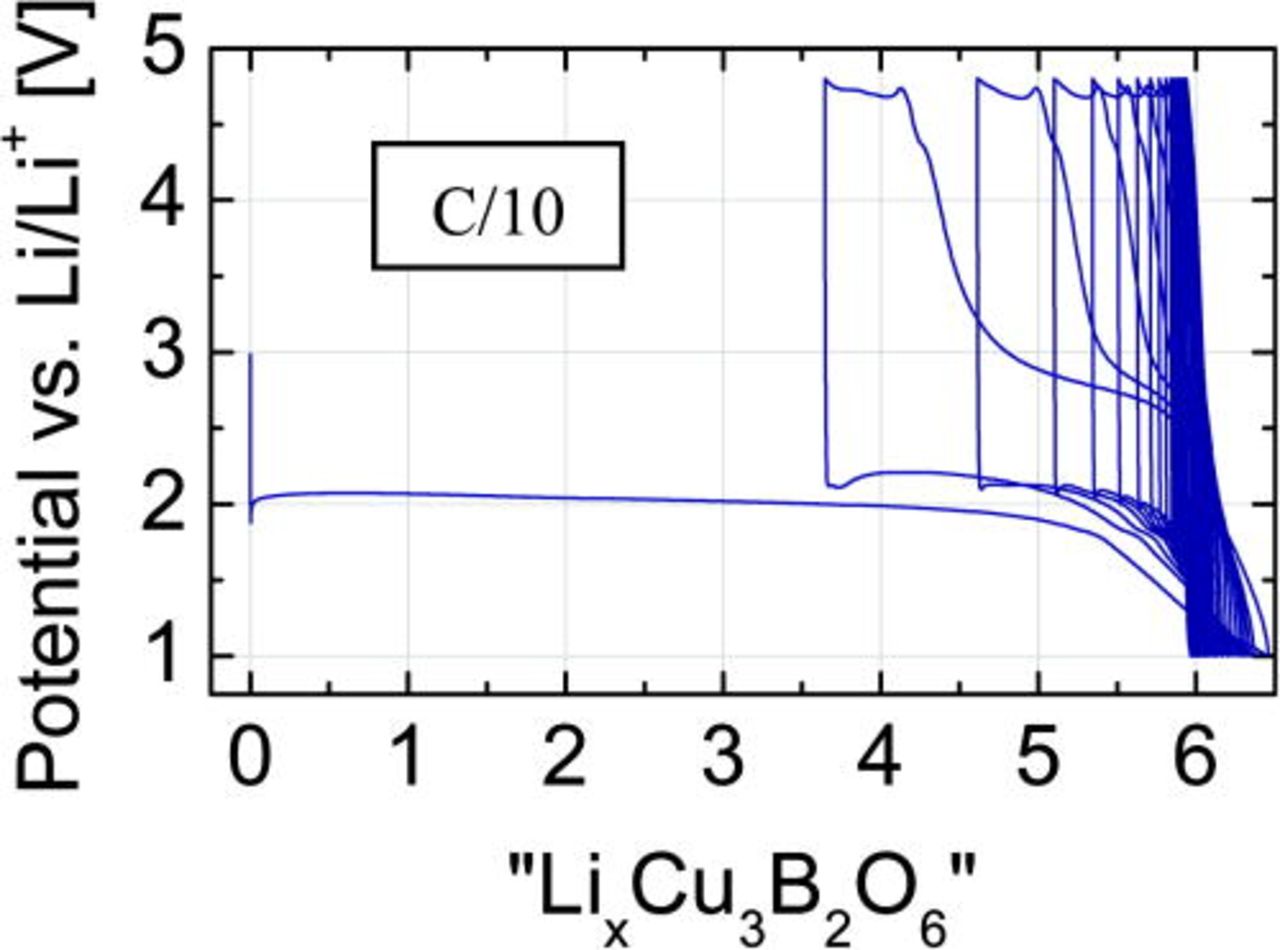
Figure 6. (Color online) Same as Fig. 4b but for a LiBOB-containing electrolyte.
The initial discharge capacity is 561 mAh/g, what corresponds to 6.4 Li-ions per formula unit. This process is again not fully reversible with strong capacity fading (Fig. 9).
For further analyses, only material cycled with the LiPF6-containing electrolyte was used.
Mainly two effects can contribute to the observed fast capacity fading: either a low electronic and/or ionic conductivity as result of structural degradation and contact loss. To improve the electronic conductivity, even in the case of a complicated microstructure on the length scale of a few nanometers, the amount of carbon black was significantly increased up to 65% (w/w).
The effect of enhanced Li-ion mobility on the electrochemical performance was checked by thermal activation at elevated temperature. Therefore, one test cell was operated at 50°C.
Electrochemical characterization of a carbon rich Cu3B2O6 cathode mixture
The GCPL experiment of the cathode mixture with considerably increased carbon content was performed with C/5current rate. The cycle stability was significantly improved, see Fig. 7. Another evident feature is the shift of the potential loops to "negative" numbers of the Li-content x. These negative values are a consequence of the assumption, that each electron flown through the electric circuit corresponds to one Li-ion transport through the electrolyte. The shift of the loops to the left reflects electrons, which do not correspond to Li-ion transport and, therefore, indicates pronounced side reactions, which "consume" electrons like the oxidation of the electrolyte.
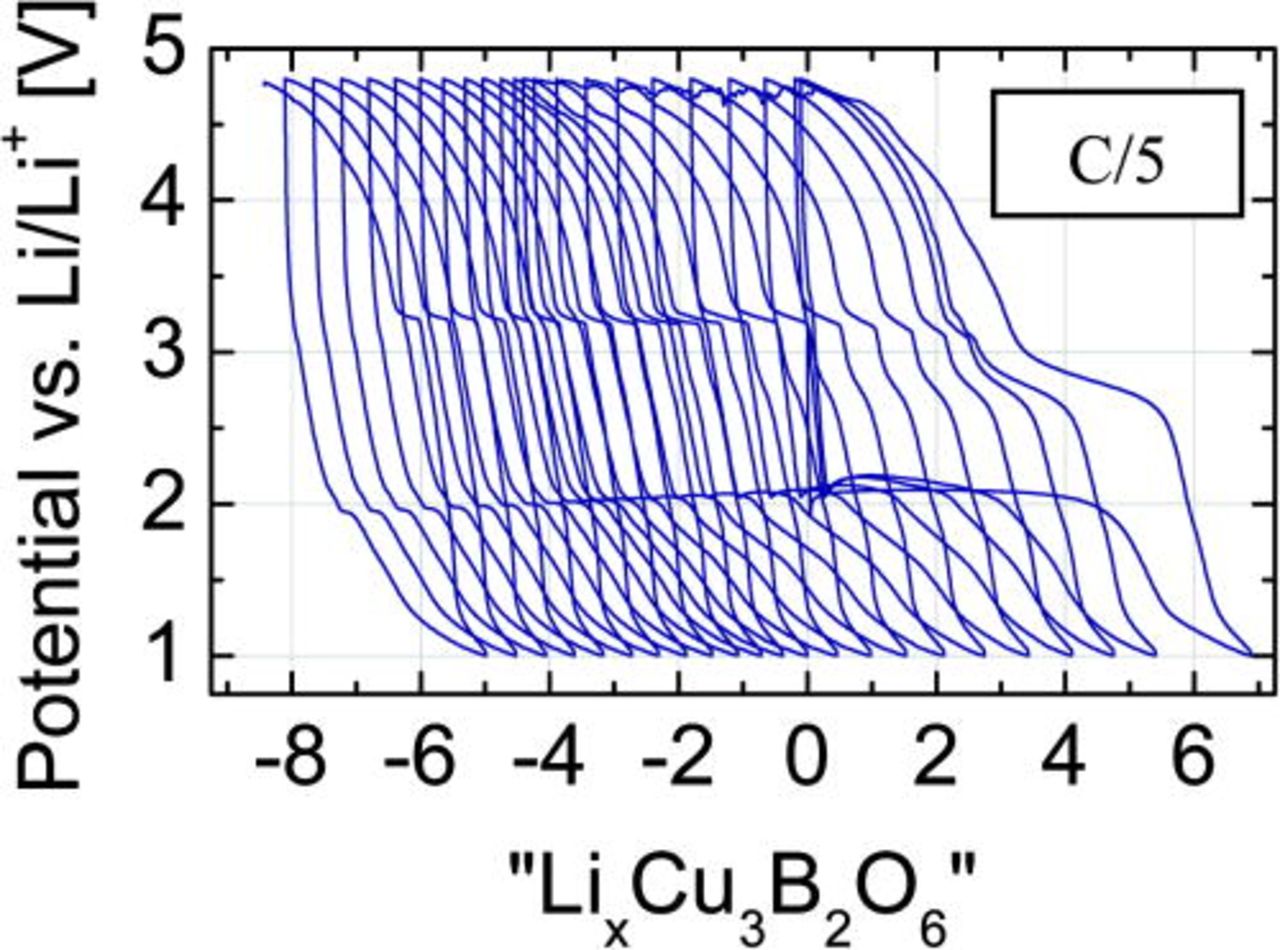
Figure 7. (Color online) Like in Fig. 4a but for the very carbon-rich Cu3B2O6 electrode (65% w/w) with LiPF6-containing electrolyte.
Electrochemical characterization of Cu3B2O6 at elevated temperature
The galvanostatic cycling behaviour at 50°C is shown in Fig. 8 and similar to the one at 25°C, see Fig. 4b.
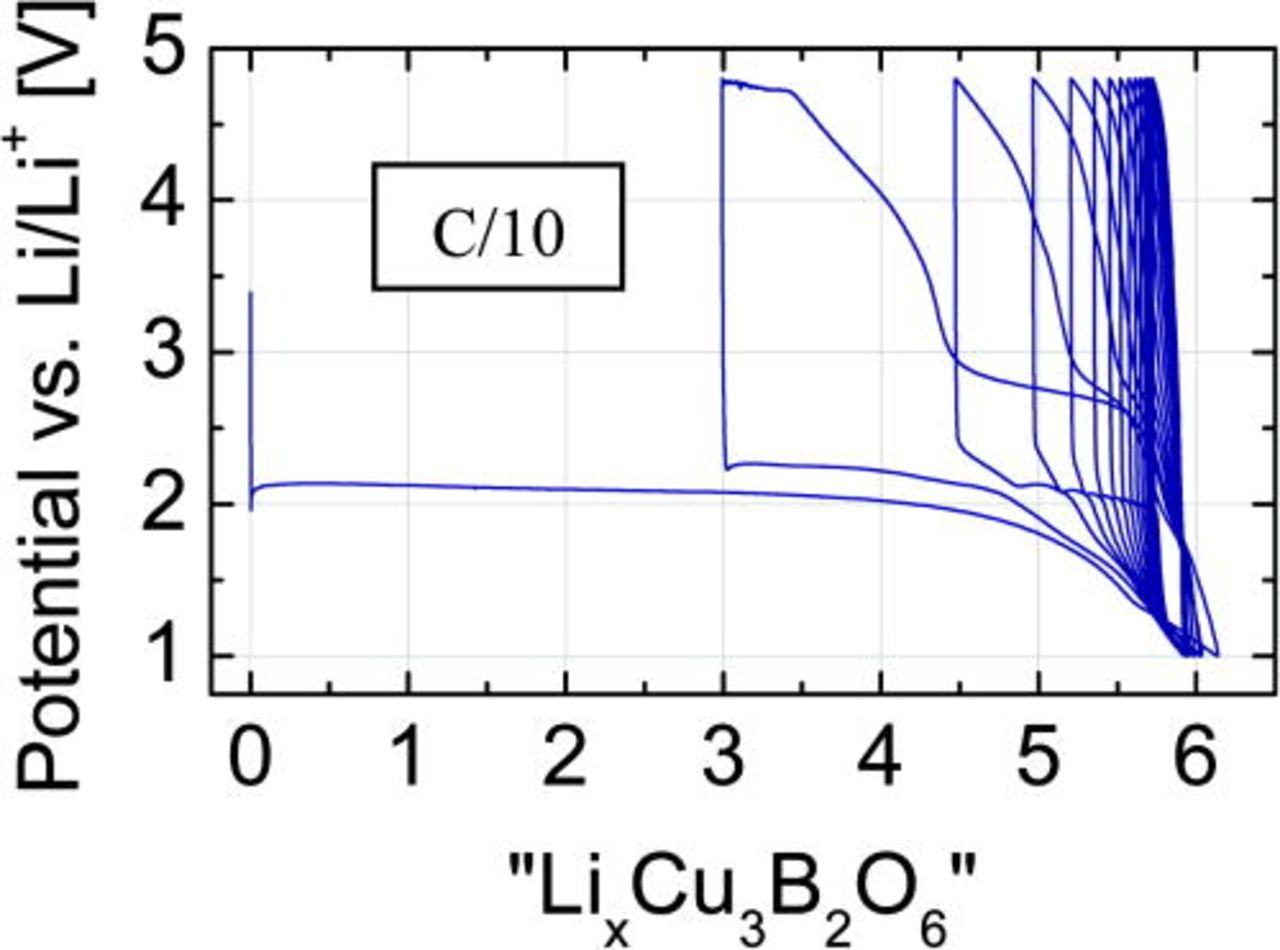
Figure 8. (Color online) Same like Fig. 4b but the profile was taken at the elevated operation temperature of 50°C.
The change in the current flow rate, the cryomilling with up to 15% w/w increased carbon content, the use of an alternative Li- containing salt in the electrolyte and an elevated operation temperature do not affect the capacity fading significantly, as it is shown in Fig.9. However, the use of a very carbon-rich electrode mixture improves the cycle stability dramatically. This reveals that a too low electronic conductivity in the induced state after initial Li-uptake is the main limitation for a good performance of a Cu3B2O6-based electrode.
The relevant mechanisms are further elucidated by structural investigations and analyses of the Solid-Electrolyte Interphase (SEI).
Structural investigations of phase transformations during discharge and successive charge
Structural features of the cathode materials in different states of charge were investigated by a quasi in situ XRD method. The corresponding XRD patterns are shown in Fig. 10.
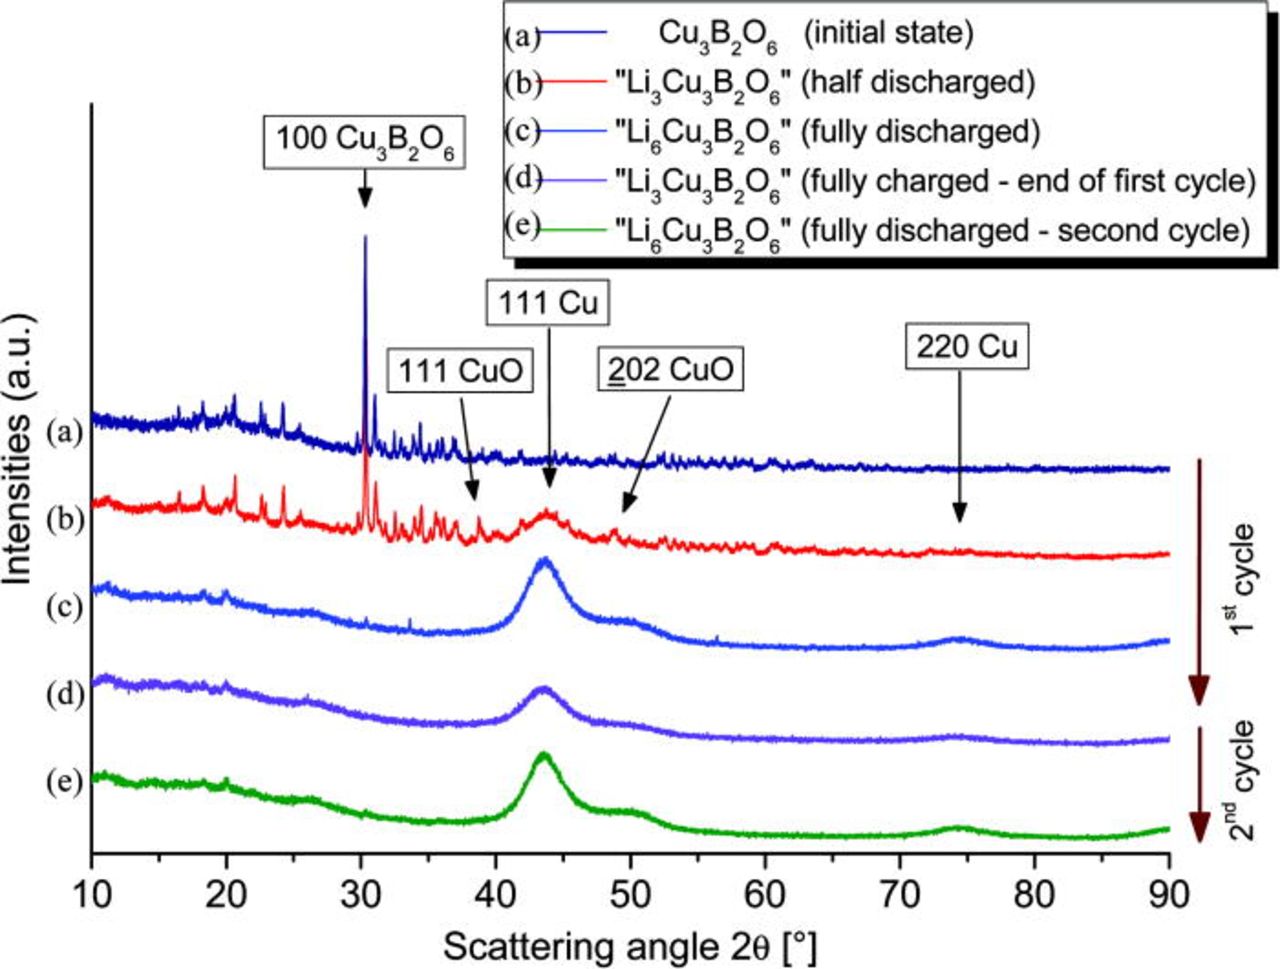
Figure 10. (Color online) Quasi in situ XRD measurements performed on the Cu3B2O6-based cathode in different states of charge. The initial copper borate structure irreversibly decomposes to nanosized copper through the intermediate copper oxide phase CuO.
The initial state shows reflections only from the Cu3B2O6 phase. After a transfer of 3 Li-ions per formula unit additional reflections from CuO, Cu2O and broad reflections from metallic Cu are also observed. A volume-weighted average diameter of 16 Å for the metallic Cu crystallites is calculated from the half widths of the reflections. In the fully discharged sample (6 Li-ions per formula unit), the Cu3B2O6, CuO, and Cu2O phases were completely decomposed, and only broad reflections from metallic Cu remain, again with an average cluster size of about 16 Å.
The presence of the copper oxides can confirm either a partial lithium intercalation mechanism as well as a decomposition of the copper borate via intermediate phases. In the case of lithium intercalation, a formation of "LixCu3B2O6" with Cu in the oxidation state between Cu(II) and Cu(I) is expected. When the copper borate phase decomposes during the lithiation, fragments of CuxOy emerge with Cu oxidation states less than Cu(II).
The next diffraction pattern was taken at the end of the first electrochemical cycle. About three lithium ions remained in the recharged cathode material. None of the previously decomposed phases appeared again. Only the very broad reflections from metallic copper remain, but with lower peak intensity in comparison to the background level. The XRD pattern of the once more discharged sample is similar to the previous one. This confirms that after the initial degradation of the crystalline Cu3B2O6, further cycling proceeds without a significant role of crystalline phases. In all investigated samples, no reflections from Li2O or lithium borates were detected.
Ex situ SEM studies on "LixCu3B2O6"
The Li-exchange driven morphological changes in "LixCu3B2O6" were investigated by scanning electron microscopy (SEM). The test cells were charged to a specific desired electrochemical state. Then, the cathode mixture was recovered, washed by DMC in the glovebox and transferred into the electron microscope.
Images of the initial state of Cu3B2O6 prepared by the solid-state reaction show particle sizes between 3–10 μm (Fig. 11a). One hour of cryomilling reduces the size to 1–3 μm (Fig. 11b). Milling at room temperature caused decomposition of the material into simple oxides.
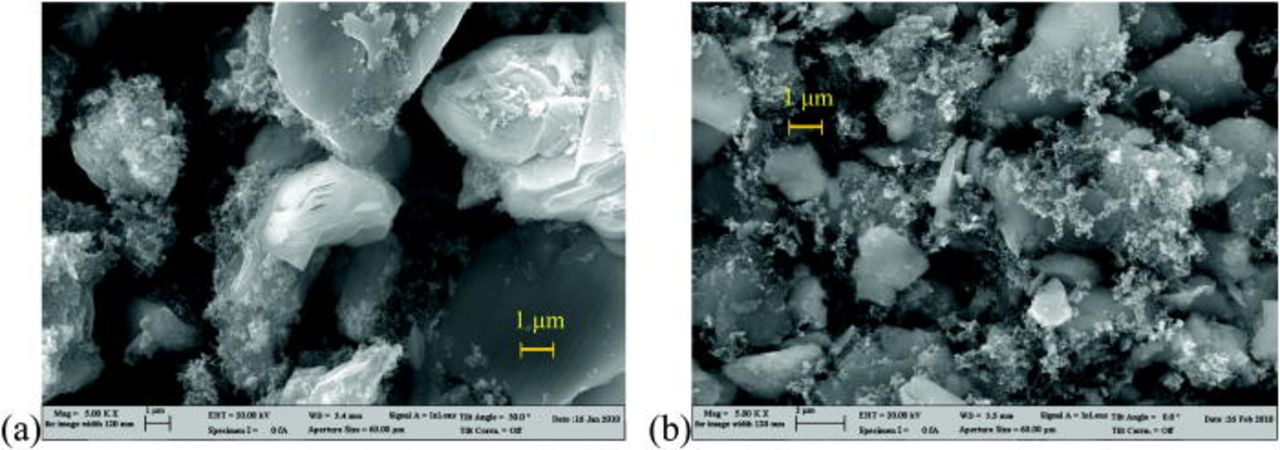
Figure 11. (Color online) SEM image of the: a) Cu3B2O6 cathode mixture, b) cryomilled and carbon-covered Cu3B2O6.
The initial material has a layered structure, see Fig. 12a, with a thickness of the layers of about 5–10 nm. This thickness increases during cycling: in the half discharged material to about 40–50 nm (Fig. 12b) and in the completely discharged (down to 1 V) material to about 200 nm (Fig. 12c). This layered microstructure is a characteristic feature of the Cu3B2O6 material. The thickness reflects the degree of decomposition of the Cu3B2O6 crystal structure and the formation of a glass-like state of the cathode material.
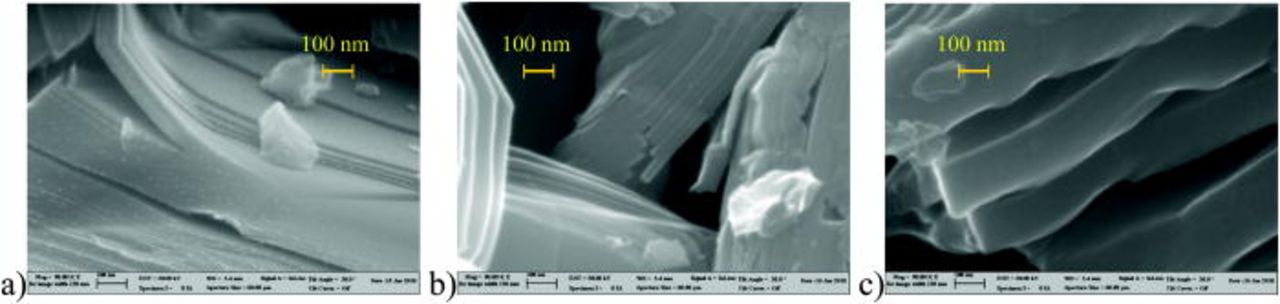
Figure 12. (Color online) SEM images in identical scale of "LixCu3B2O6" cathode material in different states of charge: a) initial state: a layered structure of the particles is clearly visible (about 5 layers in 100 nm); b) half discharged state, with 3 Li per formula unit: the thickness of the layers has increased to about 50 nm; c) discharged state with 6 Li per formula unit: a further increase of the thickness of the layers is observed (above 100 nm).
The layered crystal and microstructure of Cu3B2O6 can allow intercalation and extraction of Li-ions, at least in the early stage of cycling. In situ synchrotron diffraction was performed to detect even subtle structural changes in the crystal structure of "LixCu3B2O6". Any Li-insertion would mainly affect the lattice parameters.
In situ structural investigation by synchrotron diffraction
A possible Li-intercalation mechanism into Cu3B2O6 was investigated by high resolution in situ synchrotron diffraction. Therefore, an insitu test cell was discharged in galvanostatic mode at the rate of C/10, until an approximated composition of "Li1Cu3B2O6" was reached. The analysis of the patterns did not reveal any significant changes in the copper borate structure. The unit cell parameters remain constant within experimental uncertainties, quantified by the estimated standard deviations from Rietveld refinements and shown in Fig. 13 as error bars.
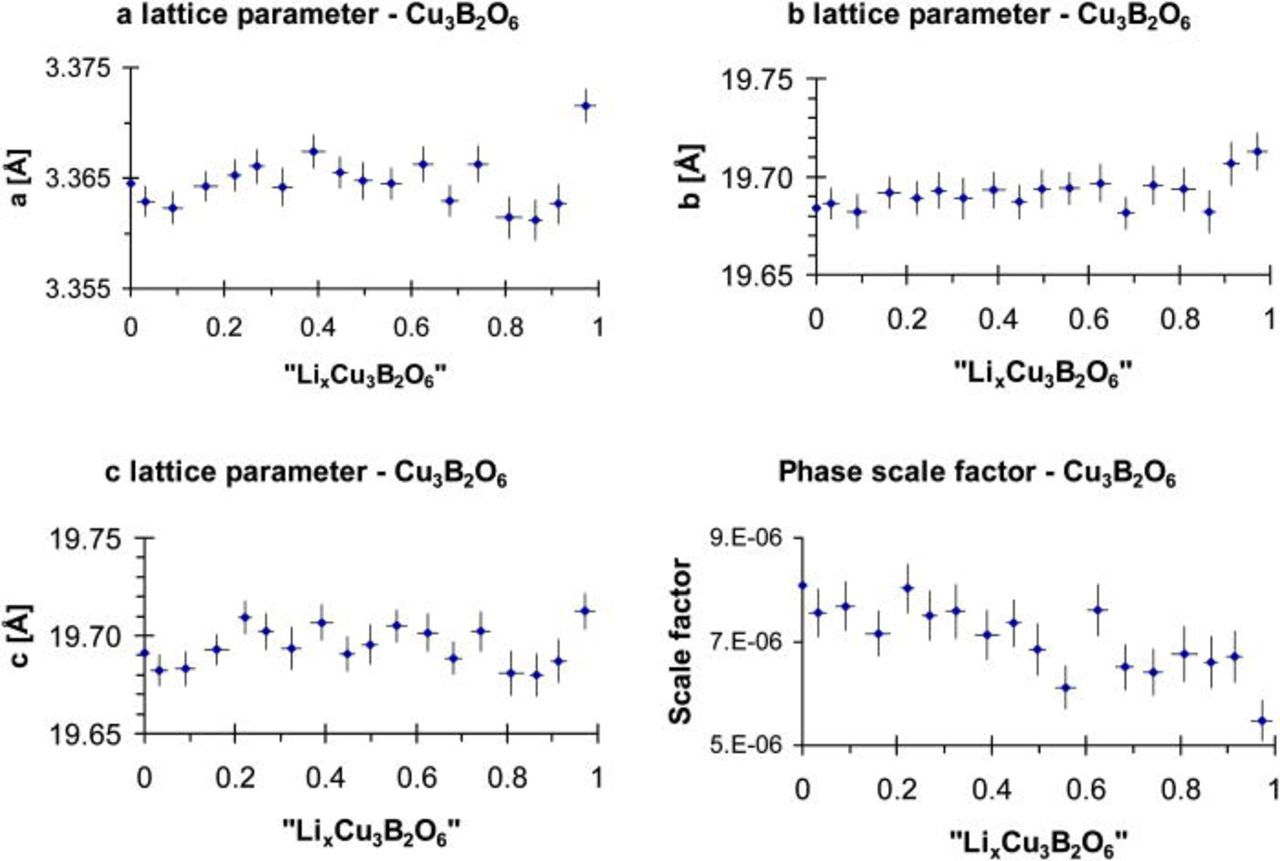
Figure 13. (Color online) The unit cell parameters and the scale factor of "LixCu3B2O6" during reaction up to x = 1, calculated from the in situ synchrotron diffraction patterns.
In situ synchrotron diffraction does not give any evidence for a Li-intercalation mechanism in "LixCu3B2O6", but the relative amount of crystalline Cu3B2O6 decreases during the electrochemical reduction. In order to reveal the charge compensation mechanism and to detect the formation of interface layers on the electrode particles, both X-ray photoelectron and Auger-electron spectroscopy were applied.
XPS
To investigate the behaviour of Cu3B2O6 in electrochemical test cells with both LiPF6- or LiBOB-containing electrolytes, four samples were studied by XPS for each electrolyte: (i) pristine Cu3B2O6 cathode mixture, (ii) material after reaction with 3 Li per f.u. (half-discharge state), (iii) after full discharge down to 1 V, corresponding to a reaction with about 6 Li per f.u., (iv) after recharging to 4.8 V (end of 1st cycle) (Fig. 9).
Cu 2p and Cu LMM spectra
For the pristine Cu3B2O6 material, the Cu 2p3/2 core peaks are observed (Figs. 14b and 14c) at 936.3 eV and assigned to Cu(II). Satellite peak (shake-up) suggests ligand-to-metal charge-transfer (LMCT) during the photoemission process. The intensity ratio of the satellite peak to the main peak and the energy separation of about 8 eV between these two peaks are similar to what was observed for the CuO reference material (Fig. 14a). This suggests that the oxygen environment of the Cu(II) in Cu3B2O6 is rather identical to the one in CuO. The observed shift of 3.5 eV towards higher energy for Cu3B2O6 can be explained by the different Cu-O bond lengths (1.88–2.42 Å), caused by the presence of boron atoms in the structure, and Jahn-Teller distortion of the CuO6-octahedra in Cu3B2O6 in comparison with the CuO4-squares with the Cu-O distances of 1.94–1.97 Å in CuO.17 Figs. 15b and 15c show a broad Auger Cu LMM peak at 571.8 eV, which is attributed to Cu(II). It is also shifted by about 2 eV in comparison to the CuO/Cu2O reference material (Fig. 15a).
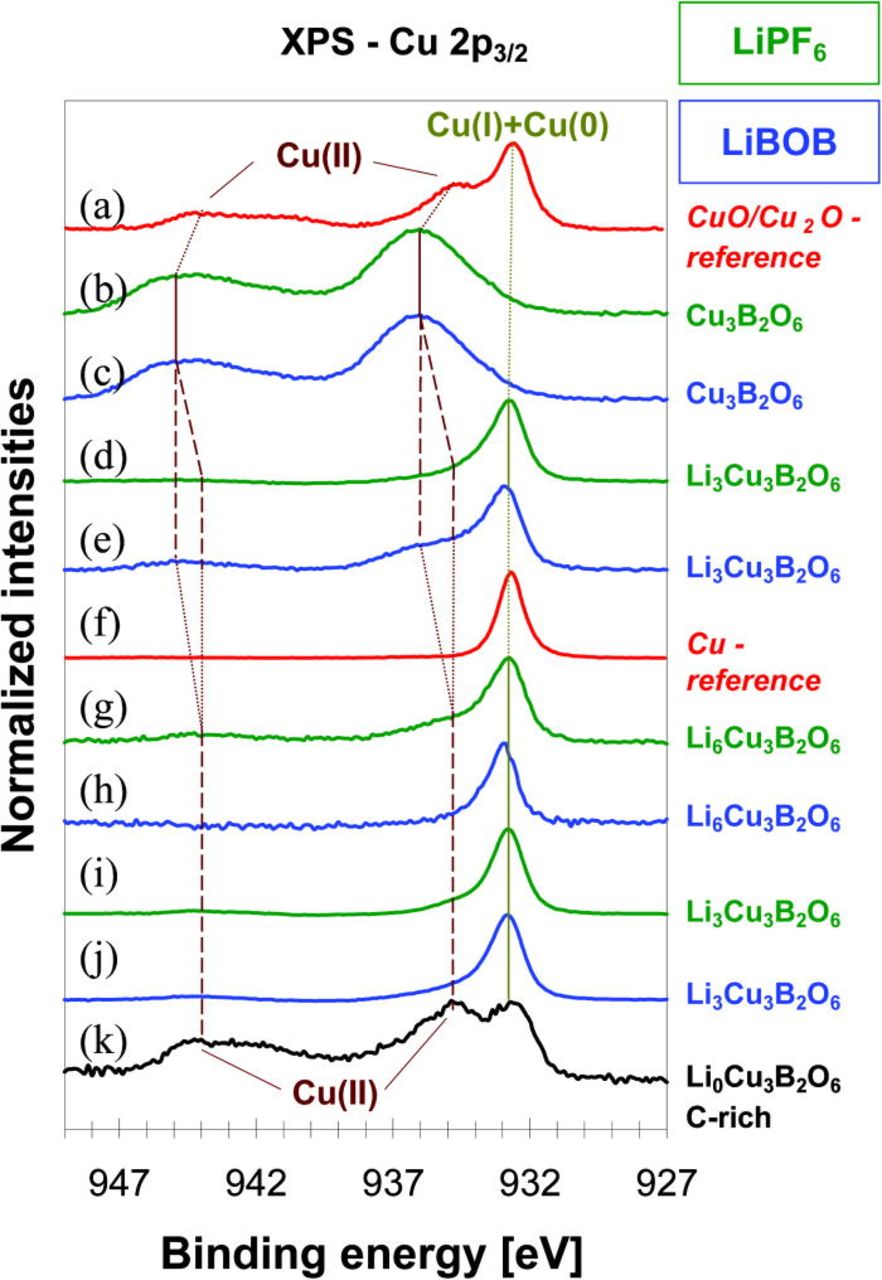
Figure 14. (Color online) XP spectra of Cu 2p3/2 region (from top to bottom): (a) a mixture of Cu2O and CuO as reference materials; (b) and (c) Cu3B2O6 pristine material; (d) and (e) "Li3Cu3B2O6"; (f) metallic Cu as a reference material; (g) and (h) "Li6Cu3B2O6" after discharge to 1 V; (i) and (j) "LixCu3B2O6" with x ∼ 3 after recharging to 4.8 V, which corresponds to the end of the first cycle, (k) "LixCu3B2O6" after the first cycle for the cathode mixture enriched by conducting carbon black (x ∼ 0).
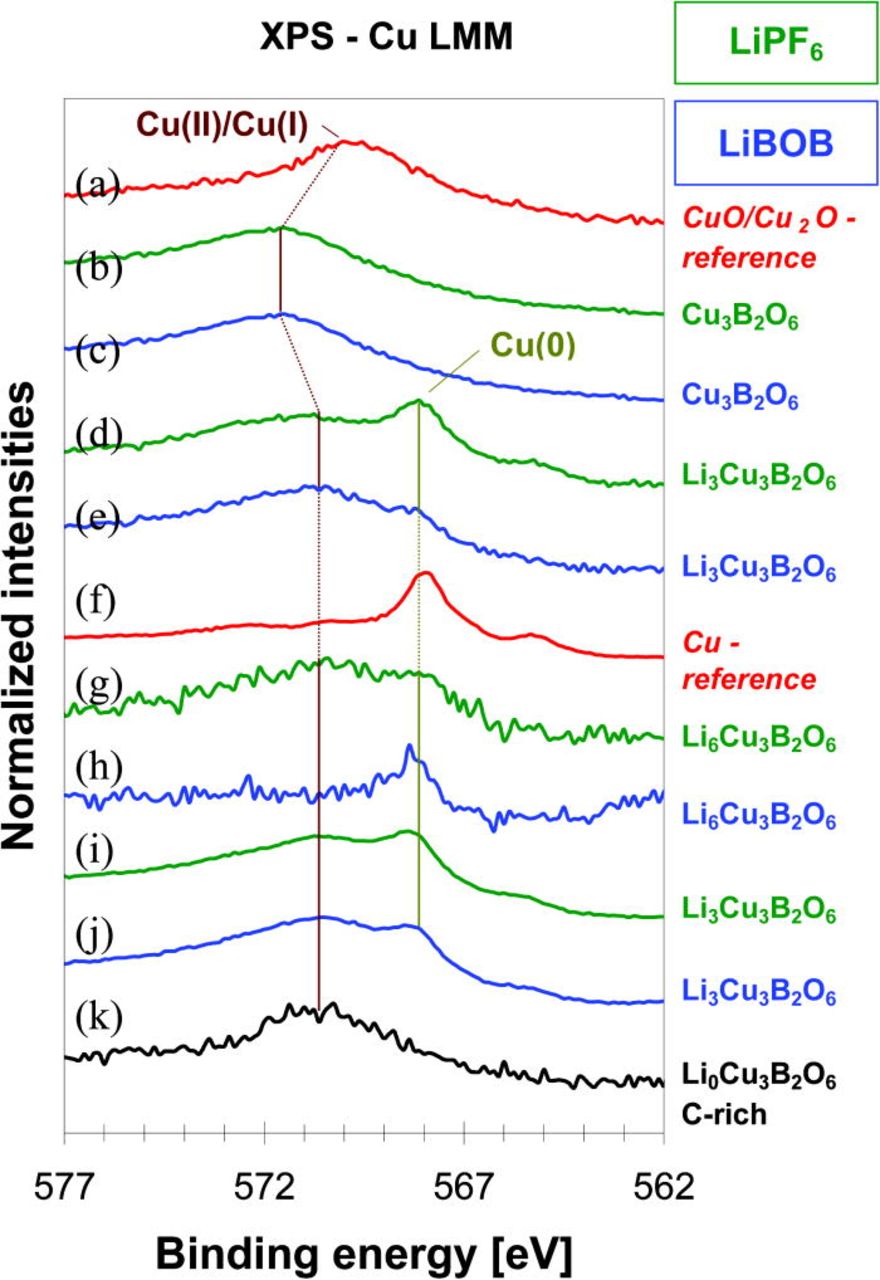
Figure 15. (Color online) Auger-electron spectra of Cu LMM region (from top to bottom): (a) a mixture of Cu2O and CuO as reference materials; (b) and (c) Cu3B2O6 pristine material; (d) and (e) "Li3Cu3B2O6"; (f) metallic Cu as a reference material; (g) and (h) "Li6Cu3B2O6" after discharge to 1 V; (i) and (j) "LixCu3B2O6" with x ∼ 3 after recharging to 4.8 V, which corresponds to the end of the first cycle, (k) "LixCu3B2O6" after the first cycle for the cathode mixture enriched by conducting carbon black (x ∼ 0).
Reaction with 3 Li ions per f.u. causes a strong fading of the Cu(II)-component in the Cu 2p3/2 region for the materials in both LiPF6− and LiBOB-containing electrolytes. Only one sharp peak is observed at 932.8 eV (Figs. 14d and 14e) for the material, operated with the LiPF6–containing electrolyte, which can be attributed either to Cu(I) or Cu(0). The peak at this position is present in the Cu (Fig.14f) and the Cu2O (Fig. 14a) reference spectra. For the material in contact with the LiBOB-containing electrolyte, a shoulder at 936 eV points to the additional presence of a small amount of Cu(II). The difference between Cu(0) and Cu(I) is visible in Auger Cu LMM spectra. Metallic copper has a sharp intense peak at 568.3 eV (Fig. 15f), while Cu2O has a broad peak at 570.8 eV (Fig. 15a). The "Li3Cu3B2O6" material with the LiPF6–containing electrolyte shows rather the signature of a mixture of Cu(I)/Cu(0), whereas "Li3Cu3B2O6" with LiBOB rather exhibits a mixture of Cu(II)/Cu(I).
After complete discharge to 1 V, the Cu 2p3/2 peak is observed at 932.8 eV (Figs. 14g and 14h) for both materials. A sharp Cu LMM Auger peak at 568.3 eV (Figs. 15g and 15h) is observed for "Li6Cu3B2O6" (LiBOB), clearly showing the existence of copper in the metallic Cu(0) form (Figs. 14 and 15f). For "Li6Cu3B2O6" (LiPF6), a mixture of Cu(I)/Cu(0) could rather be suggested.
Charging to 4.8 V led only to extraction of about 3 Li per f.u. for both electrolytes. The spectra are similar to that obtained after reaction with 3 Li per f.u. during the discharge. Cu 2p3/2 (Figs. 14i and 14j) and Auger Cu LMM peaks (Figs. 15i and 15j) show that copper exists in Cu(I) and partially in Cu(0) states. There is no indication for any Cu(II).
However, in the cathode mixture with an increased carbon content of 65% (w/w), the Cu(II) oxidation state was reached again at the end of the first cycle. This means, that the observed restriction of the oxidation of Cu(0) to Cu(I) during the first recharge with an accompanied loss of charge capacity of 50% of the theoretical value is not an intrinsic limitation of Cu3B2O6, but a consequence of the poor electronic conductivity as a consequence of the structural degradation during the conversion reaction for electrode mixtures with the "normal" carbon content of not more than 15% (w/w).
F 1s spectra
After cycling, the solid-electrolyte interphase (SEI) on converted "LixCu3B2O6" particles contained a significant amount of LiF. A mixed electronic state of fluorine is observed as two peaks in the F 1s core energy level region (Fig. 16) after the 1st and 30th cycle. One peak at 687 eV corresponds to fluorine present in the electrode binder PVDF, and the second one at 685.5 eV corresponds to the formation of LiF. The increasing intensity of the latter with cycle number indicates an ongoing formation of LiF.
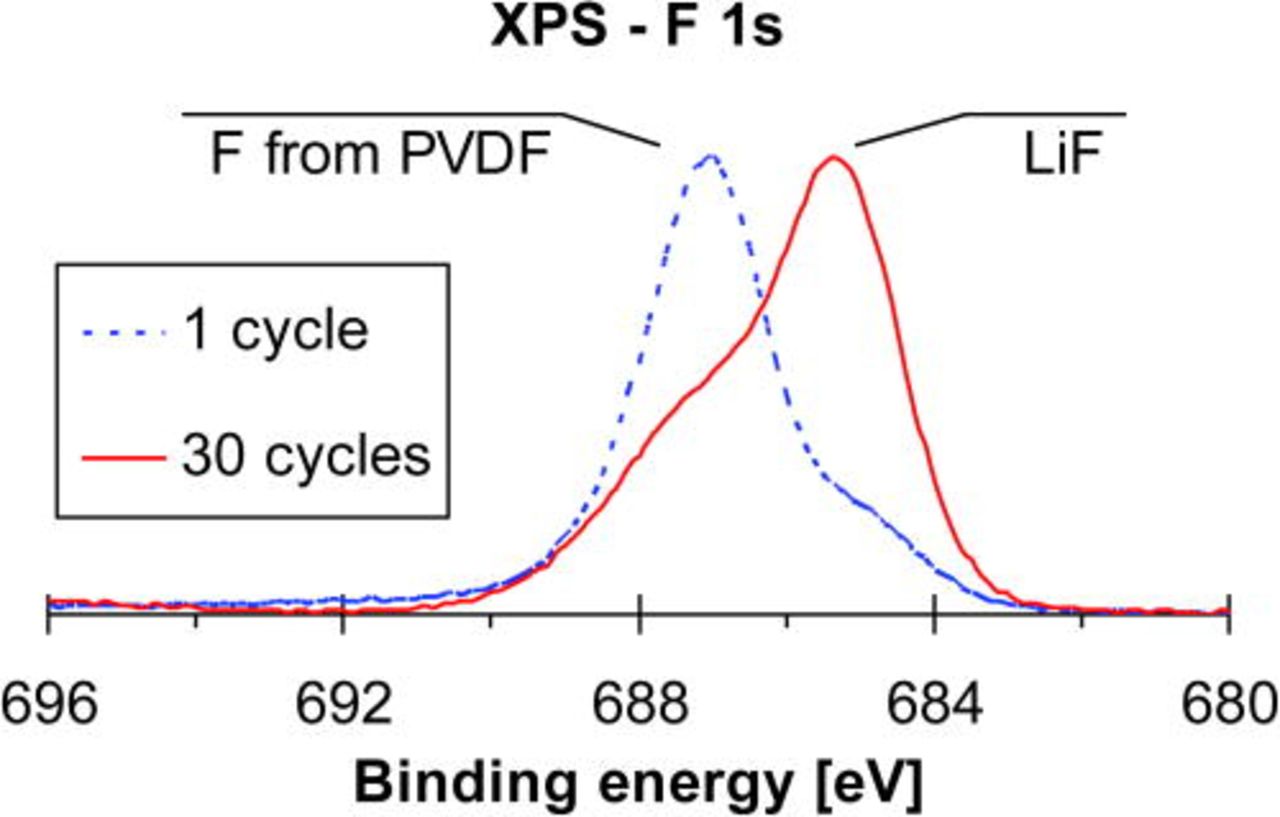
Figure 16. (Color online) XP spectra of the F 1s region in "LixCu3B2O6" after the first cycle and after 30 cycles.
In recent years, several types of materials suitable as conversion electrodes have been developed. Transition metal formates18 exhibit good rate performance at level 560 mAh/g up to 60 cycles with slow cycling rate C/10. However, in contrast to copper borate, reaction potential level varies during cycling. Another approach, suitable for negative electrode, is to use nanoribbons oxalates.2 The reversible capacities are of about 900 mAh/g with good capacity retention at high cycling rates. Already mentioned copper nitride4 with the initial multiple step reaction, shows good cycling performance at level 300 mAh/g. Similar to copper borate a significant capacity loss after first cycle was observed. This cycling performance drop, related to capacity loss in copper borate due to strong LiF formation, is similar to the one observed in bismuth fluoride nanocomposites,3 where a lithium fluoride matrix was formed.
Conclusions
By combining various experimental techniques, a conversion mechanism was confirmed for the Cu3B2O6 cathode material during electrochemical Li addition, which is mainly reversible during Li extraction if appropriate measures guarantee sufficient electronic conductivity in the converted state. The electrochemical characterization with complementary techniques revealed that the initial copper oxidation state Cu(II) changes to Cu(0) after the first discharge with the formation of Cu-metal clusters. About 6 Li per f.u. can be initially transferred into the material. During the subsequent charging cycles, the copper oxidation state changes only back to Cu(I), but not to Cu(II). This causes a strong capacity drop after the first cycle. An increase of the operation temperature of the electrochemical test cell up to 50°C did not lead to better capacity retention. However, with enhanced electronic conductivity in a carbon-rich cathode mixture, the reversibility is significantly improved and allows to reach the Cu(II) state again during charging. The further capacity loss is caused by the growth of passivation layers on the converted particles, which consist mainly of LiF, independent on the Li-containing salt LiPF6 or LiBOB in the electrolyte. Although a high carbon additive improves reversibility, it reduces the overall cathode capacity. This limits the usage of such mixture and it should be optimized for applications.
In situ synchrotron diffraction shows that despite a layered crystal structure, no intercalation mechanism takes place, not even in the initial stage of Li transfer into Cu3B2O6. The main challenge for the use of Cu3B2O6 as a conversion electrode in a Li-ion battery is to overcome the poor electronic transport in the converted state.
Acknowledgments
Financial support from the European Union and the Free State of Saxonia in the framework of the European Centre for Emerging Materials and Processes (ECEMP) is gratefully acknowledged. This work has further benefited from a grant (No. 03KP801) of the Federal Ministry of Education and Research (BMBF) within the consortium "Electrochemistry for Electromobility".