Abstract
We explore the conversion of free-standing Cu nanowire arrays produced by electrodeposition in polymer etched ion-track membranes into metal-organic frameworks KHUST-1 by electrochemical oxidation. HKUST-1 particles are built up when the as-formed Cu2+ ions bind to the benzene tricarboxylic acid ligands (BTC3−) in the electrolyte solution. The morphology and crystallinity of the samples at different transformation stages are investigated by scanning and transmission electron microscopy. X-ray diffraction data taken at different conversion times confirm the formation of HKUST-1 particles. The conversion process resulted in octahedral structures of several μm in size. Comparison of the Raman spectra with the band positions derived from density functional theory (DFT) calculations, suggests that vibrations involving Cu atoms appear only below 490 cm−1 wavenumbers and involve the entire HKUST-1 lattice rather than vibrations of single bonds.

Export citation and abstract BibTeX RIS

This is an open access article distributed under the terms of the Creative Commons Attribution 4.0 License (CC BY, http://creativecommons.org/licenses/by/4.0/), which permits unrestricted reuse of the work in any medium, provided the original work is properly cited.
Metal-organic frameworks (MOFs) are nanoporous materials that have attracted widespread attention over the past two decades. 1–3 Due to their ultrahigh surface area, permanent porosity and open metal sites, MOFs continue to attract huge attention in emerging application fields, such as gas separation and gas storage, 4–7 catalysis, 8,9 and biomedical science. 10,11 Cu-based metal-organic frameworks Cu3(BTC)2 (also known as HKUST-1) are one of the most famous MOF representatives, exhibiting a huge open porosity and thus a remarkable capacity to store and uptake different gases. 12,13
Solvothermal, 14,15 ultrasonic, 16,17 and electrochemical 18,19 methods have been commonly applied to synthesize HKUST-1. Among them, the electrochemical method is environmentally friendly and energy saving, which requires shorter reaction times and lower reaction temperatures. It is also accompanied by less reaction waste compared to the traditional hydrothermal process. Using suitable templates, the electrochemical method enables the production of shape-controlled MOF nanostructures. 20 Conversion from Cu(OH)2 nanotubes, 21 Cu nanobelts, 22 and insoluble ceramic Cu-based precursors 23 to HKUST-1 have also been proposed. However, direct electrochemical conversion to HKUST-1 using pure Cu nanowires as the electrode has been rarely reported. Cu nanowires have large surface area and a large curvature, which provides a greater number of sites for the formation of metal-organic coordination bonds between the copper ions and the organic linkers. This can lead to higher yields and improved quality of the HKUST-1. At the same time, nanowires, specially in the form of 3D nanowire networks, have potential applications in batteries, catalysis and supercapacitors. 24–26
The potential applications of MOFs can be further extended by encapsulating various functional nanostructures into MOFs to form hybridized structures, such as e.g., Au-nanoparticles@HKUST-1, 27 Au/Pt-nanowires@MOF-545, 28 Au-nanorods@[Al(OH)(1,4-ndc)]n, 29 Au/Pt-nanoparticles@ZIF-8, 30 and Ru-nanoparticles@MIL-101. 31 The hybrid nanostructure@MOF materials display unique catalytic, sensing, and adsorption capabilities. These properties are not found in either nanoparticles or MOFs alone. 32–35 For example, Ag-HKUST-1 hybrid crystals were demonstrated to exhibit a highly efficient catalytic activity for the reduction of 4-nitrophenol into 4-aminophenol by NaBH4. 36 The first step in constructing these hybrid materials is often the synthesis of the MOF structure which is subsequently used as a template for the growth or implantation of metal nanostructures. There is no report about direct growth of MOFs on metal nanostructures such as nanowires.
The synthesis of HKUST-1 nanowires and three-dimensionally interconnected nanowire networks by electrochemical oxidation of Cu nanowires embedded in the host polymer of an etched ion-track membrane was demonstrated by Caddeo et al. 20 This approach required the subsequent dissolution of the polymer membrane in an organic solvent (e.g. dichloromethane) to access and characterize the synthesized MOF nanowires. Here, we report on the conversion of free-standing arrays of Cu nanowires into HKUST-1, i.e. without the presence of the polymer membrane. During the conversion process, Cu-nanowire@HKUST-1 composite structures are formed. Both size and density of the MOF crystals increase with reaction time, while the length of the Cu nanowires decreases. Based on DFT calculations several bands in Raman spectra can be assigned to vibration of the entire MOF lattice. This differs from previous works that concluded that the Raman bands correspond to a specific single bond of the crystal. 37–39
Experimental
Template-based fabrication of Cu nanowire arrays
The polymer templates were fabricated by ion track nanotechnology. 30 μm thick polycarbonate membranes were irradiated with 2.2 GeV Au ions (fluence 108 ions cm−2) and subsequently sensitized under UV light on both side. 40 The sensitized membranes were then etched in a 6 M NaOH solution to convert the ion tracks into cylindrical channels with diameter of ∼210 nm. After sputtering and electrochemical deposition of a gold layer on one side of the etched membrane, electrodeposition of Cu nanowires inside the channels was carried out using an aqueous solution containing 1.0 M CuSO4 and 0.2 M H2SO4 at 60 °C by applying a potential of −0.1 V in a two-electrode setup versus a Cu counter electrode. After 8 min, Cu nanowire arrays with a length of ∼10 μm were deposited in the channels of the membrane. The details of the template fabrication and synthesis of Cu nanowire arrays are given in the Supporting Information (Section S1).
Conversion of Cu nanowires to HKUST-1
To release the nanowires from the template, the polycarbonate matrix was dissolved in dichloromethane (CH2Cl2, Merck, for analysis). The Cu nanowires standing on the Au back electrode were then converted to HKUST-1 in a two-electrode setup heated to 55 °C. The electrolyte used was a 50/50 vol% ethanol/water solution containing 5.8 mM BTC (1,3,5-benzenetricarboxylate) and 6.42 mM MTBS (tributylmethylammonium methyl sulfate). 20 A conversion voltage of U = 2.5 V versus a Cu counter electrode was applied. To monitor the conversion of the Cu nanowires into HKUST-1, current-time curves were recorded. A representative current-time curve is shown in Fig. S2 of Supporting Information. The converted HKUST-1 samples were removed from the growth solution and rinsed twice with ethanol to remove residual linker and supporting electrolyte, and vacuum-dried before further analysis.
Characterization
The morphology of the samples transformed for different times was visualized using a ZEISS Gemini 5500 scanning electron microscope (SEM). The elemental composition was investigated by energy dispersive X-ray spectroscopy (EDX) using a Bruker XFlash 5030 EDX detector. The structural and crystallographic characterization was performed by X-ray diffraction (XRD) measurements using a Bruker D2 powder diffractometer (Cu Kα, λ = 0.154 nm, 40 kV, 30 mA). Transmission electron microscopy (TEM) and selected area electron diffraction (SAED) measurements were performed using a JEOL JEM ARM200F microscope. For TEM measurements, the converted samples were exposed to an ethanol ultrasonic bath to detach the nanostructures from the Au back electrode. The nanostructures were then transferred onto a carbon-coated Ni TEM grid by drop-casting. The chemical structure and molecular vibration modes of the samples were studied using a Raman spectrometer HORIBA HR 800 UV with an excitation wavelength of 473 nm. The experimental Raman results were compared to DFT calculations implemented in the Vienna ab initio simulation package (VASP) 41 and density functional perturbation theory (DFPT) within PHONOPY code. 42 We used the B3LYP functional as it is one of the most accurate density functional theories for structures containing organics. 43
Results and Discussion
Optical microscopy of the samples shows a pronounced color change from initially orange to brown and finally greenish depending on the conversion time of the Cu nanowires into HKUST-1 (Supporting Information Fig. S3). The corresponding SEM images at low magnification presented in Supporting Information Fig. S4 illustrate the increase from small to large and from sparse to dense coverage of the surface with nanostructures.
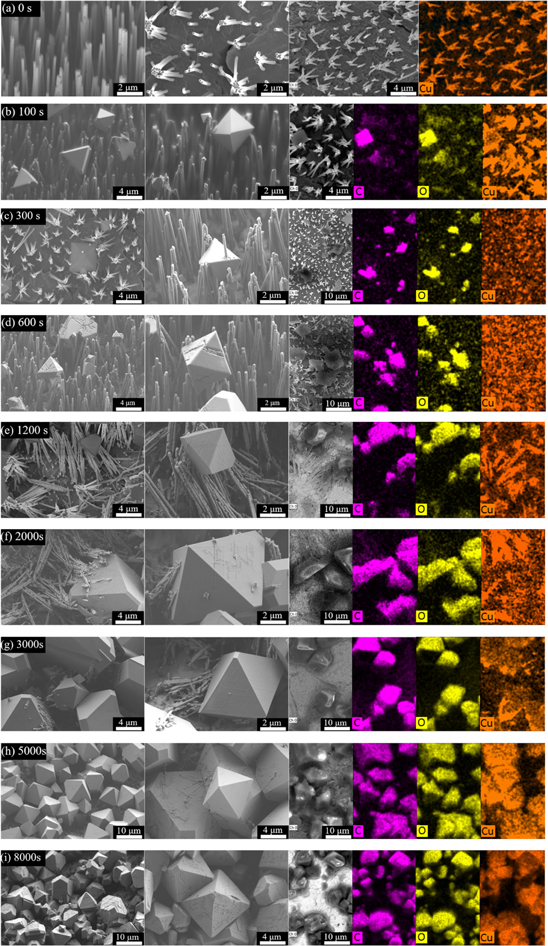
SEM images at higher magnification of different samples and their elemental distribution by EDX are presented in Fig. 1. The as-grown Cu nanowires have a length of ∼10 μm and their diameter is ∼210 nm (Fig. 1a). Some neighboring nanowires touch each other at the tips. We ascribe this effect to bending of the initially parallel wires during the dissolution process of the polycarbonate matrix. High-resolution TEM (HRTEM) and selected area electron diffraction (SAED) images indicate that the as-grown Cu nanowires are crystalline. The distance between adjacent planes is 0.128 nm, which corresponds to the (220) plane of face-centered cubic (fcc) copper (Supporting Information Fig. S5). Figure 1b shows the sample after 100 s conversion. At the top of the nanowires, few octahedral particles have formed with sizes ranging from 400 nm to 4 μm, while the diameter and morphology of the Cu nanowires have not changed significantly. After 300 s of conversion, the number of MOF particles has increased, while the size is still distributed between 400 nm and 4 μm (Fig. 1c). The diameter of the nanowires remains the same, but the nanowire tips start to fray. At this stage, the MOF particles and the nanowires seem to form a composite structure with the Cu nanowires being wrapped around the MOF particles or even passing through them. After 600 s conversion, the number and size of the MOF particles have further increased, some particles reach 7 μm (Fig. 1d) and the originally smooth surface of the nanowires is rather rough. After 1200 s, the nanowires are severely degraded and many of them collapsed (Fig. 1e). This collapse may be due to the wire degradation and/or weight of the MOF particles. With conversion times getting longer, the nanowires begin to break (Fig. 1f) and after 3000 s, the nanowires are completely broken into small sections (Fig. 2g). After 5000 s, almost no nanowires remain and MOF particles with size larger than 10 μm are formed (Fig. 2h). After 8000 s, the Cu nanowires are completely transformed into MOF particles (Fig. 1i). Elemental analysis by EDX provides clear evidence that the observed particles are indeed HKUST-1 which consists of the elements copper, carbon, and oxygen.
Figure 1. Morphology details of different samples by SEM and their elemental distribution by EDX (purple: carbon, yellow: oxygen, orange: copper). Row (a) shows as-grown Cu nanowires, row (b) to (i) show MOF structures after 100 s, 300 s, 600 s, 1200 s, 2000 s, 3000 s, 5000 s, and 8000 s conversion time, respectively.
Download figure:
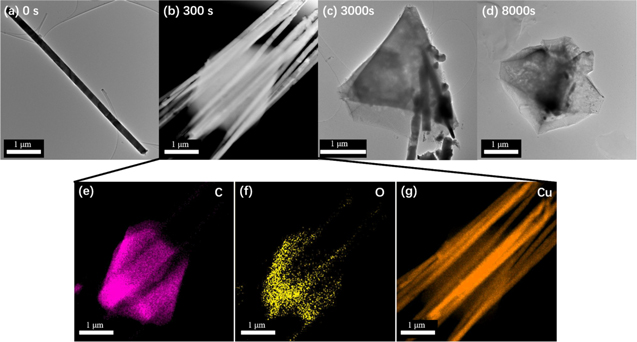
Standard image High-resolution imageFigure 2. TEM images of as-grown Cu nanowire (a), and structures formed after 300 s (b), 3000 s (c), and 8000 s (d). (e-g) EDX mapping for element carbon (e), oxygen (f) and copper (g) of sample shown in (b).
Download figure:
Standard image High-resolution imageFigures 2a–2d presents TEM images of samples after 0 s, 300 s, 3000 s, and 8000 s conversion, clearly illustrating that the nanowires gradually disappear and eventually transform completely into HKUST-1 particles. At the intermediate stages of the transformation hybrid Cu-nanowire@HKUST-1 structures are formed as revealed in Fig. 1c. Figures 2e–2g are EDX mapping images measured of a representative structure formed after 300 s conversion displaying signals corresponding to the elements C, O and Cu and confirming the results from SEM-EDX analysis, demonstrating the formation of the hybrid Cu-nanowire@HKUST-1 composites.
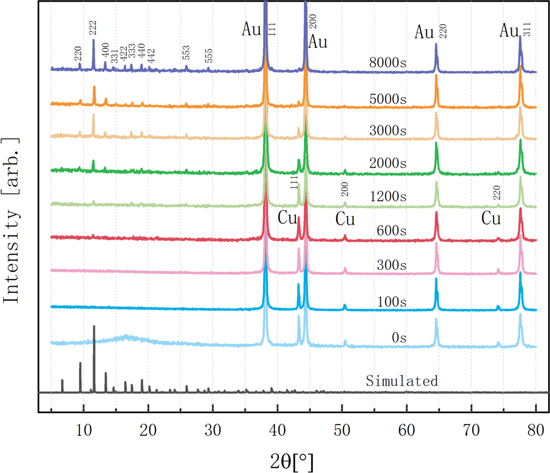
The Cu nanowire to HKUST-1 conversion process was also confirmed by XRD analysis. XRD diffractograms recorded at different reaction times are shown in Fig. 3. We observe three Cu reflections, namely (111), (200), and (220), whose intensities systematically decrease with increasing conversion times. When the conversion time reaches 5000 s, these reflections have almost disappeared, which is consistent with the progressing dissolution and disappearance of the Cu nanowires on the SEM images (Fig. 1). After 300 s conversion time, a series of characteristic reflections appears at low diffraction angles, which are in agreement with simulated single-crystal HKUST-1 XRD data 44,45 shown at the bottom of Fig. 3. The increase of their intensity with longer conversion times suggests that more and more HKUST-1 particles are formed. The narrow width of the reflections indicates that the synthesized HKUST-1 particles are crystalline and of high purity. During the whole transformation process, no cuprous oxide phase is found, which is different from previous Cu to HKUST-1 transformations are conducted in an etched ion-track template. 20 The four high-intensity reflections at 38.2°, 44.4°, 64.6°, and 77.6° correspond to the Au back electrode, which remains unchanged throughout the conversion process. The evolution of the X-ray diffractograms is in excellent agreement with the morphology observations from scanning electron microscopy.
Figure 3. XRD diffractograms of as-grown Cu nanowire arrays as well as structures after different conversion times, normalized to the Au (111) reflection. The vertical lines at the bottom show HKUST-1 reflections according to simulations. 44,45
Download figure:
Standard image High-resolution imageBased on the morphological and structural analysis presented above, we propose two main stages of the HKUST-1 growth mechanism: In a first step, the HKUST-1 crystals are initiated by the applied 2.5 V potential versus the Cu counter electrode, the Cu nanowires are oxidatively dissolved to Cu2+ cations and the BTC3− anions of the ligand coordinate with Cu2+ cations on the Cu nanowire surface, where HKUST-1 nucleation sites built up. In the second stage, the MOF crystals grow thermodynamically, forming a fcc network (Fm3m) with octahedron morphology. The shape is determined by the coexistence of slower and faster growth facets. 46,47 In HKUST-1, {100} facets have a higher surface energy and thus a faster growth rate than {111} facets making the {111} facets to be exposed on the crystal surface to minimize the total surface energy and consequently exhibiting an octahedron morphology. 48,49
Figure 4a shows the Raman spectra of samples recorded after different conversion times. To complement the experimental data and provide information on vibrational properties of HKUST-1, wavenumbers of the Raman modes are studied by DFT calculations. Relevant calculation parameters are described in Supporting Information (Fig. S6). Ignoring the water molecules in the crystal, HKUST-1 has the symmetry of the Oh space group. So, the vibrational modes of irreducible representation Eg and T2g are Raman active. Considering that the signal of T2g modes are relatively weak and difficult to be observed, we only compare the energies of Eg irreducible representations with the experimental Raman data (Fig. 4b). Apart from some minor deviations, the calculated results overall agree well with the experimental values. Eg irreducible representations are doubly-degenerate, so each Eg mode corresponds to two vibrational modes. Animations of the listed Eg vibrational modes are illustrated in the Supporting Information (Vibration Modes), where vibration modes 01 to 19 correspond to wavenumbers from low to high. The vibrations of heavy atoms tend to occur at lower and not at higher energy levels. In our spectra, wavenumbers below 490 cm−1 are ascribed to vibrations of the joint contribution of carbon, oxygen and copper atoms, while vibrations with wavenumbers above 490 cm−1 are attributed to the benzene ring and oxygen atoms without a contribution from Cu atoms. Some of the bands in our Raman spectra cannot be described by a specific vibration, but reflect the vibration of the whole lattice. Our Raman findings differ slightly from previous works. 37–39
Figure 4. (a) Raman spectra of samples recorded after different conversion times. The blue circles indicate HKUST-1 band positions expected from DFT calculations. (b) Wavenumbers of the Raman modes determined experimentally (red) and from DFT calculations (blue).
Download figure:
Standard image High-resolution imageConclusions
In summary, we demonstrated that free-standing Cu nanowires arrays can be converted into Cu-based metal–organic framework HKUST-1 by electrochemical oxidation. By systematically increasing the conversion time, we visualized the growth process of HKUST-1 particles from small to large and from sparse to dense, finally forming the characteristic octahedron structures. The analyses performed at different stages of the conversion process did not reveal any evidence of the presence of Cu2O. Comparison of the measured Raman spectra with DFT calculations revealed that some Raman modes cannot be described simply by individual bond vibrations, but in fact reflect the vibration of the entire lattice. In the future, the influence of ligand concentration, electrolyte temperature, and applied potential on the conversion process will be studied. We believe that this method can be applied to control the position and dimensions of the HKUST-1 crystals by optimizing the density and adjusting the dimensions of the free-standing Cu nanowires.
Acknowledgments
This work was supported by the International Postdoctoral Exchange Fellowship Program (No. 2020018) hosted and financial supported by The Office of China Postdoctoral Council (OCPC) and the Helmholtz Association (GSI Helmholtz Center for Heavy Ion Research). Dr. Hang Liu (University of Stuttgart) is acknowledged for the discussion on our experimental results. The preparation of the samples employed for this work is based on an UMAT irradiation experiment, which was performed at the beamline X0 at the GSI Helmholtz Centre for Heavy Ion Research, Darmstadt (Germany) in the frame of FAIR-Phase 0.
Supporting information
See the supporting information for the current-time curves of Cu nanowires deposition and conversion process of Cu nanowires into HKUST-1 particles, more morphological and structural characterization, DFT calculation parameters, and the animations of vibration modes.
Author contributions
All authors contributed to the review and editing of the manuscript. In addition, Jia Luo: conceptualization, investigation, formal analysis, writing–original draft, writing–review & editing; Mu Lan: formal analysis, writing–review & editing; Michael Wagner: investigation; Nils Ulrich: investigation; Peter Kopold: investigation; Ioannis Tzifas: investigation; Hongyan Wang: formal analysis, writing–review & editing; Christina Trautmann: funding acquisition, writing–review & editing; Maria Eugenia Toimil-Molares: conceptualization, funding acquisition, writing–review & editing.
Supplementary data (0.6 MB TIF)
Supplementary data (0.9 MB TIF)
Supplementary data (2.9 MB TIF)
Supplementary data (1.8 MB TIF)
Supplementary data (2.3 MB TIF)
Supplementary data (2.1 MB TIF)
Supplementary data (46.0 MB RAR)
Supplementary data (4.2 MB DOCX)


