
Abstract
As a class of porous coordination polymers, metal organic frameworks (MOFs) have potential applications in many fields. In this work, a novel synthetic method, without using toxic solvents, has been developed to prepare HKUST-1 MOF nanoparticles from coprecipitation reaction of copper (II) chloride and 1,3,5-benzenetricarboxylic acid (trimesic acid) in distilled water. The synthesized nanoparticles were first characterized by X–ray diffraction (XRD), Fourier–transform infrared spectroscopy (FT–IR), and scanning electron microscopy (SEM). The flat–band potential, conduction band, and valence band edges of HKUST-1 nanoparticles were experimentally determined in alkaline solution, and UV–Vis diffuse reflectance spectra (DRS) analysis showed the band gap energy to be 2.5 eV. Electrochemical working electrodes were prepared by electrophoretic deposition of HKUST-1 on the surface of a stainless steel electrode for electrochemical voltammetry and impedance measurements. For the first time the prepared HKUST-1 nanoparticles were investigated as multifunctional electrocatalysts for both overall water splitting and CO2 reduction in alkaline solution. The Tafel plot was used to show the relationship between the over–potential (η) and the logarithmic current density, revealing the kinetic parameters of the electrochemical reactions. Furthermore, the Tafel slope was determined to be 190 mVdec−1, indicating that the Volmer mechanism with electrochemical desorption of hydrogen acts as the rate–determining step (RDS).
Export citation and abstract BibTeX RIS

This is an open access article distributed under the terms of the Creative Commons Attribution 4.0 License (CC BY, http://creativecommons.org/licenses/by/4.0/), which permits unrestricted reuse of the work in any medium, provided the original work is properly cited.
Nowadays, due to rapid development of societies and population growth, the shortage of clean energy has become a serious problem, and energy dependency has increased day by day. In this regard, societies are witnessing the increasing consumption of fossil fuels, and these fuels have disadvantages such as environmental pollution as they are non–renewable and unsustainable. So far the energy crisis, especially for clean and renewable energy, and environmental problems have become two important issues that considerably affect sustainable development of our economy and society. 1 Many efforts have been made to expand the use of renewable, sustainable, and environmentally friendly energy sources. 2,3 Among different clean energy resources, hydrogen gas has been proposed as an alternative to carbon–based fuels as it reduces the release of carbon dioxide and other environmental pollutants. For energy conversion, hydrogen can be generated by splitting water into hydrogen and oxygen—so called "water splitting," and then hydrogen can be used to convert chemical energy into electrical energy in a fuel cell. 4,5 The water splitting process involves two half reactions: the hydrogen evolution reaction (HER) and oxygen evolution reaction (OER).

Generally, water splitting is performed under both acidic and alkaline conditions using the following Eqs. 2–5: 6
In acidic solution:


In neutral or alkaline solution:


Due to the electrochemical nature of water splitting using a water electrolyzer, hydrogen and oxygen gases are separately evolved on the surface of cathode and anode, respectively, in both solution types. 7 However, the electrochemical water splitting in alkaline solutions has advantages such as well-developed and efficient electrolyzers and a wide range of stable electrocatalysts against sluggish kinetics of OER compared to the water splitting in acidic solutions. 8,9 Platinum and its alloys were regarded to be the most active catalysts for the HER, while iridium and ruthenium oxides were reported as effective catalysts for the OER. 10–12 Unfortunately, the high cost and extreme scarcity of these noble metals severely limit their large–scale applications in water splitting. 13 Therefore, the development of earth–abundant and low–cost catalysts with high activity toward the HER and the OER is crucial to overcome this challenge.
As mentioned, fossil fuels lead to excessive CO2 production that can cause environmental problems and pose a serious threat to human society. Many studies have been done to convert CO2 into renewable hydrocarbon fuels such as methane and methanol because CO2 is a futuristic C1 carbon source for the production of fuels and chemicals. 14,15 The electrochemical reduction of CO2 produces various vital products such as methane, methanol, ethanol, formaldehyde, ethylene, and carbon monoxide based on the type of catalyst and supporting electrolyte used. 16,17 However, the practical applications of electrochemical reduction of CO2 have barriers such as poor product selectivity and low energy efficiency. The electrochemical reduction of CO2 follows the reduction pathways involving two, four, six and eight electrons which is dependent on gaseous, aqueous, and non–aqueous phases and the nature of the electrodes. 18 So far, various metals including lead, tin, indium, bismuth, palladium, gold, zinc, silver, nickel, iron, platinum, and copper have been used as electrocatalysts to reduce CO2 but copper has attracted the most attention. 19–21 The reason for focusing on copper is due to its ability to convert CO2 into significant quantities of hydrocarbons and alcohols, whereas other metals tend to be very selective toward a single product (hydrogen, carbon monoxide and formate). 22,23
Because of the heterogeneity nature of both electrochemical water splitting and CO2 reduction reactions, the specific surface area of the electrode is another important factor, which should be considered in designing the appropriate electrocatalysts. Metal organic frameworks (MOFs) as a class of porous coordination polymers (PCPs) have become new promising candidates due to their huge potentials and special advantages such as high specific surface area, tunable pore channels, abundant active sites, extremely rich morphological structures, stable nature under aqueous acidic and basic conditions, and excellent charge transfer capability. 24,25 The applications of MOFs in electrocatalytic water splitting reactions have been extensively exploited in recent years. 26,27 Also, MOFs have been considered for CO2 reduction because they have both metal and ligand characters. 28,29 In addition, MOFs are good candidates for absorbing CO2 due to their high specific surface area (between 1000 and 10000 m2 g−1), and it is known that the absorption of CO2 in the process of reducing CO2 is very important. 30,31 On the other hand, the metallic nodes of MOFs provide active sites for electrocatalytic reactions. Copper based compounds have been identified as promising candidate electrocatalysts for overall water splitting and CO2 reduction due to their stability and relatively high reactivity. 32,33 In addition to its abundance, copper has attracted much attention in many catalytic applications, especially electrocatalysis because elemental copper is environmentally friendly, biologically relevant, and has well–defined redox properties. 34,35
Regards to this strategy, HKUST-1 could be a good candidate as an appropriated electrocatalyst for these processes in terms of containing copper nodes. The synthesis of MOFs is usually carried out at high temperatures and in the presence of toxic solvents such as DMF and DMSO which are hazardous to the environment. 36 HKUST-1, for the first time, was synthesized from the solvothermal reaction of copper nitrate and 1,3,5-benzenetricarboxylic acid with an ethanol–water mixture by Williams et al. in 1999. 37 In this work, synthesis was performed at room temperature in distilled water which implies compatibility with the environment. The developed method can be performed at room temperature using environmentally friendly solvents, water and ethanol, and allows for large–scale production. The synthesized MOFs were explored for applications in water–splitting and CO2 reduction, showing excellent catalytic function compared to copper–based nanoparticles and other MOF materials reported.
Experimental Section
MOF synthesis
The HKUST-1 nanoparticles were synthesized in our previous work. 38 All chemicals have been introduced in Supporting Information (SI) section. First, a solution of 23.75 mmol H3BTC (4.99 g) in 250 ml of DI water was prepared with addition of 0.1 M NaOH and 0.1 M HCl solutions to adjust the pH of the solution to 7. In the next step, 35.60 mmol CuCl2·2H2O (6.07 g) was dissolved in 250 ml of DI water. Thereafter, the metal ion solution was added into the H3BTC solution at room temperature with continuous stirring at 1000 rpm for 12 h. The blue–colored precipitate was separated by centrifugation, washed with ethanol and dried at 25 °C for 48 h and finally activated at 200 °C for 2 h in air.
Material characterization
X–ray diffraction (XRD) pattern was obtained by a Rigaku Ultima IV diffractometer equipped with a Cu Kα source (λ=1.5406 Å). FT–IR spectra were recorded using a Nicolet 800 spectrophotometer in the range 4000–400 cm−1 with the KBr pellet. Scanning electron microscopy (SEM) photographs was obtained with FEI Quanta 200. The N2 adsorption–desorption measurements were carried out with Belsorp mini II (the sample was degassed at 200 °C). Thermogravimetric analysis (TGA) was performed by a Q600 thermogravimetric analyzer with a heating rate of 10 °C min−1 in the range of 25 °C–950 °C under Ar flow. The UV–Vis diffuse reflectance spectrum (DRS) was obtained with JASCO V–670 spectrophotometer (JASCO Co. Japan).
Electrophoretic deposition of MOF thin films
Initially, the electrode surface (stainless steel piece with a size of 1 cm × 5 cm) was polished with sandpaper (number 1000) and washed with DI water and dried. Then, 10 mg of MOF powder was added to 20 ml of ethanol and suspended using an ultrasonic bath for 30 min. Two identical stainless steel electrodes were dipped in the solution (1 cm separation distance) and a constant DC voltage of 20 V was applied for 2 min. Finally, the negative electrode covered with the prepared materials was washed with DI water five times and dried at 200 °C for 30 min.
Electrochemical measurement
Electrochemical measurements were performed at room temperature (25 °C) using a conventional three–electrode cell, with a platinum grid as the counter electrode, a saturated Ag/AgCl as the reference electrode and a stainless steel electrode deposited with HKUST-1 electrophoretically on it as the working electrode in 0.1 M NaOH aqueous solution. Cyclic voltammetry (CV) experiments were performed by using a Solartron Electrochemical interface SI 1287. Electrochemical impedance spectroscopy (EIS) data were obtained using a Solartron Phase Gain Analyzer SI 1260.
Results and Discussion
The synthesized sample was characterized with a variety of techniques before it was used for water splitting and CO2 reduction. XRD pattern, IR spectrum, SEM monographs, N2 adsorption–desorption isotherms and TGA curve were taken and presented as Figs. S1–S5(available online at stacks.iop.org/ECSA/1/020501/mmedia) accompanied with their brief interpretation in SI section. These results have been interpreted in more details in our previous work. 38
The band gap (Eg) can be estimated by the following equation:

In this equation,  is the absorption coefficient,
  is the photon energy,
  is a constant relative to the material,
  is the band gap energy and
  is 2 and 0.5, respectively, for direct and indirect allowed transition. The DRS spectrum in Fig. 1a shows that HKUST-1 absorbs light at visible wavelengths. The spectrum displays two characteristic absorption bands around 270 and 700 nm, which are consistent with previously published results.
39
The first absorption band is due to the ligand to metal charge transfer (LMCT) transition of oxygen ions to copper ions and the latter one is due to the d–d transition of Cu(II) species.
40
The energy of band gap was estimated to be 2.5 eV for the HKUST-1 when values
is 2 and 0.5, respectively, for direct and indirect allowed transition. The DRS spectrum in Fig. 1a shows that HKUST-1 absorbs light at visible wavelengths. The spectrum displays two characteristic absorption bands around 270 and 700 nm, which are consistent with previously published results.
39
The first absorption band is due to the ligand to metal charge transfer (LMCT) transition of oxygen ions to copper ions and the latter one is due to the d–d transition of Cu(II) species.
40
The energy of band gap was estimated to be 2.5 eV for the HKUST-1 when values  versus
  was plotted (Fig. 1b). In 2016, nano–sized MOF-199 (HKUST-1) particles (with a particle size about 50 nm) were synthesized via solvothermal method using DMF solution by Hu et al.
39
Based on the DRS spectrum, they obtained the band gap value of 2.48 eV for MOF-199. Rahimi et al. prepared HKUST-1 using an ultrasound–assisted solvothermal method in a DMF–ethanol mixture.
41
They characterized the size of HKUST-1 particles in the range of 0.1–0.8 μm, and then reported the direct band gap at 2.63 eV for HKUST-1. The difference in the reported band gap values is due to the difference in the synthesis method and solvent which results in the difference in particle size. Riley et al. reported that the band gap was closely related to the particle size.
42
Walsh et al. calculated the indirect band gap energy using density functional theory (DFT) with a hybrid exchange–correlation functional (HSE06) for HKUST-1.
43
They reported that the band gap energy of HKUST-1 antiferromagnetic (AFM configuration) and ferromagnetic (FM configuration) is 3.5 and 3.4 eV, respectively.
was plotted (Fig. 1b). In 2016, nano–sized MOF-199 (HKUST-1) particles (with a particle size about 50 nm) were synthesized via solvothermal method using DMF solution by Hu et al.
39
Based on the DRS spectrum, they obtained the band gap value of 2.48 eV for MOF-199. Rahimi et al. prepared HKUST-1 using an ultrasound–assisted solvothermal method in a DMF–ethanol mixture.
41
They characterized the size of HKUST-1 particles in the range of 0.1–0.8 μm, and then reported the direct band gap at 2.63 eV for HKUST-1. The difference in the reported band gap values is due to the difference in the synthesis method and solvent which results in the difference in particle size. Riley et al. reported that the band gap was closely related to the particle size.
42
Walsh et al. calculated the indirect band gap energy using density functional theory (DFT) with a hybrid exchange–correlation functional (HSE06) for HKUST-1.
43
They reported that the band gap energy of HKUST-1 antiferromagnetic (AFM configuration) and ferromagnetic (FM configuration) is 3.5 and 3.4 eV, respectively.
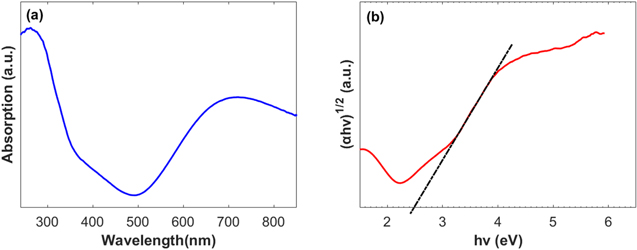
Figure 1. (a) UV–Vis diffuse reflectance spectrum of HKUST-1; (b) Tauc plot of HKUST-1.
Download figure:
Standard image High-resolution imageMott–Schottky theory was applied to study the processes that occur at the electrode–electrolyte interface. The Mott–Schottky model considers the relation between the space charge layer capacity and the applied potential. Thus, cyclic voltammograms (CVs) were first performed at different sweeping rates, and then an area of potential windows where no Faradaic current is generated was identified (Fig. S6-a). Within this potential area, only non–Faradaic processes take place and the electrode can be regarded as an ideally polarized electrode. It is obvious that the CV curves have a rectangular shape which represents the pure capacitive behavior of HKUST-1. Finally, based on Eq. 7, the Mott–Schottky curve is plotted in Fig. 2a.

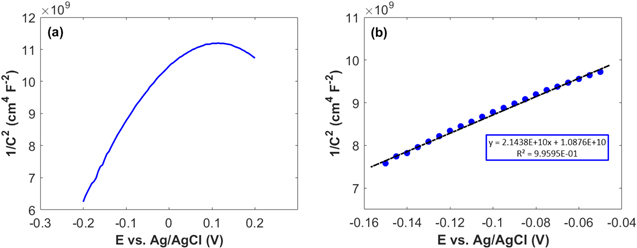
Figure 2. (a) Mott–Schottky plot for HKUST-1 in 0.1 M NaOH; (b) Linear part of the Mott–Schottky plot of HKUST-1 in 0.1 M NaOH.
Download figure:
Standard image High-resolution imageWhere  is the interfacial capacitance,
  is relative permittivity of HKUST-1,
  is vacuum permittivity,
  is elementary charge,
  is carrier charge concentration,
  is applied potential,
  is flat band potential,
  is Boltzmann's constant,
  is the absolute temperature and
  is the electronic charge. Figure 2a shows Mott–Schottky plot for HKUST-1 at a frequency of 10000 Hz in 0.1 M NaOH. A high frequency of 10000 Hz is chosen because fast processes such as the charging of the double layer and space charge layer capacitors respond at this frequency. It is difficult to recognize and select the linear region from the Mott–Schottky plot in Fig. 2a. In this regard, the Nyquist curves were obtained in a range of potentials selected from the CVs because the sample demonstrates capacitive behavior and the capacity of the space charge layer is completely independent of potential at this high frequency. It is expected that these Nyquist curves will coincide exactly with the region where only the space layer charging takes place. Therefore, Nyquist curves were plotted with 0.05 V potential interval and over a frequency range of 0.1 to 100000 Hz in 0.1 M NaOH solution (Fig. S6-b). The Nyquist curves over the range −0.15 to −0.05 V for HKUST-1 show a non–Faradaic process, and this region was used for the linear fitting of the Mott–Schottky equation as shown in Fig. 2b. A correlation coefficient close to 1 indicates a good agreement between the experimental results and the results of the Mott–Schottky theory. In Fig. 2b, the slope of the Mott–Schottky plot is positive; this confirms that the HKUST-1 behaves an n–type semiconductor.
44,45
is the electronic charge. Figure 2a shows Mott–Schottky plot for HKUST-1 at a frequency of 10000 Hz in 0.1 M NaOH. A high frequency of 10000 Hz is chosen because fast processes such as the charging of the double layer and space charge layer capacitors respond at this frequency. It is difficult to recognize and select the linear region from the Mott–Schottky plot in Fig. 2a. In this regard, the Nyquist curves were obtained in a range of potentials selected from the CVs because the sample demonstrates capacitive behavior and the capacity of the space charge layer is completely independent of potential at this high frequency. It is expected that these Nyquist curves will coincide exactly with the region where only the space layer charging takes place. Therefore, Nyquist curves were plotted with 0.05 V potential interval and over a frequency range of 0.1 to 100000 Hz in 0.1 M NaOH solution (Fig. S6-b). The Nyquist curves over the range −0.15 to −0.05 V for HKUST-1 show a non–Faradaic process, and this region was used for the linear fitting of the Mott–Schottky equation as shown in Fig. 2b. A correlation coefficient close to 1 indicates a good agreement between the experimental results and the results of the Mott–Schottky theory. In Fig. 2b, the slope of the Mott–Schottky plot is positive; this confirms that the HKUST-1 behaves an n–type semiconductor.
44,45
The flat–band potential (VFB) obtained from Mott–Schottky analysis for HKUST-1 is −0.51 V vs Ag/AgCl (+0.46 V vs RHE). Approximately, the conduction band edge, ECB, of an n–type semiconductor is equal to its VFB. 46,47 Based on the estimated Eg and VFB, the conduction band (ECB) and valence band (EVB) edges of HKUST-1 were calculated to be −4.96 eV and −7.46 eV, respectively. According to these data, we outline the experimental electronic band structure of HKUST-1, as shown in Fig. 3.
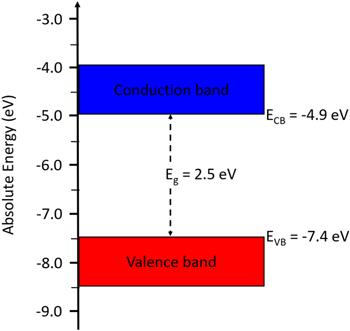
Figure 3. Energy level diagram of HKUST-1.
Download figure:
Standard image High-resolution imageElectrochemical impedance spectrum (EIS) was also conducted to gain series resistance (Rs). Figure 4 displays the Nyquist plot of HKUST-1 at 0.1 V vs Ag/AgCl, and the inset illustrates the equivalent circuit mode. The Rs of HKUST-1 was calculated to be 10.35 Ω, which was used to determine the iR compensation. Accordingly, all polarization curves were reported with iR compensation.

Figure 4. The impedance spectrum with fitted line for HKUST-1 in 0.1 M NaOH.
Download figure:
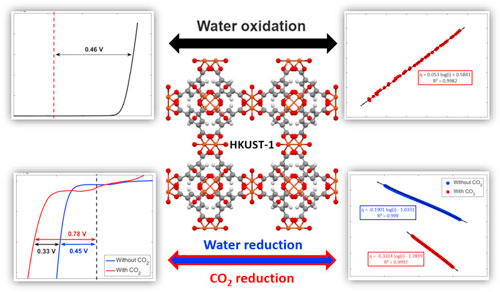
Standard image High-resolution imageThe OER was investigated using the linear sweep voltammetry (LSV) technique in a 0.1 M aqueous NaOH solution with a scan rate of 10 mV·s−1, as shown in Fig. 5a where the dashed line demonstrates the standard potential of OER. A sharp peak starts to appear at approximately 1.56 V vs RHE for HKUST-1, corresponding to the OER, and the OER overpotential of 0.46 V at a current density of 3 mA·cm−2 was obtained for nanostructured HKUST-1. From a thermodynamic perspective, this process is possible but that is not sufficient and should be examined from the perspective of chemical kinetics. To do this, the Tafel plot was used to show the relationship between the over–potential (η) and the logarithmic current density, which expresses kinetic parameters of an electrochemical reaction. The Tafel slope reaches 53 mV·dec−1 in this case (Fig. 5b), which suggests that the RDS consists of the one–electron transfer electrosorption of  ions.
48
Regards to Bockris, both
ions.
48
Regards to Bockris, both  and
and  are able to be oxidized on the surface of electrodes but water molecules need a longer time to take a suitable arrangement on the proper sites than
  ions.
48
Also, hydroxide ions move faster compared to the water molecules toward the electrode because of Grotthuss mechanism by a series proton transfer between
ions.
48
Also, hydroxide ions move faster compared to the water molecules toward the electrode because of Grotthuss mechanism by a series proton transfer between  and
and  Therefore, mass transfer is fast and electron transfer from
  to the electrode is rate determining step. In Fig. 5c, the above processes have been presented for HKUST-1. The Tafel slope obtained for HKUST-1 is close to the values reported for RuO2 and IrO2, which are the benchmark catalysts for the OER.
49,50
Loh et al. synthesized a Cu-MOF from copper nitrate trihydrate, 1,4-benzenedicarboxylic acid and triethylene-diamine in the presence of different amounts of graphene oxide (GO) and measured their oxygen evolution performance in acidic solution.
51
They reported the Tafel slope values of 89, 71 and 65 mV·dec−1 for Cu-MOF, (GO 6 wt%) Cu-MOF, and (GO 8 wt%) Cu-MOF, respectively, for the OER. Based on the Tafel plot (Fig. 5b), the exchange current density (i0) is calculated to be 9.5 × 10⁻¹² A·cm−2 for the HKUST-1, illustrating that the OER on HKUST-1 is highly irreversible. The significant electrocatalytic activity of the HKUST-1 towards OER can be attributed to the small particle size and high specific surface area of the HKUST-1.
52
Up to now, there have been no reports of OER for HKUST-1 yet.
to the electrode is rate determining step. In Fig. 5c, the above processes have been presented for HKUST-1. The Tafel slope obtained for HKUST-1 is close to the values reported for RuO2 and IrO2, which are the benchmark catalysts for the OER.
49,50
Loh et al. synthesized a Cu-MOF from copper nitrate trihydrate, 1,4-benzenedicarboxylic acid and triethylene-diamine in the presence of different amounts of graphene oxide (GO) and measured their oxygen evolution performance in acidic solution.
51
They reported the Tafel slope values of 89, 71 and 65 mV·dec−1 for Cu-MOF, (GO 6 wt%) Cu-MOF, and (GO 8 wt%) Cu-MOF, respectively, for the OER. Based on the Tafel plot (Fig. 5b), the exchange current density (i0) is calculated to be 9.5 × 10⁻¹² A·cm−2 for the HKUST-1, illustrating that the OER on HKUST-1 is highly irreversible. The significant electrocatalytic activity of the HKUST-1 towards OER can be attributed to the small particle size and high specific surface area of the HKUST-1.
52
Up to now, there have been no reports of OER for HKUST-1 yet.

Figure 5. (a) Linear sweep voltammogram (LSV); (b) the linear region of polarization curve (Tafel plot) for HKUST-1 in 0.1 M aqueous NaOH solution; (c) schematic representation of the first and second steps of water oxidation mechanism (Atom color scheme: H, silver; C, brown; O, red; Cu, blue).
Download figure:
Standard image High-resolution imageFor investigating HER in more detail, the CVs were measured and presented in Fig. 6. The two cathodic peaks were observed at about 0.52 V and 0.18 V vs RHE, which can be attributed to the reduction of Cu(II)/Cu(I) and Cu(I)/Cu(0), respectively. 53 On the other hand, our previous studies showed that the HER occurs on the Cu surface with zero oxidation state. 54,55
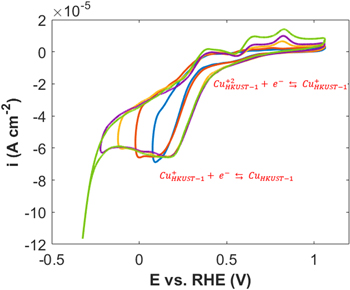
Figure 6. Cyclic voltammograms (CVs) with different end potentials for HKUST-1 in 0.1 M NaOH.
Download figure:
Standard image High-resolution imageThe HER activity was measured by LSV in a 0.1 M aqueous NaOH solution at scan rate of 10 mV·s−1 (Fig. 7a) where the dashed line demonstrates the standard potential of HER. Figure 7a shows the LSVs for HER in present and absent of CO2 bubbling conditions. The sharp drops of potential are related to the HER, and an overpotential of 0.45 V at a current density of -1 mA·cm−2 was obtained for HER on the surface of nanostructured HKUST-1. The HER kinetic parameters of HKUST-1 were determined from Tafel plot (Fig. 7b). The Tafel slope is 190 mV·dec−1 for HKUST-1, indicating that the Volmer step in HER mechanism acts as the RDS: 56,57


Figure 7. (a) LSV for HKUST-1 in 0.1 M NaOH aqueous solution with and without CO2 addition; (b) the linear region of polarization curve (Tafel plot) for HKUST-1 in CO2−saturated 0.1 M NaOH.
Download figure:
Standard image High-resolution image
Considering  instead of 0.5, Volmer step could be considered as RDS. In fact, the electrocatalyst should break the strong H–O–H bond prior to adsorb H* in alkaline solutions and thus, the Volmer step has a high activation energy compared to the other steps and becomes RDS.
56
Tian et al. prepared HKUST-1 from CuCl2 and 1,3,5-trimesic acid by the electrochemical deposition (ED) and hydrothermal (HT) methods.
58
They reported Tafel slopes of 183.6 and 222.4 mV·dec−1 for HKUST-1 ED and HKUST-1 HT, respectively, for the HER in an acidic solution. Based on the Tafel plot (Fig. 7b), the i0 was calculated to be 3.7 × 10⁻⁶ A·cm−2 for the KHUST-1. Wu et al. prepared the Cu.BTC by mixing Cu(OAc)2 and 1,3,5-benzenetricarboxylic acid in the presence of a mixture of DMF, H2O and ethanol at room temperature, then investigated the hydrogen evolution performance in 0.5 M H2SO4 solution, and reported the i0 value of 2.3 × 10⁻⁷ A·cm−2 for the Cu.BTC.
59
Raoof et al. synthesized the Cu3(BTC)2 by using a hydrothermal method and used toward the hydrogen production; they reported the i0 value of 9.2 × 10⁻⁷ A·cm−2 for the Cu3(BTC)2 in acidic solution.
60
instead of 0.5, Volmer step could be considered as RDS. In fact, the electrocatalyst should break the strong H–O–H bond prior to adsorb H* in alkaline solutions and thus, the Volmer step has a high activation energy compared to the other steps and becomes RDS.
56
Tian et al. prepared HKUST-1 from CuCl2 and 1,3,5-trimesic acid by the electrochemical deposition (ED) and hydrothermal (HT) methods.
58
They reported Tafel slopes of 183.6 and 222.4 mV·dec−1 for HKUST-1 ED and HKUST-1 HT, respectively, for the HER in an acidic solution. Based on the Tafel plot (Fig. 7b), the i0 was calculated to be 3.7 × 10⁻⁶ A·cm−2 for the KHUST-1. Wu et al. prepared the Cu.BTC by mixing Cu(OAc)2 and 1,3,5-benzenetricarboxylic acid in the presence of a mixture of DMF, H2O and ethanol at room temperature, then investigated the hydrogen evolution performance in 0.5 M H2SO4 solution, and reported the i0 value of 2.3 × 10⁻⁷ A·cm−2 for the Cu.BTC.
59
Raoof et al. synthesized the Cu3(BTC)2 by using a hydrothermal method and used toward the hydrogen production; they reported the i0 value of 9.2 × 10⁻⁷ A·cm−2 for the Cu3(BTC)2 in acidic solution.
60
Finally, we investigated the electrochemical reduction of CO2. The CO2 bubbling decreases the pH of the electrolyte, which affects the existence of the dissolved carbonaceous species (CO2, H2CO3,  and
and  ) because the distribution of these species is dependent on the pH of the electrolyte.
61
Therefore, CO2 was bubbled into 0.1 M NaOH to reach the desirable pH value of 7 because only in the pH range from 7 to 8, can the electrochemical reduction of CO2 be advantageous.
61
Fujii et al. reported that the
) because the distribution of these species is dependent on the pH of the electrolyte.
61
Therefore, CO2 was bubbled into 0.1 M NaOH to reach the desirable pH value of 7 because only in the pH range from 7 to 8, can the electrochemical reduction of CO2 be advantageous.
61
Fujii et al. reported that the  is the predominant anion in the pH region between 7.5 and 9.
62
Figure 7a illustrates a comparison between the LSVs of hydrogen evolution in the presence and absence of CO2 bubbling for HKUST-1 in a 0.1 M aqueous NaOH solution with a scan rate of 10 mV·s−1. It is clear that HER needs a higher overpotential in the presence of CO2 bubbling, for example, at a constant current density of −1 mA·cm−2 it requires a more over potential,
is the predominant anion in the pH region between 7.5 and 9.
62
Figure 7a illustrates a comparison between the LSVs of hydrogen evolution in the presence and absence of CO2 bubbling for HKUST-1 in a 0.1 M aqueous NaOH solution with a scan rate of 10 mV·s−1. It is clear that HER needs a higher overpotential in the presence of CO2 bubbling, for example, at a constant current density of −1 mA·cm−2 it requires a more over potential,  of 0.33 V compared to the absence of CO2 bubbling case. Actually, it has been reported in CO2 reduction process a competitive adsorption exists between H2O and CO2 or
  if the formers win this competition then CO2 molecules or
  will have a poisoning effect for the HER.
63,64
Because in such case adsorption of CO2 molecules decreases the surface coverage of the adsorbed species that participate in the HER,
63
and leads to higher overpotentials. Also, the adsorption of the produced intermediates in the process of CO2 reduction on the same sites of HER can lead to a poisoning effect for the HER, thus there will be the production of hydrocarbons, alcohols and carbon monoxide in such a situation.
65,66
However, it is the electrocatalyst that determines which one is the winner of this competition. The more the
will have a poisoning effect for the HER.
63,64
Because in such case adsorption of CO2 molecules decreases the surface coverage of the adsorbed species that participate in the HER,
63
and leads to higher overpotentials. Also, the adsorption of the produced intermediates in the process of CO2 reduction on the same sites of HER can lead to a poisoning effect for the HER, thus there will be the production of hydrocarbons, alcohols and carbon monoxide in such a situation.
65,66
However, it is the electrocatalyst that determines which one is the winner of this competition. The more the  the better the electrocatalyst for CO2RR. For our case, HKUST-1, Grajciar et al. showed that the copper nodes are the more favorable sites for both water and CO2 adsorption using DFT calculations.
67,68
Thus, CO2–species and hydrogen participate in competitive adsorption which the adsorption of CO2 is more favorable regards to
the better the electrocatalyst for CO2RR. For our case, HKUST-1, Grajciar et al. showed that the copper nodes are the more favorable sites for both water and CO2 adsorption using DFT calculations.
67,68
Thus, CO2–species and hydrogen participate in competitive adsorption which the adsorption of CO2 is more favorable regards to  We have already reported the similar observation for copper compounds containing CuO, CuMoO4, Cu3Mo2O9 and CuWO4.
54,55
Also, the LSV of HER in the presence of CO2 bubbling shows a cathodic peak around −0.25 V vs RHE before the sharp drop of potential for HER, which could be attributed to the adsorption and reduction of CO2–species. Wu et al., who studied the adsorption of CO2, H2CO3,
We have already reported the similar observation for copper compounds containing CuO, CuMoO4, Cu3Mo2O9 and CuWO4.
54,55
Also, the LSV of HER in the presence of CO2 bubbling shows a cathodic peak around −0.25 V vs RHE before the sharp drop of potential for HER, which could be attributed to the adsorption and reduction of CO2–species. Wu et al., who studied the adsorption of CO2, H2CO3,  and
and  on the surface of Cu2O, reported that the more favorable CO2–Species for adsorption on the surface of copper is
  69
which could produce more stable carbon content materials formate and methanol.
70
Kumar et al. prepared Cu3(BTC)2 by the electrochemical method and then investigated the electrocatalytic reduction of CO2 on the Cu3(BTC)2 in the DMF/TBATFB solution with saturated CO2. In that study they observed that the reduction process starts at approximately −1.12 V (vs Ag/Ag+) and is associated with the reduction of CO2.
71
To explore the electrokinetic pathway for the CO2RR, the Tafel plot for HKUST-1 was obtained in CO2–saturated 0.1 M NaOH (Fig. 7b). The Tafel slope and i0 of HKUST-1 were determined to be 331 mV dec−1 and 4.2 × 10⁻⁶ A cm−2, respectively. Li et al. synthesized Cu3(BTC)2 (Cu-MOF) in the mixed solvent of DMF/EtOH/H2O for 24 h in static conditions under circulating condensation at 85 °C and then reported the surface area of 728 m2 g−1 for Cu-MOF.
72
Thereafter, the produced Cu-MOF was introduced into carbon paper based gas diffusion electrodes (GDE) for CO2 capture. They investigated the electrochemical reduction of CO2 on the GDE-CuMOF-10 (10 wt% Cu-MOF) in a 0.5 M aqueous NaHCO3 solution and obtained the Tafel slope of 113 mV dec−1.
69
which could produce more stable carbon content materials formate and methanol.
70
Kumar et al. prepared Cu3(BTC)2 by the electrochemical method and then investigated the electrocatalytic reduction of CO2 on the Cu3(BTC)2 in the DMF/TBATFB solution with saturated CO2. In that study they observed that the reduction process starts at approximately −1.12 V (vs Ag/Ag+) and is associated with the reduction of CO2.
71
To explore the electrokinetic pathway for the CO2RR, the Tafel plot for HKUST-1 was obtained in CO2–saturated 0.1 M NaOH (Fig. 7b). The Tafel slope and i0 of HKUST-1 were determined to be 331 mV dec−1 and 4.2 × 10⁻⁶ A cm−2, respectively. Li et al. synthesized Cu3(BTC)2 (Cu-MOF) in the mixed solvent of DMF/EtOH/H2O for 24 h in static conditions under circulating condensation at 85 °C and then reported the surface area of 728 m2 g−1 for Cu-MOF.
72
Thereafter, the produced Cu-MOF was introduced into carbon paper based gas diffusion electrodes (GDE) for CO2 capture. They investigated the electrochemical reduction of CO2 on the GDE-CuMOF-10 (10 wt% Cu-MOF) in a 0.5 M aqueous NaHCO3 solution and obtained the Tafel slope of 113 mV dec−1.
Summary and Conclusions
In summary, metal organic framework (HKUST-1) was synthesized using 1,3,5 benzenetricarboxylic acid (H3BTC) and copper (II) chloride in distilled water. In addition to the two advantages: using environmental friendly reactants instead of any toxic solvents and synthesis at room temperature (a mild condition), the developed synthesis method under these conditions allows producing MOFs in large–scale for practical applications. Voltammetry and electrochemical impedance experiments were performed using a working electrode that was prepared by the electrophoretic deposition of HKUST-1 on the surface of a stainless steel electrode. The flat–band potential (Vfb) obtained from Mott–Schottky analysis for HKUST-1 is −0.51 V vs Ag/AgCl (+0.46 V vs RHE), and the conduction band and valence band potential of HKUST-1 were calculated to be −4.96 eV and −7.46 eV, respectively. The slope of Tafel plot (53 mV·dec−1) suggests that the rate–determining step in the OER consists of a one–electron transfer process. LSV of HKUST-1 shows that CO2 was reduced at approximately −0.25 V vs RHE, and the Tafel slope and i0 of HKUST-1 in CO2–saturated 0.1 M NaOH were determined to be 331 mV dec−1 and 4.2 × 10⁻⁶ A cm−2, respectively. The synthesis of functional MOF without using toxic solvents can provide useful information to the green chemistry. The study of HKUST-1 as an electrocatalyst in water splitting and CO2 reduction may have long term impact on the clean–energy and environmental related research.
Acknowledgments
H. F. acknowledges the financial support from University of Birjand, Z. L. acknowledges the financial support from American Chemical Society (ACS)-Petroleum Research Fund (PRF# 61453-UR5) and Indiana Academy of Science (IAS) Senior Research Grant. Authors thank Jacob Wade at Ball State University for revising the manuscript.