
Abstract
Dual-carbon batteries (DCBs), in which both the positive and negative electrodes are composed of carbon-based materials, are promising next-generation batteries owing to their limited usage of scarce metals and high operating voltages. In typical DCBs, metal cations and anions in the electrolytes are consumed simultaneously at the negative and positive electrodes, respectively, which can rapidly deplete the charge carrier ions in the electrolytes. In this study, to solve this challenge, we focused on ionic liquids (ILs) as DCB electrolytes because they are solely composed of ions and are therefore intrinsically highly concentrated electrolytes. Charge–discharge behavior of the graphite positive electrodes was investigated in several IL electrolytes containing alkali metal cations (Li+, Na+, and K+) and amide anions (FSA− and FTA−; FSA = bis(fluorosulfonyl)amide, FTA = (fluorosulfonyl)(trifluoromethylsulfonyl)amide). It was found that FTA-based ILs conferred superior cycling stability and higher capacities to graphite electrodes compared to FSA-based ILs, which was explained by the suppression of the corrosion of the aluminum current collector at high voltages. The highest reversible capacity of approximately 100 mAh g−1 was obtained for the K-ion system using FTA-based ILs at 20 mA g−1, which involved the formation of FTA–graphite intercalation compounds, as confirmed by ex situ X-ray diffraction.
Export citation and abstract BibTeX RIS

This is an open access article distributed under the terms of the Creative Commons Attribution Non-Commercial No Derivatives 4.0 License (CC BY-NC-ND, http://creativecommons.org/licenses/by-nc-nd/4.0/), which permits non-commercial reuse, distribution, and reproduction in any medium, provided the original work is not changed in any way and is properly cited. For permission for commercial reuse, please email: permissions@ioppublishing.org.
Owing to the impact of environmental issues such as global warming over the last several decades, the need to transition from fossil fuels to renewable energy as the primary energy source has become a matter of great urgency. However, the production of energy from renewable resources depends heavily on the climate and geographical features. Thus, the development of rechargeable batteries is of great interest, particularly for large-scale applications in combination with renewable energy power plants. 1,2 Lithium-ion batteries (LIBs) are representative rechargeable batteries owing to their high energy densities and are therefore widely used as portable power sources. However, the flammable organic solvents in LIBs pose a major safety risk, which increases for large-scale applications, owing to the decrease in the specific surface area for releasing heat. 3 Furthermore, in terms of resource availability, cobalt and lithium, which are used in the positive electrodes and electrolytes of LIBs, are present in small reserves, especially for cobalt, and they are unevenly distributed worldwide, which hinders the mass production of large-scale LIBs. 4
Ionic liquids (ILs) are increasingly attracting attention as battery electrolytes because of their nonflammability and negligible volatility, which can mitigate potential safety issues. 5–8 Meanwhile, with sodium and potassium being more abundant and ubiquitous in the Earth's crust than lithium, many researchers have devoted their efforts to developing Na-ion batteries (NIBs) and K-ion batteries (KIBs), wherein Na+ and K+ ions act as the charge carriers. 9,10 Considering these factors, we investigated the contribution of IL electrolytes composed of the amide anions FSA− and FTA− (FSA = bis(fluorosulfonyl)amide; FTA = (fluorosulfonyl)(trifluoromethylsulfonyl)amide) when used in NIBs and KIBs. 11–17
Another solution to avoid the use of rare metals is to change the charge carrier from metal cations to anions and the positive electrodes from ordinary metal oxides to carbon-based materials by constructing dual-carbon batteries (DCBs). In typical DCBs, the insertion/extraction of metal cations occurs at the negative electrode, whereas the positive electrode functions via anion intercalation/deintercalation. DCBs are classified as "reserve-type" batteries consuming the components of electrolytes during charging and discharging, and are different from "rocking chair-type" batteries such as LIBs, NIBs, and KIBs. Historically, studies have been conducted on DCBs using organic solvent-based electrolytes, 18–21 which mainly involves the intercalation/deintercalation of PF6 − or amide anions (FSA− or TFSA−; TFSA = bis(trifluoromethylsulfonyl)amide) into/from graphite positive electrodes to form graphite intercalation compounds (GICs). However, a major drawback of organic solvent-based electrolytes is their low concentration of charge carriers. Consequently, charge carrier ions are easily depleted during charging, which can lead to large polarization and solvent decomposition. Thus, our group focused on investigating the performance of ILs as DCB electrolytes because they are composed only of cations and anions, providing ample charge carriers. After a pioneering study on DCBs with AlCl4 −-based IL electrolytes, 22 anion intercalation chemistry in several types of IL electrolytes has been investigated over the past decade. 23–28 A popular anion used with graphite positive electrodes is the TFSA− anion, whose intercalation behavior has been well studied using IL electrolytes with different alkali metal cations. For example, in 1 M (= mol dm−3) Li[TFSA]–[C4C1pyrr][TFSA] electrolyte (C4C1pyrr = N-butyl-N-methylpyrrolidinium), charge–discharge test of a Li/graphite half-cell exhibited a discharge capacity of 115 mAh g−1 and stable cycling at 333 K. 24 Furthermore, electrochemical measurement in 0.7 M Na[TFSA]–[C4C1pyrr][TFSA] IL electrolyte confirmed a discharge capacity over 70 mAh g−1 for the initial 15 cycles. However, the capacity subsequently decreased and attained only 10 mAh g−1 after 60 cycles. 25 In a potassium-based system, charge–discharge tests of K/graphite half-cells in 0.3 M K[TFSA]–[C4C1pyrr][TFSA] with the addition of 2 wt% ethylene sulfite (ES) were conducted, 26 resulting in stable reversible cycling for 50 cycles with a discharge capacity of approximately 45 mAh g−1. The K/graphite cell also showed excellent stability, even under high-rate conditions of 250 mA g−1. In addition, the effects of the anion species on the charge–discharge behavior were partly investigated using Li-based IL electrolytes, 27,28 which showed that the size of the anions has minimal effect on the charge–discharge performance. However, pure TFSA-based ILs have also been reported to be incompatible with graphite negative electrodes, which remains a challenge for their utilization as electrolytes in DCB full cells. 7 Moreover, no systematic performance comparison has been performed using IL electrolytes with different combinations of metal cations and amide-based anions.
In this study, the charge–discharge behavior of graphite positive electrodes in M[FSA]–[C3C1pyrr][FSA] and M[FTA]–[C4C1pyrr][FTA] electrolytes (M = Li, Na, K; C3C1pyrr = N-methyl-N-propylpyrrolidinium) were compared as a basic study for the construction of DCBs using IL electrolytes. Ex-situ X-ray diffraction (XRD) measurements were performed to clarify the structural evolution behavior of the graphite electrodes during charging and discharging in each electrolyte. To further examine the differences in charge–discharge behavior, corrosion resistance tests of the Al current collector at high cell voltages were also conducted. Finally, the detailed electrochemical behavior of graphite positive electrodes was investigated for the most promising electrolyte.
Experimental
[C3C1pyrr][FSA] IL and Li[FSA] salt were purchased from Kanto Chemical Co., Ltd and Kishida Chemical Co., Ltd, respectively. Na[FSA] and K[FSA] salts were supplied by Nippon Shokubai Co., Ltd. [C4C1pyrr][FTA] IL and M[FTA] salts (M = Li, Na, and K) were purchased from Provisco CS., Ltd. The ILs and salts were vacuum-dried at 333 K for 1 d in a vacuum line before use. M[FSA]–[C3C1pyrr][FSA] and M[FTA]–[C4C1pyrr][FTA] were prepared by mixing these ILs and salts at a composition of x(M[X]) = 0.20 (x(M[X]): molar fraction of M[X]; X = FSA, FTA).
Electrochemical measurements were performed using 580 Battery Test System (Scribner Associations, Inc.). To investigate the electrochemical behavior of the graphite positive electrode, 2032-type two-electrode coin cells or three-electrode cells were constructed in an argon-filled glovebox. In this study, the capacities and current densities are expressed based on the weight of the graphite in the working electrode. For the two-electrode system, charge–discharge tests were conducted on M/M[X]–[Ocat][X]/graphite cells (Ocat = Cn C1pyrr; n = 3, 4). The graphite composite electrodes used as working electrodes were prepared as follows. Commercially available graphite powder (SNO-10, SEC Carbon, particle size: 10 μm) and an aqueous solution containing 2 wt% carboxymethyl cellulose (CMC; #2200, Daicel Miraizu Ltd) were mixed at a composition of graphite/CMC = 93:7 in weight. The slurry was prepared by stirring for 30 min and casting on an Al foil. The obtained electrode sheet was dried in a vacuum oven at 353 K for 3 h, and then vacuum-dried overnight at 373 K. The diameter of the electrode after punching out was 10 mm, and the average loading mass of graphite was 2.5 mg cm−2. Lithium metal (Honjo Chemical Co., Ltd, 99.98% purity), sodium (Sigma-Aldrich Co., LLC., 99.95% purity), or potassium metal (Kojundo Chemical Laboratory Co., Ltd, 99.5% purity; or Sigma-Aldrich Co., LLC., 98% purity) was used as the counter electrode. A two-ply glass fiber filter separator (Whatman, grade GF/A, thickness: 260 μm) and graphite electrode were vacuum-impregnated with electrolytes in a vacuum line at 333 K for 24 h prior to coin-cell fabrication. The amounts of electrolyte in the electrochemical cells were approximately 100 μl for coin cells and 250 μl for three-electrode cells. The cut-off voltages of the charge–discharge tests were set considering the redox potentials of the alkali metals in these ILs, as shown in Table I.
Table I. Comparison of cut-off voltages and discharge capacities of 1st and 5th cycles of M/graphite coin cells using various electrolytes.
| M[FSA]–[C3C1pyrr][FSA] | M[FTA]–[C4C1pyrr][FTA] | ||||||
|---|---|---|---|---|---|---|---|
| M = Li | M = Na | M = K | M = Li | M = Na | M = K | ||
| Cut off voltage | 3.4–4.9 V | 3.3–4.9 V | 3.5–5.15 V | 3.4–5.2 V | 3.3–5.0 V | 3.6–5.4 V | |
| Discharge capacity/mAh g−1 | 1st | 29 | 80 | 26 | 103 | 89 | 95 |
| 5th | 23 | 80 | 20 | 97 | 90 | 98 | |
To precisely determine the anion intercalation/deintercalation potentials, charge–discharge tests were also conducted in a three-electrode cell composed of a graphite composite electrode as the working electrode and alkali metals as both the counter and reference electrodes. The potentials were calibrated with respect to the ferrocenium/ferrocene redox couple (Fc+/Fc). The detailed procedures are described in Supplementary Information.
Ex-situ XRD measurements were performed to investigate anion-GIC formation during charging and discharging using an X-ray diffractometer (XRD; Rigaku, Ultima IV) with Cu-Kα rays (wavelength λ = 1.5418 Å). The samples were collected by disassembling the coin cells in a glovebox and then transferred to the X-ray diffractometer under an argon atmosphere using an airtight sample holder.
The corrosion behavior of the aluminum current collector was investigated using coin cells. First, the Al foil was punched to a diameter of 10 mm and dried at 373 K for 24 h in a vacuum line to be used as the working electrode. Alkali metals suitable for the respective electrolytes were used as counter electrodes. Chronoamperometric experiments were conducted on these cells to obtain transient current curves. For the Li system, the cells were first polarized at 4.4 V for 3 h, then held at 4.7 V for 3 h, and then further held at 5.0 V for 72 h. For the Na system, the cell voltage was initially set at 4.3 V for 3 h, then changed to 4.6 V for 3 h, and then maintained at 4.9 V for 72 h. For the K system, the cell voltage was initially set at 4.6 V for 3 h, then changed to 4.9 V for 3 h, and then held at 5.2 V for 72 h.
Results and Discussion
FSA-based IL electrolytes
To investigate the graphite intercalation/deintercalation behavior of the FSA anions, charge–discharge tests were conducted for 5 cycles using M/graphite coin cells (M = Li, Na, and K) with M[FSA]–[C3C1pyrr][FSA] (x = 0.20) IL electrolytes. In addition, the structural changes in graphite were analyzed using ex situ XRD measurements of the graphite electrodes charged to the upper cut-off voltages, as shown in Table I. To assign the obtained XRD patterns to stage-n GICs (n: stage index), calculations are performed as follows. First, the d-spacing (d) is obtained based on Bragg's equation:

where λ is the wavelength of the X-ray radiation (1.5418 Å) and θ is the diffraction angle. The stage index (n) is then determined using the following equation:

where Ic is the repeat unit distance including the graphene layer and the layer forming GIC, d0 is the distance between pristine graphene layers (3.35 Å), and di is the interlayer distance between the layers in which intercalants are present.
Figure 1 shows the charge–discharge curves of the graphite positive electrodes in M/graphite half-cells with FSA-based IL electrolytes and the XRD patterns of the graphite electrodes charged to the upper cut-off voltages. In the Li[FSA]–[C3C1pyrr][FSA] electrolyte (Fig. 1a), the graphite positive electrode exhibits an initial charge capacity of 60 mAh g−1, which is accompanied by two plateau regions at approximately 4.6 and 4.8 V. In contrast, the initial discharge curve mainly consists of one plateau at 4.1 V, exhibiting an initial discharge capacity of 29 mAh g−1. Thus, the initial coulombic efficiency as low as 49% is obtained, possibly due to the irreversible decomposition of the electrolyte such as the formation of solid electrolyte interphase (SEI) on the electrode surface. Similar behavior is observed after the 2nd cycle, except for the shrinkage of the charging plateau at 4.6 V, and the 5th discharge capacity is found to be 23 mAh g−1. As illustrated in Fig. 1d, the graphite electrode charged to 4.9 V in the Li[FSA]–[C3C1pyrr][FSA] electrolyte exhibits two prominent peaks at approximately 23.2° and 31.7°, which are different from the 002 diffraction peak of graphite (26.6°) 29 observed for the pristine electrode. These diffraction peaks can be attributed to stage-2 GICs with di = 8.2 Å using Eqs. 1 and 2, which is almost consistent with previous studies on FSA-GIC formation. 21 Furthermore, as shown in Figs. S1a and S2a, when the upper cut-off voltage was set to 5.2 V, graphite finally changed into stage-1 FSA-GIC at the full-charged state; however, the graphite electrode exhibits more unstable charge–discharge behavior and loses its capacity after 5 cycles, which is probably due to the severe electrode degradation at higher voltages.
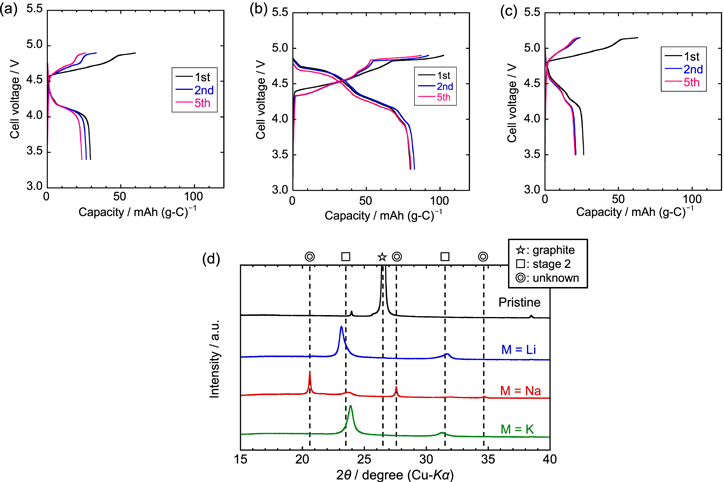
Figure 1. Charge–discharge curves of graphite electrodes in M/graphite half-cells using the IL electrolyte M[FSA]–[C3C1pyrr][FSA] (x(M[FSA]) = 0.20) at a current density of 20 mA g−1 at 298 K. M = (a) Li, (b) Na, (c) K. (d) XRD patterns at upper cut-off voltages. The vertical broken lines of the stage-2 compound correspond to the diffraction angles of the GIC with di = 8.0 Å.
Download figure:
Standard image High-resolution imageIn the case of the Na[FSA]–[C3C1pyrr][FSA] electrolyte (Fig. 1b), the charge–discharge behavior was completely different from that of its Li-based counterpart. The charge–discharge curves are composed of a multi-step plateau region that overlaps each other for 5 cycles, indicating the stable and reversible reactions of the graphite electrode. In the 1st cycle, the discharge capacity is 80 mAh g−1 with a coulombic efficiency of 78%, which is larger than the capacity of the Li-based electrolyte, and approximately the same values are retained after 5 cycles. Notably, while the initial charge capacity appears around 4.4 V, the onset potential is slightly lower (4.3 V) after the 2nd cycle, which can be attributed to an activation process arising from the kinetic hindrance of the graphite electrode in the 1st cycle. As shown in Fig. 1d, the XRD pattern of the graphite electrode charged to 4.9 V mainly comprises three sharper peaks at 20.6°, 27.6°, and 34.7° and two broader peaks at approximately 23.7° and 31.9°. Although the broader peaks are assigned to stage-2 FSA-GIC with di = 7.9 Å as in the case of the Li-based electrolyte, the di values of the sharper peaks are calculated to be greater than 8 Å, which has not been previously reported. Assuming that these unknown peaks can be attributed to the formation of stage-1 or stage-2 GICs, the di values obtained are 12.9 or 9.6 Å, respectively. As described in Figs. S1b and S2b, graphite completely transforms into an unknown phase at 5.0 V. Furthermore, the graphite electrode shows relatively stable cycling behavior even at an upper cut-off voltage of 5.0 V. One of the possible reasons for this behavior is the different liquid structure of Na[FSA]–[C3C1pyrr][FSA] such as the complex ion state (e.g., [Na(FSA)n ]1−n ) in the vicinity of the graphite electrode surface compared to that of other FSA-based ILs. The details of this interesting behavior will be investigated in the near future.
In the K[FSA]–[C3C1pyrr][FSA] electrolyte, as shown in Fig. 1c, the graphite electrode exhibits charge–discharge behavior similar to that of its Li-based counterpart. The initial charge and discharge capacities are 63 and 26 mAh g−1, respectively, resulting in a coulombic efficiency as low as 42%. Then, the discharge capacity decreases to 21 mAh g−1 in the 2nd cycle, and remains the same till the 5th cycle. The onset potential in the charging process of the 1st cycle is approximately 4.8 V, and the potential plateaus appear at approximately 4.8 and 5.1 V, which corresponds well with the reaction potential considering the potential difference between lithium and potassium. 14 The XRD pattern of the graphite electrode charged to 5.15 V consists of two peaks around 23.9° and 31.4°, which are similar positions as those of the Li-system, thus indicating the formation of stage-2 FSA-GIC with di = 7.8 Å. Although stage-1 FSA-GIC is formed in the charged state when the graphite electrode is charged to 5.4 V, the reversible capacities are approximately 50 mAh g−1 with a large voltage polarization (See Figs. S1c and S2c).
FTA-based IL electrolytes
To ascertain the charge–discharge mechanism of graphite positive electrodes in FTA-based IL electrolytes, charge–discharge tests were conducted using M[FTA]–[C4C1pyrr][FTA] (x(M[FTA]) = 0.20) ILs, followed by XRD measurements at the full-charged states. Figures 2a–2c show the charge–discharge curves of the graphite electrodes in the Li-, Na-, and K-based ILs, respectively, for the initial 5 cycles. Overall, the graphite electrodes exhibit similar charge–discharge behavior in all the electrolytes, where the charge–discharge curves consist of a multi-step plateau region, suggesting the reversible formation of FTA-GICs. The initial charge capacities are 141, 140, and 133 mAh g−1 for the Li, Na, and K systems, respectively. The XRD results (Fig. 2d) indicate that the graphite electrodes in their full-charged states are mainly composed of stage-1 FTA-GIC with di = 8.0 Å for all the systems, which is consistent with the results of previous studies. 27 Small amount of stage-2 FTA-GIC remains in the case of the Na system, corresponding to a smaller initial discharging capacity as described below. In addition, the di values of FTA-GIC are almost equal for all FTA-based electrolytes, which is different from the case of FSA-based electrolytes (See also Fig. 1d), suggesting that the charge–discharge mechanism is not identical for different amide anions.

Figure 2. Charge–discharge curves of graphite electrodes in M/graphite half-cells using the IL electrolyte M[FTA]–[C4C1pyrr][FTA] (x(M[FTA]) = 0.20) at a current density of 20 mA g−1 at 298 K. M = (a) Li, (b) Na, (c) K. (d) XRD patterns at upper cut-off voltages. The vertical broken lines of the stage-1 and −2 compounds correspond to the diffraction angles of the GICs with di = 8.0 Å.
Download figure:
Standard image High-resolution imageThe initial discharge capacity and coulombic efficiency are 103 mAh g−1 and 73% for the Li system, 89 mAh g−1 and 64% for the Na system, and 95 mAh g−1 and 71% for the K system. In all cases, larger capacities are obtained compared to those obtained using FSA-based electrolytes, which is attributable to the long voltage plateau appearing in the highest voltage region. Concerning the cycling stability, a slight capacity decrease is observed in the Li system; the discharge capacity is 97 mAh g−1 in the 5th cycle, with a capacity retention of 94%. In contrast, for the Na and K systems, the charge–discharge curves almost overlap each other for 5 cycles, with discharge capacities of 89–90 mAh g−1 and 95–98 mAh g−1, respectively. The performance of the graphite positive electrodes is summarized in Table I. From the above, it can be affirmed that the K[FTA]–[C4C1pyrrr][FTA] electrolyte is the most suitable for the graphite positive electrodes among all electrolytes, including FSA-based ILs.
Comparison of charge–discharge performance
To discuss the common features and differences in the graphite positive electrode performance in the ILs, charge–discharge measurements were performed using a three-electrode cell with the corresponding alkali metal used as the reference electrode. Figure 3a displays the charge–discharge curves of the graphite positive electrode at the 2nd cycle in the FSA-based electrolytes operated at 20 mA g−1 with respect to the Li+/Li potential, which is calibrated by the redox potential of the alkali metals in the FSA-based ILs. 14 The onset potential of charging begins at approximately 4.5 V in all the systems, which suggests that FSA− anions in the electrolyte are intercalated between the graphene layers at a similar potential to form anion-GICs. However, in the Li and K systems, the potential polarization during charging is higher than that in the Na system, leading to lower charge–discharge capacities. In addition, during the discharge process, the potential plateau appears at approximately 4.8 V in the Na system, whereas it is absent in the Li and K systems, indicating that the charging plateau at 4.95 V observed in the Na-based electrolyte is reversible.

Figure 3. Charge–discharge curves of graphite positive electrodes using three-electrode cells with the IL electrolytes (a) M[FSA]–[C3C1pyrr][FSA] (x(M[FSA]) = 0.20) and (b) M[FTA]–[C4C1pyrr][FTA] (x(M[FTA]) = 0.20) at a current density of 20 mA g−1 at 298 K (M = Li, Na, K). Cycle number: 2. The potentials were calibrated to the Li+/Li potential based on our previous study 14,15 and the redox potentials of the ferrocenium/ferrocene provided in Supplementary Information. (c) Comparison of charge–discharge curves in Na-based IL electrolytes.
Download figure:
Standard image High-resolution imageSimilar tests were conducted for the M[FTA]–[C4C1pyrr][FTA] electrolytes, as shown in Fig. 3b. The potentials are calibrated based on the redox potentials of the alkali metals in the FTA-based ILs. 15 Evaluation using three-electrode cells reveals that the charge–discharge curves showed a similar trend for all systems after potential calibration. The onset potentials are around 4.5 V vs Li+/Li, which is close to that of FSA-based electrolytes. Furthermore, the plateau potential appears at approximately 5.0 V vs Li+/Li for all the electrolytes. The discharge curves consist of three gentle plateaus, whereas only two plateaus are observed for the Na[FSA]–[C3C1pyrr][FSA] electrolyte. In conclusion, the intercalation/deintercalation potentials of amide anions are found to be common and independent of the anionic species and metal cations present in the IL electrolytes.
Figure 3c shows the comparison of the charge–discharge curves of the graphite electrodes in the 2nd cycle in the Na[FSA]–[C3C1pyrr][FSA] and Na[FTA]–[C4C1pyrr][FTA] IL electrolytes. The potentials are calibrated to the Fc+/Fc redox couple, as described in Supplementary Information. Long plateaus during charging and discharging processes are seen at 1.7–1.8 V vs Fc+/Fc for both systems, which is characteristic of the formation of amide anion GICs, suggesting that FSA-GIC and FTA-GIC are likely to form at similar potentials. Several potential plateaus corresponding to higher-stage GICs are also observed below the long plateaus. However, the staging mechanism does not seem necessarily identical because a distinct plateau is observed at 0.8 V vs Fc+/Fc for the FTA-based IL whereas it is absent for the FSA-based IL.
To further explain the effect of the electrolytes on the performance of the graphite positive electrodes, chronoamperometric measurements were conducted on the Al current collector in the FSA- and FTA-based IL electrolytes, as shown in Fig. 4. Stepwise constant voltages were applied to the M/Al two-electrode coin cells to simulate the charge–discharge profiles of the graphite positive electrode, as described in the experimental section. In the Li[FSA]–[C3C1pyrr][FSA] electrolyte (Fig. 4a), the anodic current density increases during the initial 6 h when higher voltages are applied to the cell. At a constant voltage of 5.0 V, the current density is initially approximately 7 μA cm−2 and is stabilized at a value as high as 6 μA cm−2 after 72 h. In contrast, for the Li[FTA]–[C4C1pyrr][FTA] IL, no substantial change in the current density is observed, except for a short period immediately after the potential steps. The anodic current densities are suppressed to a low value of approximately 0.5 μA cm−2 during the entire period.
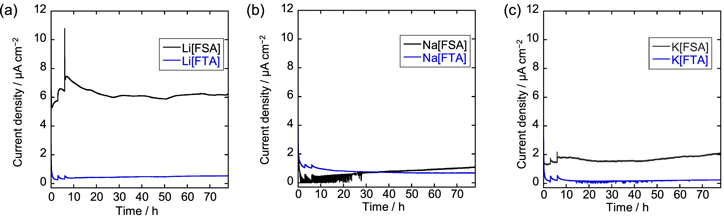
Figure 4. Chronoamperometric curves of aluminum foils at constant voltages in M[FSA]–[C3C1pyrr][FSA] and M[FTA]–[C4C1pyrr][FTA] (x(M[X]) = 0.20, M = (a) Li, (b) Na, (c) K; X = FSA, FTA). The detailed procedures are provided in the experimental section.
Download figure:
Standard image High-resolution imageFor the Na system, the current densities in the Na[FSA]–[C3C1pyrr][FSA] electrolyte are lower than those of its Li-based counterpart, reaching only 1.1 μA cm−2 even after 78 h (Fig. 4b). The Al current collector in Na[FTA]–[C4C1pyrr][FTA] exhibits slightly larger anodic currents over 1 μA cm−2 in the initial 9 h; however, the value has gradually decreased to 0.7 μA cm–2 after 78 h. Therefore, the FTA-based IL is more resistant to Al corrosion in the long term. Similar trends are observed in the K-based ILs as shown in Fig. 4c. For K[FSA]–[C3C1pyrr][FSA], the anodic current density of an Al foil is maintained at approximately 2.0 μA cm−2 after polarization at 5.2 V. In contrast, extremely low currents around 0.2 μA cm−2 flow into the Al current collector at all times in the case of the K[FTA]–[C4C1pyrr][FTA] electrolyte, which indicates that it exhibits the highest tolerance against Al corrosion.
From the above results, it can be concluded that the corrosion of the Al current collector in FTA-based ILs is suppressed compared to that in FSA-based ILs, regardless of the alkali metal cation species in the electrolytes, which is consistent with the superior charge–discharge performance of the graphite positive electrode at high voltages. In addition, according to our previous studies, 14,15 the FSA-based ILs show wider electrochemical windows on glassy carbon electrodes compared to the FTA-based ILs as shown in Table S1, which also suggests that electrolyte decomposition except for Al corrosion does not significantly affect the graphite positive electrode behavior under the voltage conditions used in the present study. While the corrosion behavior of the FTA-based ILs is almost independent of the alkali metal cations, the FSA-based IL exhibits a strong dependence on the alkali metal cations. Furthermore, the Na[FSA]–[C3C1pyrr][FSA] electrolyte suppresses Al corrosion to a level as low as that of the Na[FTA]–[C4C1pyrr][FTA] electrolyte, which may correspond to the differences in charge–discharge behaviors of other FSA-based ILs, as shown in Figs. 1 and 2.
The previous studies reported that Al corrosion currents are suppressed in TFSA-based ILs containing Li+ cation compared to FSA-based ILs, 28,29 which may be caused by the lower solubility of Al-TFSA compounds (e.g., Al[TFSA]3). 28–30 Since the magnitude of Al corrosion currents in FTA-based ILs lies between FSA- and TFSA-based ILs, 28 the solubility of Al-FTA compounds is likely to be lower than that of Al-FSA compounds and higher than that of Al-TFSA compounds. Thus, the FTA-based ILs suppressed the Al corrosion compared to the FSA-based ILs in the present study. Among the FSA-based ILs, only the IL containing Na+ (Na[FSA]–[C3C1pyrr][FSA]) exhibited significantly smaller currents comparable to FTA-based ILs. One possible explanation of this unique behavior is that the liquid structure, i.e., the complex ion state of the cations and anions, is different only in Na[FSA]–[C3C1pyrr][FSA], as mentioned before, which suppresses the dissolution of Al-FSA compounds and allows high corrosion resistance.
Charge–discharge behavior in K[FTA]–[C4C1pyrr][FTA]
As discussed above, K[FTA]–[C4C1pyrr][FTA] (x(K[FTA) = 0.20) was found to confer good charge–discharge performance to the graphite positive electrode. To further substantiate the performance for constructing DCBs, the detailed electrochemical behavior of graphite in this IL electrolyte was investigated using ex situ XRD measurements and long-term cycling tests.
Figure 5a shows the initial charge–discharge curve of the graphite electrode in the K[FTA]–[C4C1pyrr][FTA] IL electrolyte at 20 mA g−1 and 298 K, which is identical to the initial charge–discharge curve in Fig. 2c. The charge and discharge capacities were 133 and 95 mAh g−1, respectively. Figure 5b summarizes the ex situ XRD patterns of the graphite electrode during the initial cycle, which depict the phase transition of the FTA-GICs; each number corresponds to the state of charge provided in Fig. 5a. The samples were prepared by charging (and discharging) at constant current densities of 20 mA g−1 for points 1–6 and 5 mA g−1 for point 7. In the pattern of the pristine graphite electrode, a sharp peak appeared at 26.6° assignable to 002 diffraction of graphite. At point 1 (30 mAh g−1), the intensity of the graphite diffraction peak decreases, and two peaks appear at approximately 24.2° and 30.3°; the latter can be assigned to stage-3 FTA-GIC with di = 8.0 Å. Upon further charging to point 2 (53 mAh g−1), the diffraction peaks have shifted to 23.6° and 31.7°, corresponding to the formation of stage-2 FTA-GICs with di = 8.0 Å. When the charging capacity reaches point 3 (91 mAh g−1), four diffraction peaks are obtained in the XRD pattern; those detected at 23.4° and 32.0° are assigned to stage-2 FTA-GIC and those at 22.2° and 33.5° to stage-1 FTA-GIC. The di value of the stage-2 GIC seems slightly larger than that observed at point 2, implying the existence of a single-phase region with different interlayer concentrations for this compound. When the graphite electrode is further charged to an upper cut-off voltage of 5.4 V (point 4, 133 mAh g−1), two dominant peaks are observed at 22.2° and 33.6°, which are assigned to stage-1 FTA-GIC. Thus, the long plateau at approximately 5.2 V corresponds to the coexisting state of stage-1 and stage-2 FTA-GICs.
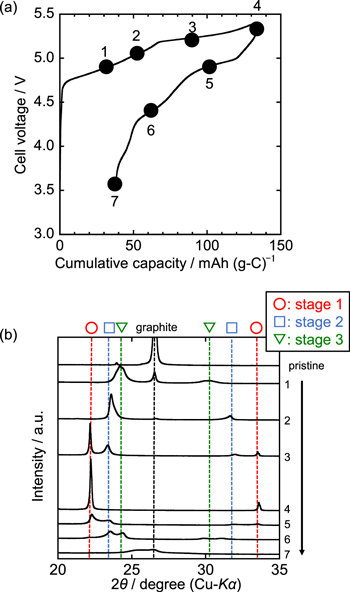
Figure 5. (a) Initial charge–discharge curve of K/graphite half-cell in K[FTA]–[C4C1pyrr][FTA] (x(K[FTA]) = 0.20) at 20 mA g−1 at 298 K. (b) Ex-situ XRD patterns of graphite positive electrodes at various charge–discharge states. Each number corresponds to the state of charge plotted in Fig. 5a. The vertical broken lines of stage-1, −2, and −3 compounds correspond to the diffraction angles of the GICs with di = 8.0 Å.
Download figure:
Standard image High-resolution imageThe peak intensities in the XRD pattern during discharging are smaller than those during charging, indicative of a decrease in graphite crystallinity owing to large volume changes during the charging and discharging processes. Upon discharging to point 5 (102 mAh g−1), four broad diffraction peaks are confirmed: the two peaks appearing at 23.4° and 31.9° are assigned to stage-2 GIC and the two at 22.3° and 33.5° to the remaining stage-1 GIC. This indicates that the discharge plateau at approximately 5.0 V corresponds to the charge plateau at 5.2 V. After further discharging to point 5, commensurate with a cumulative capacity of 62 mAh g−1, four diffraction peaks are observed, with two peaks attributable to stage-3 GIC appearing at 24.4° and 29.9° and two peaks attributable to stage-2 GIC at 23.6° and 31.1°. Finally, the XRD pattern of the graphite electrode discharged to 3.6 V at 5 mA g−1 is shown at point 7. A significant decrease in peak intensity is confirmed, and the diffraction peak is detected at almost the same position as that of pristine graphite, indicating that the discharge is almost complete. However, the existence of another peak at 25.5° corresponding to dilute stage or high stage GICs suggests that a small amount of FTA− remains in the graphite even after a complete discharge. If incomplete deintercalation is the only cause for coulombic efficiencies lower than 100%, anions would accumulate between graphite layers during long-term cycling, leading to a decrease in reversible capacity. In contrast, the results show the stable cycling characteristics for 50 cycles, as shown in Fig. 6. Therefore, Al corrosion or other side reactions such as SEI formation cannot be completely ruled out, and such side reactions that may occur on graphite electrodes could be one of the causes.
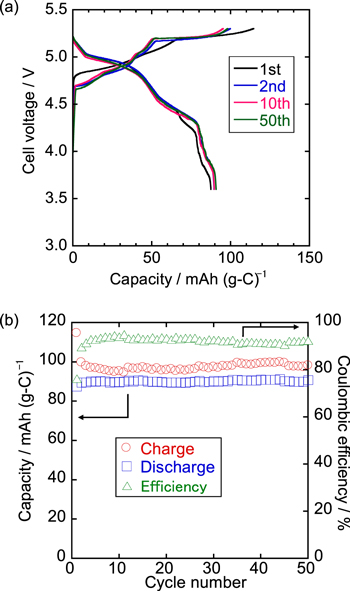
Figure 6. (a) Charge–discharge curves in 1st, 2nd, 10th, and 50th cycles and (b) cycling property of K/graphite coin cell with K[FTA]–[C4C1pyrr][FTA] IL electrolyte at 20 mA g−1 at 298 K. Cut-off voltages: 3.6 and 5.3 V.
Download figure:
Standard image High-resolution image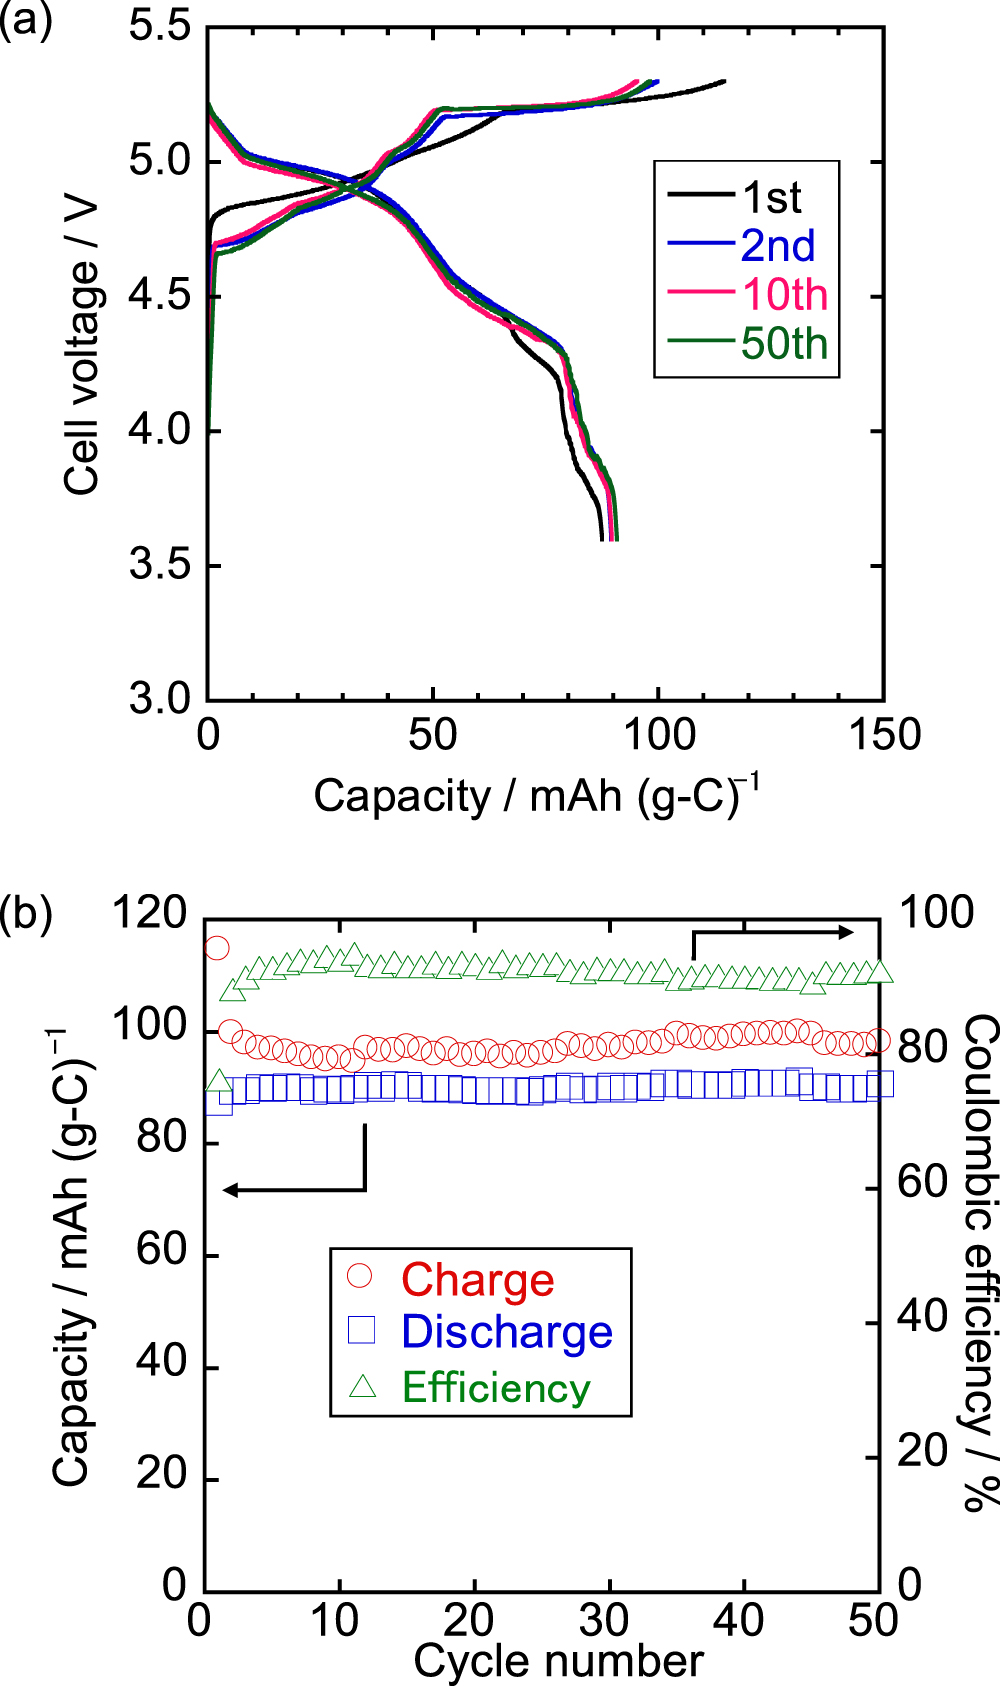
Figure 6 shows the results of the cycling performance tests of the graphite positive electrode at a current density of 20 mA g−1 at 298 K with the K[FTA]–[C4C1pyrr][FTA] electrolyte. The initial charge and discharge capacities are 115 and 88 mAh g−1, respectively. The resulting coulombic efficiency is 76%, which is attributed mainly to irreversible reactions such as SEI layer formation on the graphite electrode or the Al current collector, as discussed in the previous sections. The discharge capacities are maintained at approximately 90 mAh g−1 for 50 cycles, and the coulombic efficiency gradually increases from the 2nd cycle, reaching 91–95% after the 5th cycle. As mentioned above, the irreversible capacities observed in every cycle are possibly due to a small amount of continuous side reactions (e.g., Al corrosion), although their origin is still unclear. As shown in Fig. 6a, the charge–discharge curves almost overlap for 50 cycles except for the 1st cycle with a negligible increase in polarization, indicating that graphite is a promising positive electrode material for DCBs in the K[FTA]–[C4C1pyrr][FTA] IL electrolyte.
Conclusions
We comprehensively studied the charge–discharge behavior of graphite positive electrodes in FSA- and FTA-based IL electrolytes. For most systems, the formation of stage-1 or -2 anion GICs was confirmed via ex situ XRD of the graphite electrodes charged to the upper cut-off voltages. However, an unknown phase with a larger di value was detected in the fully charged state of the Na[FSA]–[C3C1pyrr][FSA] system. Although Li[FSA]- and K[FSA]-based ILs showed poor charge–discharge characteristics, the graphite electrodes exhibited reversible capacities over 80 mAh g−1 for other electrolytes, which was explained by the degree of corrosion of the aluminum used as the current collector. In terms of reversible capacity and cycling stability, K[FTA]–[C4C1pyrr][FTA] was selected as the most promising electrolyte, and the detailed electrochemical behavior of graphite in this electrolyte was investigated. According to ex situ XRD measurements, several FTA-GICs of stages 1–3 were formed during anion intercalation/deintercalation into/from graphite. In addition, the long-term cycling characteristics were evaluated; stable discharge capacities of approximately 90 mAh g−1 were obtained over 50 cycles. These results provide fundamental information on the use of graphite positive electrodes and amide-based IL electrolytes in DCBs, which can serve as a basis for the development and fabrication of safe high-performance power storage devices without using scarce metals.
Acknowledgments
This study was partly supported by JSPS KAKENHI grant (JP21K14718) and the Research Foundation for the Electrotechnology of Chubu. We thank Nippon Shokubai Co., Ltd for supplying the Na[FSA] and K[FSA] salts, SEC Carbon, Ltd for supplying the graphite powder, and Daicel Miraizu Ltd for supplying the CMC powders.
Supplementary Materials
The Supplementary Information is available on the journal website. Properties of the ILs used in this study; Charge–discharge curves of graphite positive electrodes with high upper cut-off voltages in FSA-based IL electrolytes and their XRD patterns at their fully charged states; Cyclic voltammograms for the ferrocenium/ferrocene redox couple in FTA-based electrolytes (PDF).
Supplementary data (0.6 MB PDF)