
Abstract
The influence of different combinations of accelerated stress test (AST) protocols simulating load-cycle and start/stop conditions of a proton exchange membrane fuel cell (PEMFC) vehicle is investigated on a bimodal Pt/C catalyst. The bimodal Pt/C catalyst, prepared by mixing two commercial catalysts, serves as a model system and consists of two distinguishable size populations. The change in mean particle size was investigated by in situ small-angle X-ray scattering (SAXS). The comparison to the reference catalysts, i.e., the two single-size population catalysts, uncovers the presence of electrochemical Ostwald ripening as a degradation mechanism in the bimodal catalyst. Increasing the harshness of the applied AST protocol combinations by faster changing between load-cycle or start/stop conditions, the particle size of the larger population of the bimodal catalyst increases faster than expected. Surprisingly, the change in mean particle size of the smaller size population indicates a smaller increase for harsher AST protocols, which might be explained by a substantial electrochemical Ostwald ripening.
Export citation and abstract BibTeX RIS

This is an open access article distributed under the terms of the Creative Commons Attribution Non-Commercial No Derivatives 4.0 License (CC BY-NC-ND, http://creativecommons.org/licenses/by-nc-nd/4.0/), which permits non-commercial reuse, distribution, and reproduction in any medium, provided the original work is not changed in any way and is properly cited. For permission for commercial reuse, please email: permissions@ioppublishing.org.
The stability of proton exchange membrane fuel cell (PEMFC) catalysts plays a key role in PEMFC-powered heavy-duty vehicles as a sustainable alternative to combustion engines. 1,2 State-of-the-art catalysts are Pt-based nanoparticles (NPs), e.g., a PtCo alloy in the Mirai PEMFC vehicle from Toyota, 2,3 that experience different degradation mechanisms: (1) NP migration and coalescence, (2) metal dissolution or so-called leaching of metal species out of NPs, 4 (3) electrochemical Ostwald ripening, i.e., larger particles grow at the expense of the smaller particles via the formation of metal ions, and (4) detachment of NPs from the support. 5,6 To test the catalyst stability and investigate the catalyst degradation mechanism on a reasonable time scale, accelerated stress tests (ASTs) are performed. 7–12 The dilemma of protocols for such ASTs is to substantially accelerate the degradation and at the same time to lead to results that can be extrapolated to predict lifetimes. The Fuel Cell Commercialization Conference of Japan (FCCJ) recommends two different protocols to separately simulate start/stop or load-cycle conditions in PEMFC vehicles with potential limits between 1.0–1.5 and 0.6–1.0 VRHE, respectively. 9 The FCCJ recommendations do not include a combination of both conditions and typically load-cycle and start/stop conditions are applied separately. Furthermore, it should be noted that since the FCCJ recommendations were made, it has been reported that the "high potential excursions" during start/stop can be mitigated by "clever engineering." 13–16 However, this mitigation adds system complexity and thus costs. A catalyst that could tolerate such high potential excursions is therefore still highly desirable. A combined protocol of start/stop and load-cycle conditions may help to identify potential catalysts that can be used without start/stop mitigation. Furthermore, it is expected that the combination of the two protocols leads to more harsh conditions and therefore to a further acceleration of the degradation, which is required when studying different protocols or different catalysts on a limited timescale as within one in situ beamtime. Last but not least, from a fundamental point of view, it is interesting to investigate what effect a combination of protocols has on the observed degradation mechanism.
Therefore, we devised testing protocols by differently combining square or triangle waves, i.e., potential steps or cyclic voltammetry, respectively, by using the potential limits of start/stop and load-cycle conditions, 9 in four new AST protocols. To investigate the influence of the different AST protocols on the stability of a Pt/C catalyst, we performed in situ small-angle X-ray scattering (SAXS). To determine the degree of degradation of the Pt NPs deposited on high-surface carbon, we follow the particle size changes during the application of the AST protocols. In contrast to local techniques such as (scanning) transmission electron microscopy ((S)TEM), SAXS allows probing the particle size in a macroscopic part of the catalyst layer and is, therefore, representative of the whole catalyst. 11,17–21
We chose to investigate a bimodal Pt/C catalyst 19 with two distinguishable size populations, see the two curved features of the SAXS data in Figs. 2 and S3–S5, by mixing two commercial catalysts of 1–2 and 4–5 nm Pt/C. Both catalysts are often used as benchmarks 22 and are in the following referred to as the smaller and larger size population, respectively. Bimodal catalysts are not only promising materials for electrocatalysis, e.g., as catalyst mixtures, 12,20,23 or composite particles, 24 but also enable the investigation of catalyst degradation over a larger particle size range. 12,23 In addition, the two size populations are located on different carbon flakes in the bimodal catalyst, which should favor the degradation mechanism of electrochemical Ostwald ripening. In electrochemical Ostwald ripening the growth process of the larger particles occurs via metal ion re-deposition on a macroscopic scale, 25–28 whereas in classical Ostwald ripening atomic metal species diffuse only locally on the support. 29–31
While in our previous work of Schröder et al. 12 we could only identify classical electrochemical Ostwald ripening by simulating pure load-cycle conditions, in the present work by combining protocols of load-cycle and start/stop conditions, we observe not only a larger particle size increase but also find indications of electrochemical Ostwald ripening. In the four different AST protocols A-D, the harshness is increased from protocol A to protocol D by a faster change in the frequency between load-cycle and start/stop conditions. With increasing harshness, the larger size population of the bimodal catalyst, as expected, increases stronger in size while, unexpectedly, the smaller size population shows a reduced increase. In trying to explain the observed particle size changes, the challenges of SAXS data analysis are considered. Especially it is highlighted that for bimodal size distributions, not each degradation mechanism leads to a simultaneous growth of each size population and that a lack of particle growth in a population should not be mistaken for the absence of particle degradation.
Experimental
Chemicals and materials
Milli-Q water (resistivity >18.2 MΩ·cm, total organic carbon (TOC) <5 ppb) from a Millipore system was used for cell cleaning as well as catalyst ink preparation. In addition, the catalyst ink was prepared using isopropanol (IPA, 99.7 + %, Alfa Aesar), the commercial Pt/C catalysts (TEC10E20A (1–2 nm Pt/C, 19.4 wt% Pt) and TEC10E50E-HT (4–5 nm Pt/C, 50.6 wt% Pt), Tanaka kikinzoku kogyo), and a Nafion dispersion (D1021, 10 wt%, EW 1100, Fuel Cell Store). The working electrode (WE) was prepared with a gas diffusion layer (GDL) with a microporous layer (MPL) on top (Freudenberg H23C8, 0.230 μm thickness) and in the electrochemical measurement 0.1 M perchloric acid (dilution of 70%, Sigma Aldrich, 99.999% trace metals basis) was used.
Catalyst preparation
The catalyst inks of 0.5 mgPt ml−1 mass concentration were prepared by dispersing the catalysts (single-size population catalysts: 12.90 mg of 1–2 nm Pt/C or 4.98 mg of 4–5 nm Pt/C, bimodal catalyst: a mixture of 5.14 mg 1–2 nm Pt/C and 2.93 mg 4–5 nm Pt/C to reach a Pt mass ratio of 40:60) in 5 ml of a mixture of Milli-Q water and IPA (water/IPA volume ratio of 3:1) by using a sonication bath for 10 min. The mixtures were sonicated again for 10 min after adding 49.0, 11.51, or 26.51 μl Nafion (Nafion/carbon mass ratio of 1) to the inks of the 1–2 nm Pt/C, 4–5 nm Pt/C, or bimodal catalyst inks, respectively.
Catalyst film preparation
The catalyst film was prepared through vacuum filtration by placing the Freudenberg GDL between a glass funnel and a sand core filter on top of a vacuum filtration setup as described by Yarlagadda et al. 32 The ink (0.735 ml) was further diluted by adding IPA (5.331 ml) and Milli-Q water (1.287 ml) reaching 0.05 mgPt ml−1 (total water/IPA volume ratio of 1:3). After 1 min of sonication, the diluted ink was filled in the funnel, and turning on a membrane pump, the catalyst was deposited onto the GDL. The generated GDE was stored in air. A theoretical Pt loading of 208 μgPt cm−2 geo was obtained which is similar to the loading used in commercial fuel cells. 33
Degradation studies in in situ cell
The in situ cell of Binninger et al. 34 is used with some adjustments. As counter electrode (CE) a GDL and as reference electrode (RE) a leakless Ag/AgCl (eDAQ) were used. The working electrode (WE) is prepared by placing a punched-out circle (5 mm diameter) of the catalyst film pre-deposited by vacuum filtration on top of the GDL in a hole (5 mm diameter) of a rectangle of the GDL, see Fig. S1. All was fixed on Kapton tape (MPL upside) as described by Schröder and Quinson et al. 12,23 The electrolyte (in air) was continuously pumped through the cell with a speed of 1 ml min−1 using an online controlled syringe pump. Four different AST protocols were applied performing 20 AST cycles each, see Fig. 1:
- A.Per AST cycle two cyclic voltammograms (CVs, rate of 100 mV s−1) between 0.11 and 1.26 VRHE were performed, followed by 25 repeats of steps between 0.66 and 1.06 VRHE (3 s holding time of each), and afterward two CVs between 1.06 and 1.56 VRHE (100 mV s−1).
- B.Per AST cycle two CVs (100 mV s−1) between 0.11 and 1.26 VRHE were performed, followed by five repeats of five steps between 0.66 and 1.06 VRHE (3 s holding time of each CV) and two CVs between 1.06 and 1.56 VRHE (100 mV s−1).
- C.Per AST cycle two cyclic voltammograms (CVs, 100 mV s−1) between 0.11 and 1.26 VRHE were performed, followed by five repeats of five steps between 0.66 and 1.06 VRHE (3 s holding time) and two steps between 1.06 and 1.56 VRHE (3 s holding time).
- D.Per AST cycle two CVs (100 mV s−1) between 0.11 and 1.26 VRHE were performed, followed by twelve repeats of steps between 0.66, 1.06, 1.56, 1.06, 0.66, 1.06, and 1.56 VRHE (3 s holding time).
The difference of 60 mV as compared to the potential limits of 0.6–1.0 and 1.0–1.5 VRHE for load-cycle and start/stop conditions recommended by the FCCJ 9 is due to a slight shift of the used Ag/AgCl RE that was discovered after the measurements.

Figure 1. Schematic of the four different applied degradation protocols combining simulated load cycles (in red) and start/stop conditions (in blue) of fuel cell vehicles.
Download figure:
Standard image High-resolution imageDuring the degradation measurements, the resistance was determined online using an AC signal (5 kHz,  ).
34
).
34
Small-angle X-ray scattering (SAXS)
The SAXS data were collected before, during, and after the applied AST protocols from Fig. 1. To prevent a change of the catalyst during the SAXS data collection (always several spots of the sample have been probed, see Fig. S1 and below) after each AST cycle the potential was switched to open-circuit conditions during the data collection. The data were collected in the q-range of 0.0049-0.7198 Å, see Fig. S2, with an 11.2 keV beam at the coherent X-ray scattering (cSAXS) beamline at the synchrotron of Paul Scherrer Institute (PSI, Switzerland).
For modeling particle sizes with SAXS, proper background subtraction is necessary which includes the Pt-induced carbon corrosion as a result of the applied electrochemical protocol. This can be done in anomalous 21 or grazing-incidence SAXS 12,35–37 by varying the X-ray energies to deduct the metal scattering contributions or by varying the angle of the incoming X-ray beam to subtract scattering data of a depth deeper inside the catalyst layer as the background, respectively. In the present study, the background subtraction of the SAXS raw data is based on the proposed procedure by Schröder and Quinson et al. 23 determining the background of a catalyst-free spot of the GDL next to the catalyst film in situ, which is subject to the same degradation protocol, but Pt-induced carbon corrosion is not taken into account. Details about the sample and background collection are found in Fig. S1.
The SAXS data analysis after background subtraction was performed as described previously 12,18,20,23,38 using a model of polydisperse spheres. The radially averaged intensity I(q) is expressed as a function of the scattering vector q = 4π·sin(θ)/λ, where λ is the wavelength and 2θ is the scattering angle. The background-corrected scattering data were fitted using a model of one or two polydisperse spheres described by a total volume distributed (i.e., volume-weighted) log-normal distribution. The scattering data were fitted to the following expression with A, n, C1, R1, σ1, C2, R2, σ2 as free parameters:
where A·q-n describes the power law, C1 and C2 are the scaling constants, Ps1 and Ps2 are the sphere form factors, R1 and R2 are the particle radii, V1 and V2 are the particle volumes, and D1 and D2 are the log-normal size distributions of the two size populations. For the two single-size population catalysts, the fitting equation is reduced to:
The normalized sphere form factor is given by: 39,40
The log-normal distribution with σ as variance and R0 (evaluated in Å) as the geometric mean of the log-normal distribution is described by:
A home-written MATLAB code (available on request) is used for the fitting of the SAXS data. The values obtained for the parameters used in the model are reported in Table SI. Representative fits of the background corrected SAXS data are found in Fig. 2 and in the SI in Figs. S3–S5.

Figure 2. In-situ SAXS data collected during open-circuit conditions and fits as a function of the number of applied AST cycles. Comparison of the single-size population catalysts 4–5 nm Pt/C (a), (d) and 1–2 nm Pt/C (b), (e), as well as the bimodal catalyst, i.e., a mixture of the 4–5 nm and 1–2 nm Pt/C catalyst (c), (f), applying degradation protocol A: (a)–(c) Representative SAXS fittings of the background-subtracted scattering data (the shown q range is the one used for the data fitting) of the pristine catalyst, after electrolyte insertion, and after 10 and 20 AST cycles using sphere 1 and 2 for the smaller and larger population, respectively, and the power law when needed. (d)–(f) Mean NP size and standard deviation are shown as error bars of the assumed obtained log-normal distribution. Data of the smaller and larger size populations are displayed by larger and smaller filled circles, respectively. The data points recorded of the pristine catalyst and after electrolyte insertion (before performing AST cycles) are given on the x-axis for a negative AST number and zero, respectively.
Download figure:
Standard image High-resolution imageResults and Discussion
A bimodal catalyst was prepared by mixing two commercial catalysts (with a single-size population) of 4–5 nm Pt/C and 1–2 nm Pt/C in a mass ratio of 60:40. Due to the catalyst mixing, the two different size populations are located on different carbon flakes. Four combinations of AST protocols to simulate load-cycle (potential steps between 0.66 and 1.06 VRHE) and start/stop conditions (cyclic voltammetry or potential steps between 1.06 and 1.56 VRHE) of PEMFCs were applied to the bimodal catalyst samples, see Fig. 1 for details. The changes in the mean particle sizes, a consequence of a catalyst degradation induced by the AST protocols, were determined by fitting the in situ SAXS data assuming log-normal size distributions, see Table SI for details.
After assembling and aligning the in situ cell in the X-ray beam, a SAXS measurement of the pristine catalyst samples was taken before applying the AST protocol. We applied protocol A to the two single-size population catalysts, i.e., the 4-5 nm Pt/C and the 1-2 nm Pt/C, and compared the NP size changes to the bimodal catalyst prepared by mixing the two. As expected, in the pristine state the particle sizes of the individual single-size population catalysts (5.41 ± 1.37 nm and 1.90 ± 0.58 nm) were similar to the sizes of the two populations in the bimodal catalyst (5.50 ± 1.51 nm and 1.84 ± 0.47 nm), see Fig. 2. After inserting the electrolyte, the particle sizes did not change as compared to the pristine catalyst and remained similar between the single-size population catalysts (5.39 ± 1.31 nm and 1.96 ± 0.48 nm) and the bimodal catalyst (5.39 ± 1.48 nm and 1.75 ± 0.57 nm). The particle size changes described in the following were determined as absolute (in nm) and relative changes (in %) with respect to the mean particle size after electrolyte contact, see also Table I.
Table I. Absolute (in nm) and relative (in %) size increases in the mean particle sizes of the log-normal distributions of the two single-size population catalysts and the bimodal catalysts obtained by in situ SAXS after applying 20 AST cycles following protocols A to D as compared to the sizes after electrolyte contact.
| AST protocol | A | B | C | D | ||
|---|---|---|---|---|---|---|
| Catalyst | Single-size population | Bimodal | Bimodal | Bimodal | Bimodal | |
| 4-5 nm Pt/C | + 0.06 nm | — | + 0.43 nm | + 0.90 nm | + 1.27 nm | + 2.15 nm |
| + 1% | + 8% | + 16% | + 23% | + 38% | ||
| 1-2 nm Pt/C | — | + 1.37 nm | + 1.33 nm | + 1.06 nm | + 0.73 nm | + 0.07 nm |
| + 70% | +76% | + 57% | + 37% | + 4% | ||
Applying degradation protocol A to the single-size population catalyst of initial 4-5 nm Pt/C showed no clear size increase from 5.39 ± 1.31 nm to 5.45 ± 1.56 nm (+ 0.06 nm, + 1%), while the 1-2 nm Pt/C catalyst notably increased in size from 1.96 ± 0.48 nm to 3.33 ± 0.95 nm (+ 1.37 nm, + 70%), see Figs. 2d and 2e, and Table I. Interestingly, when mixing the two catalysts to obtain the bimodal catalyst, the larger population slightly increased in size from 5.39 ± 1.48 nm to 5.82 ± 1.12 by + 0.43 nm (+ 8%, Fig. 2f). This is a marked difference to the absence of any substantial size increase for the 4–5 nm Pt/C catalyst. The size increase of the smaller population in the bimodal sample from 1.75 ± 0.57 nm to 3.08 ± 3.02 nm was + 1.33 nm (+ 76%, Fig. 2f), which is comparable to the behavior of the 1–2 nm Pt/C single size population catalyst. The size increase of both populations in the bimodal catalyst is in agreement with our previous observations of Schröder et al., 12 when applying a pure load-cycle AST treatment on a bimodal catalyst of the same composition. However, the observed size increase in the present study occurs on a much shorter time scale as compared to our previous study. 12 This agrees with a stronger degradation by applying an AST protocol combining load-cycle and start/stop conditions as compared to pure load-cycle conditions as presented by Alinejad et al. 10 Due to limited beamtime, reducing the required time to observe degradation phenomena in an AST protocol is essential for comparative in situ SAXS measurements.
Analyzing the results in more detail, the substantially increased growth of the larger population in the bimodal catalyst as compared to the single-size population catalysts of initial 4–5 nm Pt/C suggests an electrochemical Ostwald ripening process from the smaller to the larger population (between the different carbon flakes of the two mixed catalysts). This seems to contrast with our previous work. 12 The electrochemical Ostwald ripening could only be uncovered due to the comparison of the single-size population catalysts, a control that due to the long measurement time when solely applying a "load-cycle protocol" could not be done before. As not only the larger but also the smaller population increases in size, our present results suggest that the combination of load-cycle and start/stop conditions is not only inducing electrochemical but also classical Ostwald ripening. Further, it must be noted that in our previous work 12 using a grazing incidence configuration, it was shown that the degradation mechanism depends on the depth inside the catalyst layer with respect to the electrolyte-catalyst interface. In the measurements presented here, using a cell configuration where the X-ray beam penetrates the complete catalyst layer, the results are an overlap of the different degradation scenarios of all depths.
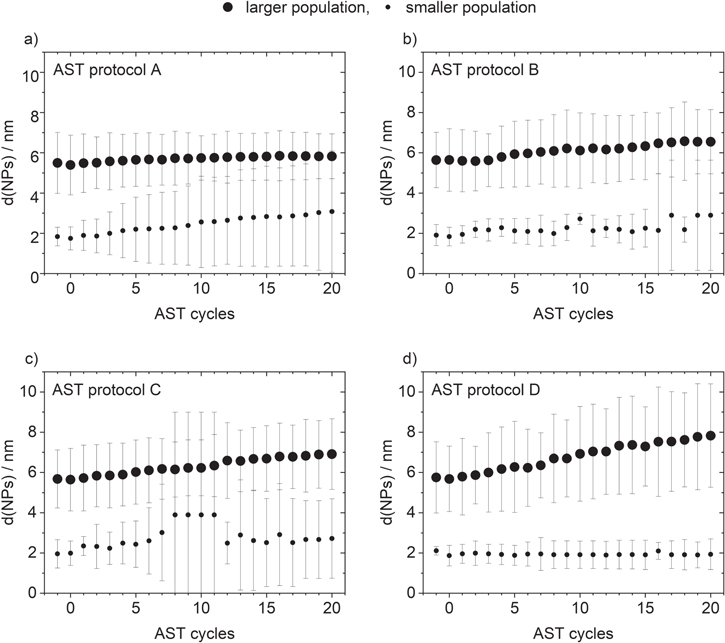
To further analyze the degradation mechanism, we varied the AST protocols from A to D and applied them to the bimodal catalysts, see Figs. S3–S5 for corresponding SAXS raw data. It is seen in Fig. 3 that the different combinations of load-cycling and start/stop cycling clearly have a different effect on the observed change in particle size. Comparing the effect of the protocols A to D on the larger size population shows a size increase of + 0.43 nm (+ 8%), + 0.90 nm (+ 16%), + 1.27 nm (+ 23%), and + 2.15 nm (+ 38%). In comparison, the increase in size of the smaller size population is + 1.33 nm (+76%), + 1.06 nm (+ 57%), + 0.73 nm (+ 37%), and + 0.07 nm (+ 4%), see Fig. 3 and Table I. This means that while the increase in the size of the larger population becomes larger going from protocols A to D, the opposite effect is seen for the smaller population. Based on the design of the AST protocols, going from A to D, the frequency of change between applying load-cycle and start/stop conditions increases, see Fig. 1, which corresponds to "harsher" conditions. Hence, an increasingly substantial degradation is expected, which is in line with the increasing growth of the larger population. At the same time, a decreased growth of the smaller population is observed. Based on the previously observed stronger degradation of the smaller population in a single-size population catalyst using the same commercial catalysts as in the current study (applying load-cycle conditions or a combined protocol of load-cycle and start/stop conditions) 10,11 the decreased growth of the smaller population is surprising at first sight. However, also Watanabe et al. observed less surface loss for single-size population catalyst with smaller particle sizes applying start/stop conditions. 41 In our previous study by Schröder et al. 12 applying a load-cycle protocol to the same bimodal catalyst led to a size increase in both size populations, which was interpreted as classical Ostwald ripening of atomic species within the size populations. Due to the different nanoparticle size dependent durability results reported in literature 41 it can be assumed that the pretreatment and stability of the carbon support, thus, play an important role in the degree of catalyst degradation. As shown previously, start/stop conditions lead to stronger, Pt-induced carbon corrosion 10 initiating particle loss. However, it can be expected that the Pt dissolution rate increases when applying harsher AST protocols, in particular in the smaller population. 42,43 Hence, an increased number of ionic species is formed that apparently leads to a stronger size increase of the larger population via electrochemical Ostwald ripening from the small population. Thus, the increasing harshness of the AST protocol leads to an increased manifestation of electrochemical Ostwald ripening between the populations. In different words, the role of the classical Ostwald ripening process during the total degradation depends on the "harshness" of the applied AST protocol, i.e., how fast and often start/stop conditions are applied.
Figure 3. Mean NP size and standard deviation shown as error bars of the assumed log-normal distributions obtained by in situ SAXS collected during open-circuit conditions as a function of the number of applied AST cycles with respect to the applied AST protocol of the smaller and larger size populations displayed by larger and smaller filled circles, respectively. The data points recorded of the pristine catalyst and after electrolyte insertion (before performing AST cycles) are given on the x-axis for a negative AST number and zero, respectively.
Download figure:
Standard image High-resolution image
Nevertheless, it needs to be further investigated if this observation is a real phenomenon based on the applied degradation protocol or an artifact of the particle size change determination due to the challenges in the analysis of in situ SAXS data. While SAXS is a strong technique to precisely determine the change in average particle size in the whole catalyst layer as compared to a local technique such as (S)TEM, 11,17–21 proper background measurements and background subtraction of the carbon support are essential. We identify three challenges in the analysis of in situ SAXS data: first, the carbon corrosion of the GDL based on the degradation protocol is taken into account due to the used WE design as presented by Schröder and Quinson et al. 23 but in contrast to, e.g., a grazing incidence configuration, 12 the carbon corrosion induced by the active phase (here Pt) cannot be considered in this design. Second, the data analysis assumes a lognormal distribution of the individual size populations that is reasonable for as-prepared catalysts, however, the degradation process might change the size distribution to a non-lognormal one. Third, the scattering strongly depends on the particle size (proportional to the square of the particle volume). An intense degradation due to a substantially increased electrochemical Ostwald ripening of the larger population at the expense of the smaller population leads to an almost vanishing contribution from the small population as seen by a flatting of the scattering data of the smaller population in Figs. 2c, S5, and S6, which makes the size determination less accurate.
Conclusions
Applying an AST protocol combining load-cycle and start/stop conditions in PEMFCs, the particle size changes of a bimodal Pt/C catalyst are determined by in situ SAXS. The combination of the two conditions considerably reduces the required treatment time and allows comparative in situ studies. Comparing the two single-size population Pt/C catalysts with the bimodal Pt/C catalyst obtained by mixing the two clearly indicates electrochemical Ostwald ripening. Increasing the harshness of the AST protocol, i.e., a faster change between load-cycle and start/stop conditions, the larger population, as expected, increases stronger in particle size while the size increase of the smaller population is reduced. This surprising result of a different degradation behavior is explained by a substantial increase in electrochemical Ostwald ripening from the small population to the large population. The absence of particle growth in the small population indicates that there is no re-deposition within this population. Therefore, it is important to point out that not all degradation conditions necessarily lead to a growth of each respective size population. This absence of size-increase in catalysts may be mistaken for a size population being more stable than it actually is. Furthermore, it is seen that in the analysis of in situ SAXS degradation data, procedures for bi- or multimodal distributions for the unambiguous evaluation of absolute weight fractions of the modes need to be established. With such advances, in situ SAXS measurements could become the ultimate tool for mechanistic investigations of fuel cell catalyst degradation.
Acknowledgments
This work received funding from the Swiss National Science Foundation (SNSF) via project No. 200021 184742 and the Danish National Research Foundation Center for High Entropy Alloys Catalysis (CHEAC) DNRF-149. J.S. would like to acknowledge the Leopoldina fellowship program, grant number LPDS 2022-02, of the German National Academy of Sciences Leopoldina. J.D. would like to acknowledge funding from the China Scholarship Council (CSC). We would like to acknowledge the Paul Scherrer Institute, Villigen, Switzerland, for provision of synchrotron radiation beamtime at the cSAXS (X12SA) beamline of the SLS (Proposal 20201725) and would like to thank Andreas Menzel, Xavier Donath, and Urs Vogelsang for technical support.