

Abstract
We present a new method for the determination of surface coefficients, more specifically the effective ion-induced secondary electron yield, γeff, and the effective elastic electron reflection coefficient, reff, by means of a synergistic combination of energy-selective mass spectrometry measurements and numerical particle-in-cell/Monte Carlo collisions simulations of the ion flux-energy distribution function (IEDF) in a symmetric capacitively coupled plasma (CCP). In particular, we analyze the bimodal peak structure of the IEDF, which is caused by ions crossing the sheath without collisions. The position and width of this structure on the energy scale are defined by the time-averaged sheath potential and the ion transit time through the sheath, respectively. We find that both characteristics are differently influenced by γeff and reff. The ion-induced secondary electrons are accelerated in the large sheath potential and mainly influence the plasma density, sheath width and, consequently, the ion transit time and in this way the bimodal peak separation. Electron reflection from the electrodes acts mainly at times of sheath collapse, where low energy electrons can reach the surfaces. Their contribution to the plasma density increase is small, however, their longer residence time in the vicinity of the electrodes modifies the space charge density and the potential gradient. Additionally, the charge balance at the electrode requires an incident electron flux that is correlated to the flux of emitted ion induced secondary electrons and reflected electrons, which is realized by a change of the electron repelling sheath voltage. As a consequence, the electron reflection coefficient mainly influences the sheath potential and, hence, the position of the bimodal peak structure. These effects allow the simultaneous in situ determination of both surface parameters. The parameter values determined for stainless steel and Al2O3 surfaces are in good agreement with literature data. Our method opens a straightforward way of obtaining γeff and reff under realistic plasma conditions.
Export citation and abstract BibTeX RIS

Original content from this work may be used under the terms of the Creative Commons Attribution 4.0 licence. Any further distribution of this work must maintain attribution to the author(s) and the title of the work, journal citation and DOI.
1. Introduction
Secondary electron emission (SEE) is an important source of highly energetic electrons in low-pressure plasmas: electrons are released from the surface material by impinging electrons, ions, fast atoms, metastables or photons from the plasma, are accelerated in the sheath potential and enter the bulk plasma with typical energies of some tens to a few 100 eVs. These electrons lose their energy in several collisions with the neutral background gas resulting in ionized or excited species and dissociated molecules. Therefore, secondary electrons can be crucial for sustaining radiofrequency plasmas at some conditions and can basically alter all important plasma properties such as the plasma density, electron temperature and all quantities depending on these. Hence, SEE has been of high scientific interest for decades [1–3].
Secondary electron emission coefficients have extensively been studied for the impact of electrons [3–5], ions [3, 6–10], fast neutrals [6], metastables [11] and photons [6, 12] in particle beam experiments but in plasma modeling it is challenging to include all possible species and emission processes with their own energy dependence. The situation is further complicated by the fact that secondary electron (SE) yields obtained in surface physics (beam) experiments may not be directly applicable to gas discharge physics experiments where surface conditions of the electrodes are less well defined as compared to those typical for surface physics experiments conducted under ultra-high vacuum conditions [10, 13]. Furthermore, possible synergistic effects of multiple species bombardment are still under investigation [14–16] and more realistic but computationally more expensive simulations including the plasma-solid interface are currently under development [17, 18]. Therefore, an effective secondary electron emission coefficient is usually used in simulation studies instead, that describes the ratio of emitted secondary electrons per incoming ion (γeff = NSE/Ni). The same simplification applies to impinging electrons that are reflected from the surface or lead to true SEE. These effects can be modeled with an effective electron reflection coefficient, that is described by the ratio of emitted secondary electrons or reflected electrons per incoming electron (reff = NSE/Ne). These effective yields are typically considered to be independent of the projectile's energy except for a few recent studies that take the energy dependence into account [16, 19–21].
Several approaches have been presented in the literature to measure the effective SEE coefficients directly in a plasma environment. First, Böhm and Perrin published a technique using current measurements in a retarding field energy analyzer (RFEA) that involves measuring only the ion current by repelling secondary electrons back on the collector electrode and a combined current measurement of ions and secondary electrons [22]. Even though SEE was measured from the collector electrode inside the RFEA and not at the plasma facing electrode, it was still under bombardment of neutrals and photons as well. A quite similar approach was used by Qin et al [23] using a Faraday cup to measure only the ion current density and current measurements on a silicon wafer to determine the total current density from ions and secondary electrons. Lately, Sobolewski [24] reported an in situ determination of the effective SEE yield by voltage and current measurements at the rf-biased electrode in an inductively coupled plasma with complementary Langmuir probe measurements. These measurements provided input data for a sophisticated numerical sheath model that was used to extract ion and emission current densities. The first optical method called 'γ-CAST' was presented by Daksha et al [25] in the context of capacitively coupled radiofrequency plasmas (rf-CCPs). In such a plasma source, secondary electrons that are accelerated in the expanded sheath create an additional feature ('γ-peak') in the spatio-temporal distribution of the excitation rate that can be detected in phase resolved optical emission spectroscopy (PROES) measurements [26], besides the common 'α-peak' that marks the presence of high energy electrons near the sheath edge during sheath expansion [27]. In this method, the ratio of the α and γ electron excitation peaks was compared to that obtained from particle in cell/Monte Carlo collisions (PIC/MCC) simulations to determine γeff. A more indirect way was proposed by Depla et al [28], who showed an inversely proportional behavior between discharge voltage and ion-induced secondary electron emission coefficient in dc magnetron discharges operated at constant current. This technique was successfully applied to estimate γ coefficients for several metal oxides and nitrides via an intentional target poisoning [29, 30]. This indirect principle using the feedback of the plasma on changes in γ and the aforementioned influence of several plasma properties motivated us to study plasma conditions in a symmetric rf-CCP for different surface materials.
Here, as in the work by Daksha et al [25], a computationally assisted approach that compares results obtained from measurements and simulations is chosen to gain information about the effective emission yields in the experiment. Energy-selective mass spectrometry (ESMS) is used to characterize changes in plasma properties via precise measurements of the ion flux-energy distribution function (IFEDF) [31, 32] (or ion probability distribution function (IPDF) [33, 34]) at the grounded electrode of a rf-CCP. For reasons of convenience this function is often just called ion energy distribution function (IEDF) and we will use this term throughout this work. The IEDF can be measured with high precision and responds sensitively to changes in plasma properties. Furthermore, it can be obtained from numerical simulations such as the particle-in-cell/Monte Carlo collisions (PIC/MCC) approach, which offers access to various plasma properties and, therefore, is widely established for the simulation of low-pressure plasmas. All experimental parameters including neutral gas pressure, gas temperature, applied voltage and electrode distance are carefully controlled leaving only the parameters of surface processes, i.e., the secondary emission properties γeff and reff as fitting parameters between experiments and simulations. Simulation results obtained for a wide range of γeff and reff are compared to the experimental IEDFs measured with stainless steel (SS) and aluminum oxide (Al2O3) surfaces to test the potential for the simultaneous estimation of both parameters with the properties of the IEDF.
The following section introduces the experimental setup, the diagnostic approach and the simulation method. The influence of specific experimental conditions on the IEDF is discussed in sections 3.1 to 3.6 before we compare the experimental and computed IEDFs and present a method for the estimation of the γeff and reff coefficients in section 3.7. With the help of the simulation data in section 3.8, we discuss the reasons for the different behavior of γeff and reff on the properties of the IEDF. In sections 3.9 and 3.10 we discuss limitations and compare the approach to other existing techniques for the determination of SEE coefficients. Section 4 summarizes our findings and gives some suggestions for further improvements.
2. Methods
2.1. Experimental setup
The experimental setup consists of an enclosed electrode assembly that is attached to the front flange of an energy-selective mass spectrometer with an integrated 100 μm diameter sampling orifice. The electrode assembly is mounted inside a stainless steel UHV chamber with a diameter of 200 mm and a height of 300 mm as sketched in figure 1(a). This chamber is evacuated by a two stage pumping system to a base pressure of about 5 × 10⁻⁶ Pa. A mass flow controller provides a constant gas flow of 10 sccm argon 5.0 while a butterfly valve placed downstream controls the background gas pressure measured by a baratron gauge in the desired range from 3 Pa to 20 Pa.
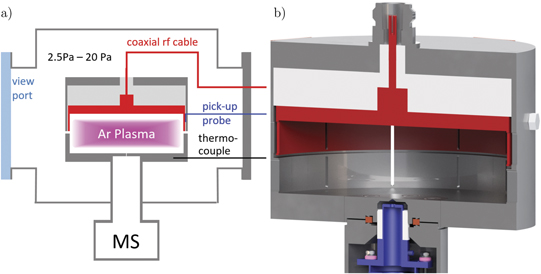
Figure 1. The section view of the experimental setup (a) shows the electrode assembly in the vacuum chamber and the mass spectrometer attached from the bottom. A close-up of the electrodes (b) demonstrates the enclosed plasma volume with the rf-electrode marked in red, the ceramic isolation in light gray, grounded parts in gray, and the first electrode of the mass spectrometer's ion optics (extractor) behind the sampling orifice in the center of the grounded electrode in blue.
Download figure:
Standard image High-resolution imageThe core of the experiment is the cylindrical electrode geometry that completely encloses the plasma and ensures symmetric geometry with equal plasma facing surface areas of the powered and grounded electrode. This is a necessary requirement for a comparison with 1d3v PIC/MCC simulations where an infinite parallel plate geometry is assumed. Obviously, such an infinite geometry can be approximated in a real world experiment only with some limitations at the electrode edges. There are several symmetric CCP setups in the literature with different approaches how to confine the plasma without breaking symmetry. In most cases, the plasma is confined by a dielectric cylinder wall [25, 26, 32, 35–39]. In our case, it is of high importance that the plasma faces only one surface material in order to avoid surface effects from a second dielectric material. To study the properties of a single material, a cup shaped electrode similar to the design by Böhm and Perrin [22, 40] is chosen. While having only one plasma facing material, this geometry comes with the drawback of breaking parallel plate geometry at the cylinder wall. Here, the closely positioned electrodes might lead to an inhomogeneity in plasma density close to the cylinder wall that cannot be captured in 1d simulations and might disturb the plasma conditions also in the center of the cylinder, where the IEDF is measured. Two-dimensional simulations of cup shaped electrodes showed evidence for diagonally accelerated electron beams due to the superposition of the axial and radial sheath expansion in the corner of the cylinder. However the time-averaged plasma density showed only little influence of edge effects [41].
The electrode distance is fixed at 25 mm and the inner diameter of the electrode surface facing the plasma is 88 mm. The rf-electrode is shielded on the outer side by an additional grounded cylinder to prevent plasma ignition outside the enclosure. The gap between the powered and grounded electrode in the cylinder wall as well as the distance to the surrounding enclosure is kept at a low distance of 1 mm to stay below the sheath width for all pressures and avoid, therefore, plasma penetration into that space. Gas exchange with the surrounding vacuum chamber and optical access is allowed by 12 slits of 1 mm width and 24 mm height machined into the cylinder wall. The electrode geometry with the mass spectrometer's sampling orifice integrated in the grounded electrode is sketched in figure 1(b) in more detail.
A 13.56 MHz rf-power generator is coupled to a matching network which is connected to the rf-electrode. The plasma is powered by a sinusoidal voltage waveform with a peak-to-peak value of 250 Vpp for all measurements shown here. Using such a low excitation voltage is essential in order to avoid a sputtering damage of the surface coating mentioned later. The space between the rf-electrode and the shielding is used for a capacitive voltage pick-up probe to get a voltage measurement directly at the rf-electrode without any error originating from standing waves.
To study surface-induced effects, two identical SS electrode sets are used of which one pair is coated with a 0.5 μm Al2O3 layer. Al2O3 was chosen because it has one of the highest secondary electron emission coefficients while being still chemically stable in humid air [29, 42]. Chemical stability is essential as the electrodes are coated separately and get inevitably in contact with air after the coating. The use of materials with even higher SEE like BaO or Cs2O requires an in situ deposition technique [42] that is difficult to achieve in our case due to the enclosed electrode geometry. Besides some small mounting screws all plasma facing surfaces including the mass spectrometer's sampling orifice are coated with Al2O3. Coating all plasma facing surfaces is crucial since otherwise the discharge symmetry might be broken [43]. The excellent symmetry of the presented electrode geometry is proven by the very low remaining dc self bias voltage of only −0.5 V at 250 Vpp rf-voltage and by measurements of the symmetric emission profile between the electrodes (see section 3.6).
The Hiden Analytical PSM003 mass spectrometer selects ions of a specific energy and mass by means of a Bessel-box energy filter, that provides an accessible ion energy range from 0 eV to 1000 eV with an energy resolution (FWHM) of 0.7 eV, and a quadrupole mass filter for ion masses up to 300 amu, respectively. A secondary electron multiplier with a dynamic range of 7 decades is used for ion detection. The setup is differentially pumped to about 1 × 10⁻⁵ Pa during operation.
2.2. Simulation approach
In parallel with experiments, kinetic simulations of the discharge based on a 1d3v electrostatic PIC/MCC code [44] are carried out. In the code, Ar+ ions and electrons are considered in an ideal, neutral Ar background gas of homogeneous density that is defined via the gas pressure and temperature. The cross sections for electron impact collisions including elastic scattering, excitation and ionization are taken from Hayashi's data base [45] (see also [46]) of LxCat [47–49]. Ion-neutral collisions are treated with a differential cross section that has an isotropic and a backward scattering part, as suggested by Phelps [13].
The interaction of charged particles with the surfaces is described by effective surface coefficients as mentioned earlier. We consider the following two processes:
- Ion-induced secondary electron emission is characterised by an effective electron yield, γeff, which implicitly includes the contributions of other species that can also cause secondary electron emission (photons, fast neutrals and metastables) [6, 50]. The effective electron emission coefficient γeff can be assumed to be energy independent as potential electron emission dominates the surface processes for the low impinging ion energies (Ei ≲ 60 eV) under the present conditions (250 Vpp). The energy dependent kinetic electron emission contributes significantly to the emission yield for energies above about 1 keV [6].
- Electrons impinging onto the electrode's surface are assumed to be reflected elastically with a probability defined by the effective reflection coefficient reff. This assumption is justified as long as the electron flux to the surface consists mainly of low energy electrons for which elastic reflection dominates over inelastic reflection and true secondary emission. This is the case for conditions for which the electrode separation is larger than the electron's mean free path, as it is the case for the conditions presented in this study: the sum of cross sections for elastic, excitation and ionization e−–Ar collisions in [46] gives a averaged value of 7.25 × 10⁻²⁰ m−2 for electrons that are accelerated in the time varying sheath potential to energies between 3 eV in the collapsed sheath and 128 eV in the fully expanded sheath. Assuming an ideal gas at 300 K, we get a mean free path of λe ≈ 11 mm at 5 Pa, which is significantly smaller than the electrode distance of 25 mm. Under such conditions, the high energy ion induced secondary electrons are thermalized to low electron energies in collisions in the bulk plasma. This is also confirmed by the electron flux-energy distribution to the electrode surface calculated by the PIC/MCC simulations, which shows a very low amount (<5%) of electrons with high energies (>20 eV) that originates from electrons crossing the bulk plasma without collisions. In addition, measurements of the electron reflection coefficient at energies below 15 eV indicate indeed a constant reflection probability that is largely energy independent [51]. Furthermore, this simple energy independent approach can also incorporate approximately additional effects from true secondary electrons, as the energy distribution of true secondary electrons is similar to the energy distribution of elastically reflected electrons from a collision dominated flux distribution, which both show a maximum at a few eV with a following high energy tail up to a few times 10 eV. The effect of inelastically reflected electron is also approximated by a low number of elastically reflected electrons at higher energies.
We note, that recently a few more sophisticated approaches have considered the interactions mentioned above in a more realistic, energy dependent way [16, 19–21]. These realistic models need to be used when the maximum ion energy exceeds the threshold for kinetic emission or when the electron's mean free path becomes comparable or even larger than the electrode distance as it the case for more extreme ranges of operating parameters like driving voltages in the kV range at pressures of ≲1 Pa. In the latter case, a large number of high energy electrons can cross the electrode gap without collisions and impinge with high energies at the opposite electrode, which can lead to inelastic reflection and true secondary emission. Therefore, the effects of true secondary electron emission and inelastic electron can no longer be neglected under such circumstances. These models need several input parameters that are often not available in the literature for a given surface material. For the conditions of the present study these models can be bypassed.
In the simulations, the discharge is established by a cosine shaped voltage waveform with a peak-to-peak value of 250 Vpp matching the experimental conditions. The electrode gap of 25 mm is divided into Ng = 800 spatial cells and the rf period is divided into Nt = 10 000 time steps for the numerical integration of the equations of motion of the charged particles. These values fulfill the stability and accuracy criteria of the PIC/MCC scheme (see e.g. [52–54]). About 3 × 10⁵ superparticles of both charged species are traced in each simulation.
The primary output of the simulations is the flux-energy distribution of the Ar+ ions bombarding the grounded electrode. These distributions are collected with 0.1 eV energy resolution over 1000 rf-cycles in the converged simulations, which allows a precise comparison with the experimental data. Several additional data (e.g. charged particle density distribution and potential distribution) aid the understanding of the impact of the surface properties γeff and reff on the plasma.
3. Results and discussion
In this section, the typical ion composition and generation of peak structures in the IEDF of rf-CCPs are shortly presented before the approach for the determination of the surface parameters γeff and reff is introduced.
3.1. Ion composition
The energy-integrated mass spectrum in figure 2 shows the abundance of all species occurring in the experiment. Here, IEDFs for each mass between 1 amu and 100 amu are measured and all measured ion fluxes of an IEDF are summed to obtain each peak in the ion mass spectrum. Please note that ESMS distinguishes the ion's mass-to-charge ratio (m/Z in amu/e) and energy-to-charge-ratio (Ei/Z in eV/e). For example, doubly ionized argon (Ar2+) appears at 20 amu/e. Since all ions except Ar2+ are singly ionized the term ion mass (mi in amu) and ion energy (Ei in eV) is used throughout this work for reasons of convenience. A variety of ion species has been detected including singly and doubly ionized argon, gas impurities and ions from attachment collisions with the neutral argon gas. The PIC/MCC simulation only accounts for Ar+ ions and all other ion species depict a potential error source when comparing the results of measurements and simulations.

Figure 2. Measured energy-integrated ion mass spectrum for an argon discharge at 5 Pa and 250 Vpp.
Download figure:
Standard image High-resolution imageA low base pressure of about 5 × 10⁻⁶ Pa and argon 5.0 was used to reduce the fraction of impurities to about 10 ppm. The energy integrated ion mass spectrum shows only significant signals for H2O+ (18 amu), Ar2+ (20 amu), the argon isotopes 36Ar+ (36 amu), 38Ar+ (40 amu) and 40Ar+ (40 amu), ArH+ (41 amu) and  (80 amu) with 40Ar+ being with more than two orders of magnitude the dominant ion. The formation of Ar2+,
  or ArH+ ions in argon plasmas was reported by many authors before [55, 56]. All other typical impurities like
  (28 amu),
  (32 amu) or CO2 (44 amu) are close to or even below detection limit.
3.2. Ion energy distribution function
In low pressure rf-plasmas, the IEDF at the electrodes consists of a bimodal peak structure around the time-averaged sheath potential [56–59] that originates from ions that cross the sheath without collisions and an additional multiple peak structure at lower energies [31, 37, 60–64] that is produced by collisions in the sheath. The amount of collisions can vary depending on pressure and the collision cross section. At low pressures and for small collision cross sections, collisions are rare and the bimodal peak structure is prominent. At high pressures and for large collision cross sections, however, a short ion mean free path prohibits ions from passing through the sheath without collisions and the peaks at lower energies dominate the IEDF.
The formation of a bimodal peak structure is strictly related to the ion transit time through the sheath τi [65]

with the sheath width s, the ion mass mi, the elementary charge e and the time-averaged sheath potential  . Bimodal peaks result from ions that enter the sheath at different phases of the rf-cycle. In a symmetric rf-CCP, the voltage drop over the sheath, Φs(t), varies during an rf-cycle from a small floating potential (few V) in the collapsed sheath to the rf-voltage amplitude plus the floating potential in the fully developed sheath. Ions continuously enter the sheath and the energy distribution represents a histogram of sheath potentials if the ions can cross the sheath within a small fraction of the rf-cycle (τi ≪ τrf). According to equation (1), this is the case for the limit of high density low-pressure plasmas with small sheath widths (s) like inductively coupled plasmas (ICPs), lightweight ions (small mi), large sheath potentials
  or low-frequency excitation voltages (long τrf). The harmonic variation of the sheath potential develops the typical double peak structure around the time-averaged sheath potential as a maximum occurs in the IEDF for all sheath potentials with
  . On the other hand, large sheath width, heavy ions, low sheath potentials and high-frequency excitation voltages lead to transit times much larger than the rf-cycle duration (τi ≫ τrf). Then, ions are accelerated in a time-averaged sheath potential
  and show a monoenergetic distribution at an energy of
  . All ion masses under all experimental conditions studied here show energy distributions in between those two extreme cases: the sheath potential variation is partly averaged due to the transit time of the ions through the sheath leading to bimodal peaks with different peak separations, ΔE, depending on the ion mass as demonstrated in figure 3 with IEDFs of the most prominent ions for an argon discharge at 5 Pa and 250 Vpp.
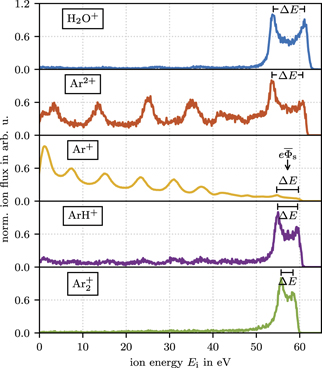
Figure 3. The IEDF of the most prominent species (H2O+ at 18 amu, Ar2+ at 20 amu, Ar+ at 40 amu, ArH+ at 41 amu and  at 80 amu) at 5 Pa and 250 Vpp. The bimodal peak separation and its center position are marked with ΔE and
  , respectively.
Download figure:
Standard image High-resolution imageThe separation of the two bimodal peaks is described by

with the variation of the sheath potential during an rf-cycle ΔΦs and the rf cycle duration τrf [55, 65–68]. Since the surface properties studied in this work influence mainly the plasma density and, consequently, the sheath width and ion transit time τi, the peak separation is an important indicator for surface-induced changes in plasma properties. Furthermore, the different temporal electron emission due to γeff and reff and their consequences for the density and potential distribution also influence the time-averaged sheath potential,  , that can be obtained from the center of the bimodal peak structure.
It should be noted that the energy in the center of the bimodal peak structure is only an approximation of the time-averaged sheath potential. Any anharmonicity in the time-dependent sheath potential, Φs(t), leads to a small discrepancy between the time-averaged sheath potential and the center of the bimodal peak structure. The PIC/MCC simulations indicate indeed an anharmonic sheath potential variation. But as all ions show relatively narrow bimodal peak separations due to long ion transit times in comparison to the rf-cycle duration, the ion energy spread is strongly averaged in the sheath. Therefore, the center of the bimodal peak structure should give a very good approximation for the time-averaged sheath potential. Moreover, this deviation does not introduce any error in the presented analysis as the time-averaged sheath potential is determined in the same way via the center of the bimodal peaks in both the experimental and simulation results.
In contrast to the low density ions as H2O+, Ar2+, ArH+ and  whose IEDFs are dominated by ions crossing the sheath collisionless and forming the bimodal peaks, the IEDF of Ar+ in figure 3 differs strongly. Its bimodal peak structure is only a minor feature and the IEDF is dominated by several peaks showing decreasing maxima with increasing ion energy. These peaks originate from resonant charge exchange collisions (CXC)

in the sheath. Their formation was studied experimentally and theoretically for the first time by Wild and Koidl [60, 61], who analyzed the final energy of the ions at the electrode, Ei, for ions that are generated in a harmonically oscillating sheath potential by CXCs in dependence of the starting position in the sheath x0 and the starting phase angle φ0. It turned out that the ion energy, Ei(x0, φ0), showed several local maxima and minima. Ions with energies of these extrema occur more often and result in the formation of peaks in the IEDF. Later, increasingly complex sheath models were developed to describe the IEDF in an rf-CCP analytically for sinusoidal [37, 64] and arbitrary voltage waveforms [31].
The IEDFs of Ar+ and Ar2+ at 5 Pa are collision dominated as resonant CXCs have a large cross section [13] and the density of the collision partner (neutral Ar) is high. In the case of the molecular ions as H2O+, ArH+ and  , the lack of low energy peaks indicates that decelerating (non-dissociative and non-attachment) ion-neutral collisions and ion formation in the sheath are rare for those species.
As for the experiment, the typical bimodal peak structure of Ar2+, ArH+ and  can be used to determined the average sheath potential
  and sheath width s also for higher pressures, where the IEDF of Ar+ is dominated by collisions. As the simulation does not trace the low density ions like Ar2+, ArH+ and
  , the following comparison between experimental and computational results concentrates on the analysis of the Ar+ IEDF.
3.3. Pressure dependence
Figure 4 shows the IEDFs of Ar+ ions for pressures between 3 Pa and 20 Pa. As the amount of collisions increases with pressure the bimodal peak structure diminishes with increasing pressure. Only the IEDFs for 3 Pa and 5 Pa show a significant amount of collision free ions from the bulk plasma. Therefore, the following comparison to PIC/MCC simulation is limited to pressures below 10 Pa. But even at low pressures of 5 Pa and 3 Pa the higher energy peak of the bimodal structure is still influenced by collisions resulting in a shoulder-like structure without any clear position of the maximum. In the experiment, the position of this higher energy peak can be approximated with the help of the ArH+ IEDF that is influenced much less by collisions and shows two distinct peaks as revealed in figure 3. Since the ion masses of Ar+ (40 amu) and ArH+ (41 amu) differ only minimally, the bimodal peak separations are very similar. Alternatively, the second peak of the bimodal structure can be estimated from the high energy edge of the shoulder structure. From all IEDFs showing the complete bimodal structure with two distinct maxima we observed the second peak of the bimodal structure to appear about 0.85 eV below the high energy edge. Since the PIC/MCC simulations do not include the ArH+ species, the estimation via the peak position 0.85 eV below the high energy edge is used in the following for the comparison between measurements and PIC/MCC simulations. The IEDFs of Ar2+ and  can also be analyzed to extend the useable pressure range and possibly increase the accuracy of the method. These ions might be implemented in the PIC/MCC simulation as a future extension.
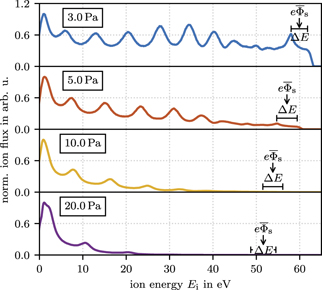
Figure 4. Measured Ar+ IEDFs for increasing pressure at 250 Vpp. The bimodal peak separation (ΔE) and the center position of the bimodal peak  are determined from the IEDF of ArH+ at 41 amu.
Download figure:
Standard image High-resolution imageBesides the amount of collisions, the influence of the pressure on the plasma density and sheath width is also observable in the IEDFs. The increased plasma density and reduced sheath width for higher pressures also reduces the ion transit time as the sheath potential stays almost constant. The shorter ion transit time results in a slightly wider bimodal peak structure as well as a larger separation between the CXC peaks.
3.4. Effect of gas temperature
According to the ideal gas equation, the neutral gas temperature influences the IEDF in a similar way as the pressure and the only relevant parameter for collisions is particle density. As shown by Schulenberg et al [32] the determination of the neutral gas temperature is crucial for a correct experimental validation study. These authors measured the neutral gas temperature by means of tunable diode laser absorption spectroscopy (TDLAS) of the Ar(1s5 → 2p6) transition at 772.36 nm in a plasma source with a slightly larger but comparable symmetric electrode geometry (Ø = 120 mm, d = 40 mm), with lower gas flows of 0.5 to 2 sccm, for voltage amplitudes between 150 and 350 V and for pressures between 1 and 100 Pa. The measured gas temperature showed no significant increase over room temperature for pressures up to 10 Pa for all applied voltages. Only at higher pressures, a rise in gas temperature up to 390 K at 100 Pa was observed. Regarding these results and considering the low pressure of 5 Pa, larger gas flow of 10 sccm and lower voltage amplitude of 125 V used in this work, we assume a neutral gas temperature of 300 K in all simulations. This assumption is corroborated by the measured room temperature of the electrodes during all experiments, monitored in situ through a thermocouple integrated in the grounded electrode.
3.5. Effect of voltage amplitude
The rf-voltage amplitude influences the potential distribution and plasma density. In a first approximation the IEDF can be assumed to scale linearly with the sheath potential along the energy axis, which justifies the treatment of normalized IEDFs in most analytical models [37, 60, 61, 64]. However, the change in plasma density observed in this work also influences the sheath width, so normalizing the IEDF is not applicable in our case. In addition, the observed change in sheath potential is an important parameter that is used later for the determination of γeff and reff. Therefore, we decided to use a constant rf-voltage of 250 Vpp that results in ion energies of up to about 60 eV.
The accuracy of the voltage measurement is limited by the high voltage probe (Tektronix P5100A) to about 2%, which results in our case of 250 Vpp in an error of ±5 Vpp. Since the average sheath potential changes linearly with the applied voltage, its accuracy is also limited to about 2% (±1.25 V). While the separation of the bimodal peaks is almost unaffected, the uncertainty in sheath potential becomes important when effects of γeff and reff are discussed in section 3.7.
3.6. Material dependence
A first indicator for changes in plasma properties is given by the time-averaged and wavelength-integrated emission intensity profiles in the visible and near-infrared spectrum measured with a telecentric lens through one of the side slits for both surface materials as shown in figure 5. The emission profile with the Al2O3 coated electrodes shows a smaller sheath width and a 20% higher peak emission than the discharge with SS electrodes. This is the result of an increased plasma density caused by a stronger secondary electron emission of Al2O3 in comparison to the SS surface.
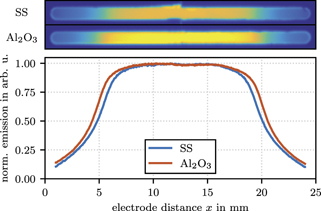
Figure 5. Top: the time-averaged and wavelength-integrated emission intensity in the visible spectrum measured through one of the side slits with help of telecentric lens at 5 Pa and 250 Vpp for SS and Al2O3 plasma-facing materials. The same color map normalization is used for both images. Bottom: the normalized measured emission profiles (solid lines) in the middle of the slit.
Download figure:
Standard image High-resolution imageFigure 6 shows the comparison of the measured IEDFs for the uncoated SS electrodes and the Al2O3 coated electrodes. A clear difference in the IEDFs for both electrode materials is observed, which is the basis for the determination of the surface coefficients, proposed here. First, the width of the bimodal peak structure, ΔE, is much larger for Al2O3, which can be explained again by a higher plasma density for Al2O3 as a result of higher SEE. The higher plasma density results in a decreased sheath width and shorter ion transit time across the sheath. By comparing the width of the bimodal peak structure for ions of different masses the time-averaged sheath width s can be estimated as proposed by Coburn and Kay [55]. The corresponding calculations with equation (2) provide sheath widths of 8.9 mm and 8.0 mm for SS and Al2O3, respectively. However, it should be noted that some assumptions and simplifications were made in the derivation of equation (2). The measured sheath width in the emission profile in figure 5 as well as the corresponding PIC/MCC simulations (with γeff = 0.07 and reff = 0.7 for SS and γeff = 0.45 and reff = 0.7 for Al2O3) show a good agreement in the sheath width of about 6 mm for SS and 5 mm for Al2O3. The sheath width in the simulation is calculated after the definition given by Brinkmann [69]. Second, the position of the bimodal peak, which is located at the energy corresponding to the mean voltage drop  across the sheath, is different for both materials, being about 2.4 eV smaller for the Al2O3 surface. The difference in the average sheath potential is a result of counter-acting effects by an increased space charge density in the sheath and a reduced sheath width as discussed in more details in section 3.8. And third, the distribution and intensity of low-energy peaks resulting from CXCs in the sheath are also different for both cases. The IEDF measured for the SS surface shows more and closer collisional peaks as a result of a longer ion transit time through the sheath caused by a larger sheath width. The reproduction of these low-energy peaks with simulations is probably the most challenging part since their properties are influenced not only by the sheath width and sheath potential but also by the spatiotemporal potential distribution in the sheath. Therefore, the following estimation of the surface coefficients γeff and reff concentrates on changes in the properties of the bimodal peak structure.

Figure 6. Measured IEDFs in an Ar plasma for SS (blue) and aluminum oxide (red) plasma-facing materials at a pressure of 5 Pa and an applied rf-voltage of 250 Vpp.
Download figure:
Standard image High-resolution image3.7. Estimation of γeff and reff
The IEDFs computed with PIC/MCC simulations for various emission coefficient combinations (γeff ∈ [0.0, 0.5] and reff ∈ [0.0, 0.9]) provide the necessary information about the influence of both parameters on the IEDF and can help finding the matching values for the two materials studied here. All other simulation parameters match the experimental conditions: a pressure of 5 Pa, sinusoidal voltage amplitude of 250 Vpp and frequency of 13.56 MHz, electrode distance of 25 mm, and the gas temperature of 300 K. Our aim, to determine both unknown surface coefficients requires the measurements of two specific characteristics of the IEDFs, provided that these do not depend in the same way on the surface parameters. For these characteristics of the IEDFs we propose to use (i) the energy separation of the bimodal peaks, ΔE, and (ii) the average sheath potential,  , that can be determined from the center of the bimodal peak structure. Figure 7(a) shows the width of the bimodal peaks, ΔE, as determined from the simulations for a broad range of values of both surface parameters. According to equation (2), the width of the bimodal peak structure depends on sheath width and consequently on plasma density that is influenced by both: the effective secondary electron emission coefficient γeff and effective electron reflection coefficient reff. We find that ΔE increases with an increase in both parameters. The two ΔE values for SS and Al2O3 as obtained from the mass spectrometry measurements are shown in figure 7(a) as dashed horizontal lines.
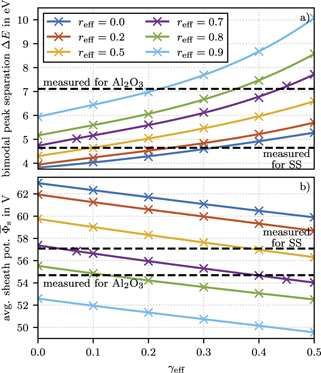
Figure 7. Width of the bimodal peak structure ΔE (a) and average sheath potential  (b) of the IEDFs as obtained from the PIC/MCC simulations for the gas pressure of 5 Pa and applied voltage of 250 Vpp as function of the γeff and reff coefficients. The dashed lines represent the experimentally measured values determined from the IEDFs shown in figure 6.
Download figure:
Standard image High-resolution imageFigure 7(b) presents the values of the time-averaged sheath potential,  , for the ranges of γeff and reff covered and compares them against the measured values shown as dashed horizontal lines. It should be noted that the measured time-averaged sheath potentials in figures 7(b) and 8 are corrected for the dc bias. The remaining dc bias of −0.5 V leads to slightly unequal sheath potentials at the grounded and driven electrode with a 0.25 V higher sheath potential at the driven and a 0.25 V lower sheath potential at the grounded electrode. Therefore, the measured time-averaged sheath potentials at the grounded electrode are increased by 0.25 V to correct the energy offset caused by the dc bias. Contrary to ΔE, the average sheath potential decreases with increasing γeff and reff. It is this different behaviour of the two experimentally accessible parameters, ΔE and
  , which provides a way to the determination of the two independent surface coefficients.

Figure 8. Computed data from the figures 7(a) and (b) mapped into a look-up figure linking the values of ΔE and  to the values of γeff and reff coefficients. The experimental data for SS and aluminum oxide (Al2O3) are indicated as circles. Lines between the computed conditions (black dots) are interpolated.
Download figure:
Standard image High-resolution imageThe computed parameters ΔE and  for different surface parameters γeff and reff from figure 7 can be mapped into a look-up figure linking the measured values of ΔE and
  revealed from the shape and the position of the bimodal peak structure to the values of the surface coefficients γeff and reff. Figure 8 shows this mapping and the points representing the measured ΔE and
  values for SS and alumina (Al2O3) surfaces.
It stands out that the measured parameters for SS lies in an unphysical range of γeff < 0.0. However, the uncertainties in ΔE and especially  are quite large, so that the range of possible values extend into the meaningful range of low positive γeff. Since the width of the bimodal peak structure, ΔE, scales linearly with the applied rf voltage and its absolute value is rather low (
 eV), its determination is not critically sensitive to possible errors in the measurement of the applied rf voltage. On the other hand, the average sheath potential,
  , also scales linearly with the applied rf voltage but its absolute value is rather high (
 V) resulting in a larger absolute error of 1.25 V due to the calibration accuracy of the high voltage probe as discussed in 3.5. Furthermore, the energy calibration of the mass spectrometer might introduce an additional error source that is difficult to quantify and not taken into account here. The large error in the measurement of
  limits the overall accuracy in the determination of γeff and reff. Nevertheless, figure 8 allows the simultaneous estimation of γeff and reff for both surface materials. Taking the errorbars into account, γeff is about −0.05 ± 0.15 for SS and about 0.45 ± 0.10 for aluminum oxide. Both values agree in the margin of error with ion induced secondary electron emission coefficients from the literature for SS and aluminum oxide surfaces as summarized in table 1. It should be mentioned that all literature values for Al2O3 are taken at higher ion energies of about 500 eV. However, it is expected that the energy independent potential emission dominates the ion induced secondary electron emission over the energy dependent kinetic emission up to about 500 eV to 1000 eV [10, 13] so the literature values for 500 eV should give a good approximation for low ion energies as well. Both surface materials show an electron reflection probability, reff, of about 0.7 ± 0.1. Regarding literature values for the electron reflection probability, most previous theoretical studies based on PIC/MCC simulations assumed a reff of 0.2 as initially suggested in [4]. However, a more recent experimental validation study in a similar geometrically symmetric setup found a higher value of reff = 0.7 for a SS surface [32], which is independently confirmed by our investigation.
Table 1. Summary of ion induced secondary electron emission coefficients γ in the literature for SS and aluminum oxide (Al2O3). The principle proposed by Depla et al based on the inverse proportionality of the ion induced SEE coefficient γ and the discharge voltage V [28] is abbreviated by V−1–γ-relation. Please note, that the result of [25] assumed a reflection coefficient of reff = 0.2.
| Material | Method | γ | Ref. |
|---|---|---|---|
| SS | Clean metal model | 0.07 | [6] |
| γ-CAST | 0.066 | [25] | |
| This work | 0.00–0.08 | ||
| Al2O3 | V−1–γ-relation |

| [29, 30] |
| Ion beam exp. | 0.40–0.45 | [8, 9] | |
| V−1–γ-relation | 0.33–0.69 | [70, 71] | |
| This work | 0.35–0.55 |
3.8. Physical reasons for changes in ΔE and  caused by γeff and reff

Additional insight in the influence of the surface parameters, γeff and reff, on the charged particle density distributions and potential distribution, which in turn determine the properties of the IEDF, is also provided by the PIC/MCC simulations. Below, we briefly analyze a few cases with selected pairs of γeff and reff, which lead either to the same ΔE or the same  .
.
Figure 9(a) shows the time-averaged ion and electron densities for selected γeff and reff coefficients resulting in the same ΔE. It can be clearly seen that the same ΔE values result from the same plasma density and sheath width. The difference in  in this case results from differences in the electron density ne(x) close to the electrode. The electron density in the sheath affects the space charge density (as the ion density distribution is the same for all three cases) and consequently the potential gradient. Since the sheath widths are the same, the different potential gradients result also in different time-averaged sheath potentials between about 57 V and 61 V as shown in figure 9(b). As discussed earlier, the center of the bimodal peak structure represents the time-averaged sheath potential,
  , as shown in figure 9(c). According to equations (1) and (2), the bimodal peak separation, ΔE, is still the same for all three cases, as the variations in the time dependent sheath potential, ΔΦs, and the sheath width, s, are the same.
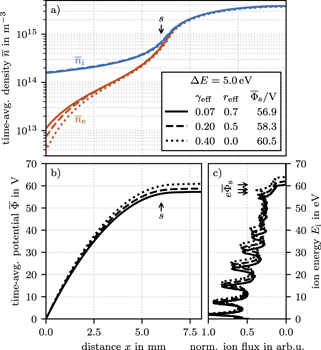
Figure 9. (a) Computed time-averaged ion density,  , and electron density,
  , (b) time-averaged potential distribution,
  , and (c) IEDF, f(Ei), for selected surface parameters, γeff and reff, with the same resulting ΔE. The data in (a) and (b) are shown only for the sheath region close to the grounded electrode.
Download figure:
Standard image High-resolution imageThere are two main reasons that cause the difference in electron density close to the electrode. First, the electron flux to the electrode differs in dependence of the emitted electron flux. According to the Bohm criterion, the ion flux to the surface must be equal for all three cases, as long as the plasma density and electron temperature is constant. The net current to the surface consisting of an impinging ion flux Γi, an impinging electron flux Γe and a flux of released electrons (γeffΓi for ion induced secondary emission and reffΓe for reflected electrons) must vanish over an rf cycle.

Since the ion flux is the same for all three cases, equation (4) can be only fulfilled, if the impinging electron flux correlates with the flux of emitted electrons in order to compensate the charge of the released electrons. Furthermore, the charge compensating electron flux to the surface is reduced by the flux of reflected electrons. The increase in the electron flux Γe for larger γeff and reff is achieved by a reduction of the sheath potential which repels low energy electrons. A constant reduction of the sheath potential along the whole rf period is observed in the simulation for the cases with increasing reff (data not shown here), allowing more electrons to reach the electrode during the sheath collapse, since also the residual voltage drop across the collapsed sheath becomes smaller. Second, the residence time of reflected electrons in the sheath is much larger than for ion induced secondary electrons. While ions hit the surface during the whole rf-cycle, electrons can reach the surface in a large number only when the sheath is collapsed. Therefore, reflected electrons are accelerated only in the low floating potential (few eVs) of the collapsed sheath and during the following sheath expansion. The long residence time of the reflected electrons in front of the electrode, together with the increased electron flux toward the electrode, leads to a higher electron density in that region for cases with large electron reflection coefficients reff. Ion induced secondary electron emission occurs during the whole rf-cycle and some of the emitted electrons are immediately accelerated in the sheath potential away from the surface resulting in a lower electron density close to the electrode.
Potentially, the electron temperature also changes with a different amount of reflected and emitted electrons, as the γ electrons can reach much higher energies due to their partial acceleration in a fully expanded sheath. To compensate for higher electron fluxes due to faster electrons, the residual floating potential in the collapsed sheath needs to increase for higher electron temperatures. However, we found no significant change in the electron energy probability function (EEPF) for the three cases, except that the very low amount (less than 0.003% of all electrons in all cases) of high energy electrons (Te ≈ 30 eV) scales with γeff. Furthermore, the effect of an increase in electron temperature is difficult to distinguish from the effect of different electron densities close to the electrode as both effects directly influence the sheath potential.
According to figure 10(a), the same averaged sheath potential can be obtained for plasma conditions with clearly different plasma densities and sheath widths for different combinations of surface coefficients γeff and reff. Even though the relative reduction in ion density and electron density within the sheath, as compared to the bulk values is about the same for both cases, the absolute space charge density in the sheath is higher for the case with higher plasma density resulting in a steeper but shorter potential gradient that leads to the same average sheath potential,  . Even though the variation in the sheath potential, ΔΦs, is the same for both cases, the difference in sheath width is responsible for the different ΔE.

Figure 10. (a) Computed time-averaged ion density,  , and electron density,
  , (b) time-averaged potential distribution,
  , and (c) IEDF, f(Ei), for selected surface parameters, γeff and reff, with the same resulting
  . The data in (a) and (b) are shown only for the sheath region close to the grounded electrode.
Download figure:
Standard image High-resolution imageThe above mentioned effects also explain the observed trends of the lines of constant γeff and constant reff in figure 8. Both parameters, γeff and reff, contribute to an increase in plasma density causing a lower sheath width. Therefore, all lines tend to a wider ΔE for rising γeff and reff. But the high energy electrons, that are released by ion impact, lead to ionizing collisions and a multiplication of the impact on the plasma density in contrast to the low energy reflected electrons. Since γeff has a larger influence on the plasma density, its influence on the bimodal peak separation, ΔE, is much larger than for reff. Even though the higher plasma density leads to a larger space charge density and hence a steeper potential gradient in the sheath, the lower sheath width reduces the time-averaged sheath potential. In total, the strong increase in ΔE and the slight decrease in  with γeff results in the shallowly decreasing lines of constant reff in figure 8. Both effects also occur for reflected electrons, but, as discussed above, the plasma density is much less affected by the low energy electrons. The dominant effect here is the influence on the space charge density and sheath potential due to the longer residence time of the reflected electrons in the sheath resulting in a much steeper decrease for lines of constant γeff.
3.9. Comparison of low-energy collisional peaks
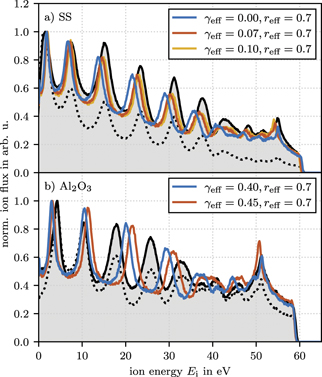
The PIC/MCC simulation provides the full IEDF, which can be compared to the measured IEDFs for the selection of γeff and reff coefficient values identified in section 3.7 as the most plausible ones. Figures 11(a) and (b) show this comparison for SS and aluminum oxide surfaces, respectively. The raw experimental data (shown by dotted lines) exhibit a faster decay of the ion flux as a function of energy as compared to the simulation results. This difference is very probably caused by a small misalignment of the mass spectrometer influencing the energy dependent ion acceptance angle of the device. We have observed several times that repeated measurements with disassembling and assembling of the chamber in between them resulted in intensity differences along the energy axis (especially at low ion energies,  5 eV) without, however, changes of the positions and shapes of the measured peaks. To allow for a better comparison between measurement and simulation, we have rescaled the measured IEDFs in figure 11 to the simulated ones by fitting a 5th order polynomial correction function to the ratio of the computed and measured data and applying the fitted ratio as an energy dependent scaling function to the measured IEDF. With this approach the energy dependent acceptance angle can be corrected without changing peak positions.
Figure 11. Computed IEDFs with ΔE and  corresponding to the experimental IEDF with (a) SS and (b) aluminum oxide surface for a pressure of 5 Pa and a rf-voltage of 250 Vpp. The corrected measured IEDFs are shown as black solid lines, the raw data as black dotted lines.
Download figure:
Standard image High-resolution image
Figure 11(a) shows three IEDFs computed for different pairs of the surface parameters γeff and reff, that are close to the ΔE and  from the measured IEDF with uncoated SS electrodes. As expected from figure 8, the best representation of the bimodal peak structure is given for the case with γeff = 0.0 and reff = 0.7. However, this case shows significant deviations at the collisional peaks. Even though the bimodal peak separation ΔE is about 0.5 eV higher for the computed IEDF with γeff = 0.10 and reff = 0.7, the agreement between measurement and simulation is remarkable. The reason for the deviation in bimodal peak separation is unknown but indicates a systematic error in the comparison possibly due to edge effects in the experiment where the 1d symmetry in broken or due to missing energy dependence of the effective emission coefficients in the simulation. Several other possible error sources are discussed in more detail in section 3.10. Nevertheless, the estimated γeff is in good agreement with the literature.
Figure 11(b) shows the comparison between the measured IEDF with Al2O3 coated electrodes and two IEDFs computed with different pairs of γeff and reff values, that are close to the experimental bimodal peak separation ΔE and average sheath potential  . Both simulated cases show significant deviations in the position of the CXC peaks. The reason for this deviation is unknown but it should be mentioned that the ion transport in the PIC/MCC simulations assume that only elastic collisions of the Ar+ ions take place. At the relatively low discharge voltage this assumption appears to be reasonable. For the elastic collisions, the differential cross section is adopted following the recommendations of Phelps [13], i.e. an isotropic channel and a backward scattering channel (in the centre-of-mass frame) is included. Phelps provided analytic forms for these components of the differential cross section [13], which are directly implemented in the simulation code. Any inaccuracies of these cross sections can have an influence on the computed IEDFs, causing small differences in the CXC peak positions as observed here.
3.10. Advantages, limitations and outlook
Finally, the advantages of the proposed method over existing techniques in the literature, remaining issues and comments on possible improvements will be summarized here. The advantages are:
- Only one material faces the plasma. Depositing a new material on both electrodes (or using a different metal for their construction) allows straightforward measurements as all necessary simulations are already included in figure 8.
- The present method avoids using tracer gases, e.g., Ne, as routinely used in PROES measurements [26] since it offers excited states with a shorter lifetime (e.g. 14.5 ns for Ne 2p1 vs 34.1 ns for Ar 2p1) that allows for a higher time resolution. Furthermore, its contribution of cascade deexcitation transitions to the population of the excited state is negligible (0.03 for Ne 2p1 vs 0.2 for Ar 2p1) allowing for a much simpler numerical description [72]. Typically about 10% of neon admixture is used that is not accounted for in PIC/MCC simulations which might lead to significant deviations in the discharge characteristics.
- The influence of plasma treatments (oxidation, nitridation, deposition of thin films, nanostructuring of the surface) on the SEE coefficients can be easily studied in situ by IEDF measurements before and after the treatment.
It should be, however, also noted that the PIC/MCC simulations were performed here for specific discharge conditions (gas type, gas temperature, gas pressure, voltage amplitude, rf-frequency and electrode distance). Changing any of these parameters will require a new set of simulations. Furthermore, the influence of systematic errors in the measurements of the conditions (electrode potential, gas pressure, gas temperature, etc) needs to be tested to determine the accuracy of this method. Especially the observed discrepancy in ΔE and deviations in the positions of the collisional peaks should be further investigated.
Several tests should be performed in the future to prove the validity of this method. First, the current technique for the estimation of γeff and reff is strongly limited by the uncertainty in the average sheath potential,  , caused by the limited calibration accuracy of the high voltage probe. More accurate calibration measurements would reduce the surface coefficients' error and improve the significance of the proposed approach. Second, the effect of possible inhomogeneities due to the electrode geometry can be checked either with an electrode setup with a dielectric confinement such as discussed by Schulenberg et al [32] or with a similar cup shaped electrode geometry as presented here but with a much larger aspect ratio of electrode diameter to electrode distance. A dielectric confinement would eliminate effects of the approaching electrodes in the cup shaped geometry but introduces a second material that is in contact to the plasma and might lead to additional unwanted effects. A cup shaped electrode setup with a higher aspect ratio would increase the distance from the cylinder wall to the center of the discharge and should, therefore, reduce effects of the possible edge inhomogeneity in the center significantly. In addition, a 2d3v PIC/MCC simulation could also be used to account for possible edge effects in a 2d axially symmetric geometry. Third, the validity of the method needs to be checked at other discharge conditions like different gas pressures, gas types, rf-voltages, rf-frequencies and electrode distances. A further development of the PIC/MCC model, that includes rare ions with less collisions such as Ar2+ or
  , would allow to extend this method to higher pressures, since the bimodal peak of these ions can be measured at higher pressures as well. Furthermore, higher pressures, lower ion masses and lower excitation frequencies resulting in a larger separation of the bimodal peaks which could further improve the sensitivity of the presented technique.
Applying the proposed method to lower pressures, shorter electrode distances, higher voltages or other gases involves the risk of neglecting true secondary emission and inelastic reflection under conditions at which they need to be accounted for. As the mean free path of the electrons can become comparable or even larger than the electrode distance, a significant number of high energy electrons from ion induced secondary emission can cross the discharge gap without collisions and impinge on the opposite electrode. In such cases, the determination of an effective elastic reflection coefficient is no longer meaningful. However, the conditions of the present study belong to the range of validity of a simplified surface model.
4. Conclusions
In this work, we have proposed a computationally assisted diagnostic method for the simultaneous determination of two surface coefficients which are important in capacitively coupled rf discharges: the effective ion induced secondary electron emission coefficient (γeff) and the effective electron reflection coefficient (reff). The method is based on a comparison of specific features in experimentally obtained and computed IEDFs. The IEDFs of Ar+ (40 amu) ions were measured with an energy-selective mass spectrometer at the grounded electrode of a geometrically symmetric rf-CCP with SS and Al2O2 electrode surface materials. The experimental data were compared to the results of 1d3v PIC/MCC simulations performed with a variation of γeff and reff as the only simulation parameters with the aim to test the possibility of determination of these coefficients for various materials.
The computational results showed that the IEDF and particularly the width of the bimodal peak structure ΔE and its location at the averaged sheath potential  depend on the effective SEE coefficient γeff and effective electron reflection coefficient reff. This is the consequence of the strong influence of these coefficients on plasma parameters such as plasma density, sheath width and the spatiotemporal potential distribution.
The simulation results obtained for a wide range of γeff and reff values revealed that both corresponding surface processes influence the plasma density in different ways: ion induced secondary electrons can be accelerated in the expanded sheath potential to high energies, that lead to additional ionization which increase significantly the plasma density. Therefore, γeff mainly influences the bimodal peak separation, ΔE, as it depends on the ion transit time, which is influenced by the sheath width that is determined mainly by the plasma density. On the other hand, reflected electrons only occur when electrons hit the surface during the sheath collapse. These electrons are barely accelerated in the low remaining floating potential and can not further ionize the background gas. Therefore, the influence of reff on the plasma density is limited. But these slow electrons increase the electron density in the sheath region close to the electrode, which reduces the averaged space charge density and, consequently, the averaged potential gradient. The reduction of the sheath voltage reduces also the sheath potential in the collapsed phase. The lower collapsed sheath potential repels less electrons and allows for a higher electron flux to the surface that compensates the positive charge at the surface from the incident ion flux and flux of released secondary electrons. As a result, reflected electrons mainly influence the averaged sheath potential,  . The individual influence of the effective surface coefficients γeff and reff on the properties of the IEDF (ΔE and
  ) allows a unique determination of both coefficients simultaneously in an in situ plasma environment. The values obtained for SS and Al2O2 are in good agreement with values available in the literature, even though the uncertainty in the measurement of
  limits currently the accuracy of the method.
Acknowledgments
This work was supported by the National Office for Research, Development and Innovation (NKFIH) via Grant K134462 and the German Research Foundation (DFG) via Grant 426208229.
Data availability statement
The data that support the findings of this study are available upon reasonable request from the authors.