
Abstract
Li- and Mn-rich battery active materials like Li1.14(Ni0.26Co0.14Mn0.60)0.86O2 (LMR-NCM) are promising cathode active materials (CAMs) for next-generation Li-Ion batteries, as they combine a higher energy density than state-of-the-art materials at lower materials cost. However, they suffer from high gassing, particularly during formation, and from voltage and capacity fading over their cycle life. While electrolyte additives are known to alleviate these issues, it will be shown that a surface modification of LMR-NCM CAMs can also reduce their gassing during formation and improve their long-term stability. Here, we present a detailed analysis of a water-based post-treatment for LMR-NCMs, which not only lowers their initial gassing by more than 90%, but also avoids the issue of transition metal dissolution observed with conventionally used washing procedures at low ph. We thus utilized a buffered solution to increase the pH into the stability window of LMR-NCM materials (near/above pH 7), while also providing a controlled Li+/H+-exchange that is not possible with unbuffered aqueous solutions like pure H2O, H2O/alcohol mixtures, or acids. TGA-MS experiment showed that heating of Li+/H+-exchanged LMR-NCM leads to the formation of a protective (near-)surface spinel layer, and full-cell cycling displayed a drastic improvement of the capacity retention.
Export citation and abstract BibTeX RIS

This is an open access article distributed under the terms of the Creative Commons Attribution Non-Commercial No Derivatives 4.0 License (CC BY-NC-ND, http://creativecommons.org/licenses/by-nc-nd/4.0/), which permits non-commercial reuse, distribution, and reproduction in any medium, provided the original work is not changed in any way and is properly cited. For permission for commercial reuse, please email: permissions@ioppublishing.org.
To lower the environmental impact of the global transportation sector, a transition to battery electric vehicles (BEVs) is the currently pursued approach. 1–4 Li-Ion batteries are the de-facto standard for this transition, as they achieve high energy densities at low costs. Nevertheless, the cost of state-of-the-art cathode active materials (CAMs) has to be further reduced for mass market penetration of BEVs. 5,6 In a first step, the amount of cobalt in the currently used Ni-rich CAMs based on layered transition metal oxides (e.g., 10% Co in LiNi0.8Co0.1Mn0.1O2 (NCM811)) has to be reduced, which is pursued by the development of Ni-90 materials or LiNiO2. 7–9 However, even with Ni-rich layered transition metal oxides, a reversible capacity of ≈200 mAh g−1 cannot be exceeded due to structural instabilities at high degrees of delithiation, leading to lattice oxygen release from the (near-)surface 10,11 of the CAM particles and, ultimately, to a collapse of the CAM bulk structure. 12
Further CAM material cost reductions would be possible through Li- and Mn-rich NCM versions (LMR-NCMs: Li1+x(NiaCobMnc)1-xO2, with a + b + c = 1 and x ≈ 0.1–0.2) that are considered as next-generation CAMs for high-energy battery packs 13–17 and that can be synthesized without cobalt. 18–21 A special feature of these materials is the long activation plateau occurring at 4.5 V vs Li+/Li during the first charge cycle, whereby charging beyond this plateau leads to high first-charge capacities above 300 mAh g−1. 22,23 While LMR-NCMs can achieve a high reversible capacity of over 250 mAh g−1, they still suffer from high gassing (mostly in the first few cycles), impedance increase, and detrimental voltage and capacity fading over their cycle-life. 16,17,24–27 It is also known in the literature that these types of materials undergo a reconstruction during their first cycles, resulting in the formation of an O-depleted (near-)surface layer accompanied by the release of lattice oxygen, whose reaction with the electrolyte results in a strong gas evolution (CO, CO2, H2, etc). 10,15,25,28,29 This additional gassing substantially complicates the formation of large-format battery cells 17 and can also lead to cell bulging over extended cycling. 16 To address these issues, different approaches were tested, including new synthesis routes, the use of additives, and/or post-treatments. 30–35 Some LMR-NCM treatments have been explored to form a spinel surface film on the CAM particles in order to reduce gassing and stabilize the surface, e.g. by impregnating LMR-NCM with Na2S2O8 followed by heating at 200 °C, 36 or by treating the material with an aqueous acid and drying it at 135 °C. 34,37 Especially acid-treatments of LMR-NCMs are well-known in the literature and are used to improve the electrochemical activity of LMR-NCMs such as the phase end-member Li2MnO3. 22 In some studies, not only the first charge capacity was drastically increased, but also the capacity retention of the treated material during cycling was increased. 14,23,34,37,38 The common understanding behind these positive effects is that the surface is either etched to increase the surface area and therefore improve the rate performance, or that the surface is protonated and that this protonated phase can be decomposed at elevated temperatures to form a stabilizing O-depleted surface phase (e.g. a spinel-like layer). 35,38 Past work, for example, has shown that these O-depleted layers lead to reduced oxygen release and improved cycle life. 34,35,39,40 While acid-based treatments have been shown to reduce gassing and improve cycling stability, they have the undesirable side-effect that transition metals are dissolved from the CAM particles when washing with low pH solutions (e.g., with dilute acids), which can destabilize the CAM surface and increase the cost of waste-water treatment. 39
The goal of this study is the avoidance of the dissolution of transition metals by utilizing aqueous buffer solutions with a pH that is sufficiently high to avoid transition metal dissolution (i.e., a pH near/above 7). 39 This was verified by ICP-OES analysis of the solutions after the washing process in a HPO4 2−/H2PO4− buffer (pH = 7.2). Furthermore, the use of buffered washing solutions allows to control the extent of the Li+/H+-exchange by the molar ratio of the CAM (i.e., of the moles of lithium) and the buffer salts, which ultimately controls the thickness of the protective spinel surface layer on the LMR-NCM particles that is formed upon subsequent heat-treatment of the ion-exchanged LMR-NCM. The buffer-washed LMR-NCM materials were characterized by TGA-MS under Ar to determine the temperature region in which H2O and O2 are released, accompanied by the formation of an O-depleted, spinel-like layer on the LMR-NCM particle surface. This new concept of reconstructing the surface of CAM particles into a protective spinel-like surface layer, rather than coating the CAM particles, is sketched in Fig. 1. On-line mass spectrometry (OEMS) measurements showed that LMR-NCMs with such an oxygen-depleted, spinel-like surface layer do evolve an order of magnitude less gasses during the first charge. 41 While writing this manuscript, we noted that a similar concept was described very recently by Chang et al., 21 who exposed a Li- and Mn-rich layered transition metal oxide based CAM to an aqueous NH4H2PO4 solution, followed by solvent evaporation and heat-treatment to form a phosphate doped CAM with a spinel-like surface layer. Next to a more detailed understanding of the processes during buffer-washing and the subsequent heat-treatment of LMR-NCM materials, the following will also provide cycle-life data for graphite/LMR-NCM full-cells based on buffer-washed and heat-treated LMR-NCM materials to demonstrate the superior performance of such treated materials.
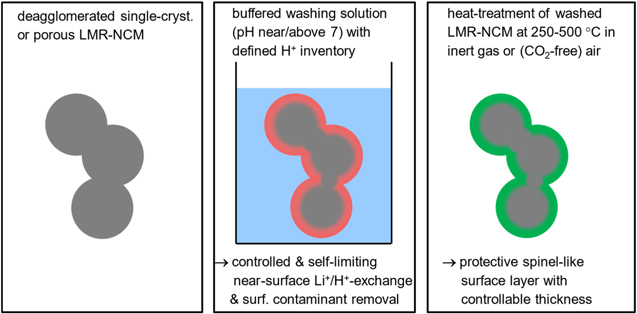
Figure 1. Sketch of the washing concept for LMR-NCM CAMs in buffered aqueous washing solutions that allow for a controlled and self-limiting Li+/H+ exchange and the removal of soluble surface contaminants without transition metal dissolution (middle panel), followed by a heat-treatment between 250 °C–500 °C that leads to the formation of a protective spinel-like surface layer (right panel). Best suited for this approach are porous or deagglomerated single-crystalline LMR-NCMs.
Download figure:
Standard image High-resolution imageExperimental
Synthesis of reference materials
To better understand the mechanism behind buffer-washing, NiOOH and MnOOH reference materials were synthesized. NiOOH was prepared according to Audamer et al. 42 For this, 5.00 g (≡54.9 mmol) of a battery-grade Ni(OH)2 precursor (provided by BASF SE, Germany) were dispersed in 25 ml of purified Millipore water (15 MΩ cm, Merck KGaA, Germany) and oxidized in an excess of an aqueous 30% NaOCl solution (containing 20.07 g NaOCl (≡269.7 mmol); Sigma-Aldrich, Germany) at 70 °C for 4 h. A black-solid was obtained which was washed, vacuum-filtrated, and dried at 70 °C in vacuo. MnOOH was synthesized using an adapted procedure by Jang et al. 43 For this, 1.00 g (≡6.33 mmol) of KMnO4 (Sigma-Aldrich, Germany) and 1.19 g (≡7.91 mmol) of MnSO4 (Sigma-Aldrich, Germany) were dissolved in 25 ml Millipore water and then heated to 75 °C and mixed for 4 h. The resulting brownish precipitate was vacuum-filtrated and then washed with 100 ml purified Millipore water. All samples were dried in a glass oven (Büchi, Switzerland) for at least 4 h at 70 °C under dynamic vacuum to remove physisorbed H2O, and subsequently stored in an Ar-filled glove box (<0.1 ppm O2 and H2O, MBraun, Germany) without exposure to ambient air after drying.
Preparation of washed LMR-NCMs
The LMR-NCM (Li1.14(Ni0.26Co0.14Mn0.60)0.86O2) was received from BASF SE (Germany) and is based on a porous precursor that results in a porous CAM with a high BET surface area of 5.3 m2 g−1. 25 This material was washed in preliminary experiments with either a 0.11 M H2SO4 solution or with various buffer solutions shown in Table I. Contrary to sulfuric acid and the buffers with a pKa below 7, the HPO4 2−/H2PO4 − buffer showed negligible transition metal dissolution at room temperature (as did the B(OH)4 −/B(OH)3 buffer) and was therefore used for further experiments.
Table I. pKa-values of various buffer systems, ranging from a pKa of 2.2 for the PO4 3−/HPO4 2− system to a borate buffer system with a pKa of 9.2. Sulfuric acid is used as an example for a strong and unbuffered acid.
| Buffer-system | pKa |
|---|---|
| HSO4 −/H2SO4 | −2.8 |
| PO4 3−/HPO4 2− | 2.2 |
| CH3COO−/CH3COOH | 4.8 |
| HPO4 2−/H2PO4 − | 7.2 |
| B(OH)4 −/B(OH)3 | 9.2 |
For the washing process, either purified Millipore water, 0.11 M H2SO4, or K2HPO4/KH2PO4 buffered solutions were used, whereby 5 g of the as-received LMR-NCM were added into 25 ml of the aqueous washing solution (corresponding to a water:CAM mass ratio of 5:1) and stirred with a magnetic stirrer for between 1 min and 24 h at different temperatures (25 °C–90 °C) in a sealed vessel which was not purged before sealing. The various examined washing procedures are listed in Table II. After the washing step, if not otherwise stated, the washed CAM was thoroughly post-washed (3 × 25 ml) with purified water at room temperature and then dried under dynamic vacuum at 70 °C overnight (drying oven 585, Büchi, Switzerland). Prior to OEMS and/or full-cell testing of the washed LMR-NCM samples, they were heated to 300 °C under dynamic vacuum overnight (only few experiments were also conducted with heat-treatments at 120 and 450 °C). This is based on the TGA-MS data (discussed later), we expect that this is equivalent to heating under inert gas or air.
Table II. Examined washing procedures for the Li1.14(Ni0.26Co0.14Mn0.60)0.86O2 CAM. Each washing experiment was conducted with 5 g of the LMR-NCM CAM, using 25 ml of the specified type of washing fluid as well as the specified washing temperature and time. The last column specifies whether the washed CAM was further post-washed (with 3 × 25 ml purified water) after vacuum filtration or not. At the end, all CAMs were dried under dynamic vacuum at 70 °C overnight. Note that the "x nm" term in the sample designation refers to the estimated spinel surface layer thickness (see Results section), which is based on the different percent of the Li+ ions that are targeted to be exchanged by H+ (referred to as %Liexchanged, see Eq. 4), thus referring to a nominal thickness value.
| Sample designation | Washing fluid (25 ml) added to 5 g LMR-NCM | Washing temp. [°C] | Washing time | Post-wash |
|---|---|---|---|---|
| acid-washed | 0.11 M H2SO4 | 70 | 4 h | yes |
| water-washed | purified H2O | 70 | 24 h | yes |
| 2.1 nm buffer-washed (≡ 4.9% Li+ exchanged w. H+) | 0.11 M K2HPO4/KH2PO4 | 70 | 4 h | yes |
| 4.2 nm buffer-washed (≡ 9.7% Li+ exchanged w. H+) | 0.22 M K2HPO4/KH2PO4 | 25, 70, 90 | 1, 2, 4, 10, 15, 20, 30, 45 min, and 1, 1.5, 2, 4, 6, 8, 24 h | yes |
| 8.4 nm buffer-washed (≡ 19.4% Li+ exchanged w. H+) | 0.44 M K2HPO4/KH2PO4 | 70 | 4 h | yes |
| 4.2 nm buffer-washed (no post-wash) (≡ 9.7% Li+ exchanged w. H+) | 0.22 M K2HPO4/KH2PO4 | 70 | 4 h | no |
Inductively coupled plasma optical emission spectroscopy
Inductively coupled plasma optical emission spectroscopy (ICP-OES) analysis of the washing solution that was filtrated after the washing process was done by first dispersing small amounts of the washing solution in ultrapure water and then using an Agilent 725 ICP-OES to measure the transition metal and lithium concentrations.
Thermogravimetric analysis with coupled mass spectrometry (TGA-MS)
For TGA-MS analysis, a TGA system (Mettler Toledo, Switzerland) coupled to a mass spectrometer (Pfeiffer Vacuum, Germany) was used. All analyzed samples were dried in a vacuum oven (Büchi, Switzerland) for at least 3 h at 70 °C under dynamic vacuum prior to analysis. The as-received samples and the washed samples were analyzed with the following protocol: First, a conditioning step at 25 °C for 10 min with an argon flow rate of 200 ml min−1 was done to remove any air introduced in the TGA-MS sample chamber during the sample transfer. Afterwards, the Ar flow rate was changed to 20 ml min−1, followed by a rest phase of 5 min at 25 °C. Then the temperature was increased from 25 °C to 120 °C with a heat ramp of 10 K min−1 and held at 120 °C to remove adsorbed water. Finally, the temperature was ramped from 120 °C to 1125 °C at 10 K min−1, followed by a temperature hold phase of 30 min. All mass traces from the MS were normalized to the argon signal (m z−1 = 36).
X-ray photoelectron spectroscopy measurements
The surface analysis of the as-received, buffer-washed LMR-NCMs and reference samples was carried out by X-ray photoelectron spectroscopy (Axis, Supra, Kratos, UK). A PEEK or Kapton-sample holder in a floating ground configuration was used to avoid differential charging. 44 The samples were mounted in a glovebox with inert atmosphere and were transferred with minimized exposure to ambient air (∼15 s). The samples were kept in the antechamber until a pressure of ≈10−8 Torr was achieved and were then transferred to the sample analysis chamber, where the pressure was always kept at ≈10−9 Torr during the whole measurement period. Sample irradiation was carried out with monochromatic Al Kα radiation (1486.6 eV) with an emission current of 15 mA. For the Ag 3d5/2 line, the full width at half-maximum (FWHM) was 1.04 eV under the recording conditions (using a pass energy of 40 eV). Elemental spectra were recorded with a step size of 0.05 eV and a pass energy of 40 eV. Low energy electrons were used for charge neutralization, and the spectra were calibrated to the adventitious carbon peak with a binding energy (BE) of 284.8 eV. To avoid any errors in charge neutralization, the binding energy differences of the different elemental peaks in the survey spectra were compared. Short acquisition time spectra (∼1 min) in the O 1 s region were recorded before and after each set of experiments in order to check that the samples did not suffer from radiation damage. The spectra were fitted using a mixture of a Lorentzian (30%) and Gaussian (70%) shape function on top of a Shirley background; the constraints on binding energy and full width at half maximum (FWHM) for the different species are given in Table III.
Table III. XPS peak fitting parameters used for identification and quantification of the different surface species of the as-received, buffer-treated, and reference samples.
| Element/region | Assigned species | Binding energy [eV] (constrained range) | FWHM [eV] (constrained range) |
|---|---|---|---|
| carbon C 1 s | adventitious carbon | 284.8 (fixed) | 1.0–1.3 |
| oxygen O 1 s | layered oxide ("layered") | 529.2 (±0.1) | 1.0–1.3 |
| oxygen depleted layer ("O-depleted") | 529.8(±0.1) | 1.0–1.3 | |
| protonated layered oxide ("MOOH") | 530.5(±0.1) | 1.0–1.3 | |
| surface carbonates/hydroxides ("M-OH/CO3") | 531.5 (±0.2) | 1.5–2.25 |
Electrode preparation
Cathode electrodes were prepared by dispersing 92.5%wt of the active material (Li1.14(Ni0.26Co0.14Mn0.60)0.86O2; BASF SE, Germany), 4.0%wt conductive carbon (Super C65, Imerys, Switzerland), and 3.5%wt polyvinylidene fluoride binder (PVDF, Solef 5130, Solvay, Belgium) in NMP. The powders were weighed in an argon-filled glovebox (O2 and H2O < 0.1 ppm, MBraun, Germany), in which the active materials were also stored. The conductive carbon and binder were mixed in a planetary mixer (ARV-310, Thinky, USA) at 1000 rpm for 1 × 5 min. Afterwards NMP was added in 3 increments under ambient air, and the slurry was mixed again at 2000 rpm for 3 × 5 min. To the resulting slurry, the active material was added, and the slurry was mixed for 1 × 5 min. The final electrode ink was coated onto aluminum foil (thickness 18 μm, MTI Corporation, USA) using a four-edge blade (RK PrintCoat Instruments, UK). Subsequently, the coating was dried in a convection oven (T = 55 °C) for at least 3 h to remove the NMP. 14 mm diameter electrodes were punched out, compressed in a KBr-Press with 2.5 tons each, and dried overnight at 120 °C under dynamic vacuum in a glass oven (drying oven 585, Büchi, Switzerland), from where they were transferred into a glovebox (O2 and H2O < 0.1 ppm, MBraun, Germany) without exposure to ambient air. The cathode loadings were 8.5 ± 0.6 mgLMR-NCM cm−2 (the loading of each electrode was determined to a precision of ±0.1 mgLMR-NCM cm−2 using a micro-balance), corresponding to 2.1 ± 0.15 mAh cm−2 (based on a nominal specific capacity of 250 mAh/gLMR-NCM); the cathode coatings had a thickness of ∼50 μm and a porosity of ∼45%.
Graphite anodes were prepared with graphite (T750, SGL carbon, Germany) and PVDF at a weight ratio of 95:5. For the ink preparation, graphite and PVDF were dispersed in NMP and mixed in a planetary mixer (Thinky, USA; at 2000 rpm for 15 min). The ink was coated onto copper foil (thickness 12 μm, MTI Corporation, USA). The coating was dried in a convection oven (T = 55 °C) for at least 3 h to evaporate the NMP. 15 mm diameter electrodes were punched out, compressed in a KBr-Press with 0.5 tons, and dried overnight at 120 °C under dynamic vacuum in a glass oven (drying oven 585, Büchi, Switzerland), from where the samples were transferred into a glovebox (O2 and H2O < 0.1 ppm, MBraun, Germany) without exposure to ambient air. The anode electrodes with an areal loading of 6.7 ± 0.2 mggraphite cm−2 were oversized in terms of areal capacity (2.4 ± 0.07 mAh cm−2, based on a nominal specific capacity of 355 mAh/ggraphite) compared to the cathode electrodes in order to minimize the risk of Li-plating. the anode coatings had a thickness of ∼45 μm and a porosity of ∼40%.
Cell assembly and electrochemical testing
Full-cell coin cells (2032-type) were assembled in a glove box using a 17 mm diameter Celgard C2500 separator, sandwiched between the 14 mm diameter LMR-NCM cathodes and the 15 mm diameter anodes, and adding 80 μl of electrolyte (1 M LiPF6 in FEC:DEC 2:8 g:g; note that no additive was used here). After assembly, all cells were left for a rest period of 2 h prior to charge/discharge cycling, and C-rates are referenced to a nominal LMR-NCM capacity of 250 mAh g−1; all coin cell experiments were conducted at 25 °C. The full-cells with LRM-NCM cathodes were activated in the first cycle at a C-rate of C/15 to a full-cell voltage of 4.7 V with a constant-current procedure (CC) and then discharged at C/15 to 2.0 V (CC); in subsequent cycles, the upper cutoff cell voltage was reduced to a full-cell voltage of 4.6 V. Afterwards, 3 cycles with a 0.1 C CC charge and 0.1 C CC discharge were applied.
These initial formation cycles were followed by a rate test for which the cell was charged/discharged for 2 cycles each at 0.3 C (CCCV)/0.5 C (CC), 0.7 C (CCCV)/1 C (CC), 0.7 C (CCCV)/2 C (CC), 0.7 C (CCCV)/3 C (CC) and 0.7 C (CCCV)/1 C (CC) again, whereby all CV-steps were terminated after 1 h or when the current dropped below 0.01 C. After the rate test, a cycle-life test was conducted, starting with 3 cycles at 0.1 C CC charge and 0.1 C CC discharge, followed by 30 cycles at a charge rate of 0.7 C (CCCV) and a discharge rate of 1 C (CC), whereby the CV-step is defined as above. This sequence of 3 slow and 30 fast discharge cycles was repeated several times.
To investigate the best drying temperature for the buffer-washed LMR-NCM materials, half-cells with 4.2 nm buffer-washed materials heated to different drying temperatures were built. These cells contained a cathode with 4.2 nm buffer-washed LMR-NCM, a lithium metal anode, 80 μl electrolyte (1 M LiPF6 in FEC:DEC 2:8 g:g), and a glassfiber separator (250 μm thickness and punched to 17 mm diameter, borosilicate glass, VWR, Germany). These cells were charged to 4.8 V in CC mode with a current of C/15 and discharged to 2.0 V at the same C-rate. Afterwards they were charged (CC) and discharged (CC) at C/10 between 4.7 V and 2.0 V.
On-line electrochemical mass spectrometry (OEMS)
For OEMS experiments, LMR-NCM working electrodes were coated onto a stainless-steel mesh (SS316, aperture 26 μm, wire diameter 25 μm, The Mesh Company Ltd., UK), as a porous current collector is required to allow for a fast diffusion of gases released from the working electrode to the capillary-leak inlet into the mass spectrometer of the OEMS; 45 the electrode inks were the same as described above. Electrodes for OEMS experiments were punched out with a diameter of 15 mm and had an LMR-NCM loading of 8.5 ± 1.3 mgLMR-NCM/cm2. One-compartment OEMS cells were assembled with a lithium metal counter electrode (punched to 17 mm diameter), a glassfiber separator (250 μm thickness and punched to 28 mm diameter), an LMR-NCM working electrode, and 300 μl of 1.5 M LiPF6 in FEC-only electrolyte.
The OEMS cells were connected to the mass spectrometer, held at OCV (open circuit voltage) for 3 h, and then charged to 4.8 V vs Li+/Li at a C/10 rate (referenced to a nominal specific capacity of 250 mAh g−1), followed by a 1 h CV step at 4.8 V, all being done at 25 °C. For conversion of the OEMS ion current signals, Iz, into units of [ppm], the cell was purged with a calibration gas containing H2, CO, O2, and CO2 (the respective concentration of the gases is 2000 ppm in Ar, Westfalen, Germany). With the calibration gas we can quantify the concentrations of H2 (m z−1 = 2), CO (m z−1 = 28), O2 (m z−1 = 32), and CO2 (m z−1 = 44) in the cell head space.
Results
Li+ and TM-ion release from LMR-NCM during water- or acid-washing
To investigate the extent of the Li+/H+-exchange and of transition metal dissolution during washing, the amount of lithium and transition metal ions in the washing solution was determined by ICP-OES. In preliminary experiments, 5 g of LMR-NCM were dispersed in 25 ml purified water and stirred for 24 h. Based on measurements with nickel-rich NCMs reported in the literature, this was expected to result in the dissolution of lithium containing surface contaminants (LiOH and Li2CO3) and in a Li+/H+-exchange in the LMR-NCM: 39,40

However, with pure water, only a small amount of lithium was found in the washing solution, even at elevated temperatures of 70 °C and long reaction times of 24 h (c(Li)<7 mM), reaching a maximum pH of ∼11.8. This small amount of dissolved lithium ions, we believe, is largely due to the dissolution of lithium containing surface contaminants (e.g., Li2CO3) rather than to a Li+/H+-exchange. Indeed, converting the measured <7 mM lithium concentration into an equivalent amount of Li2CO3 surface contamination of the LMR-NCM material, would amount to <0.13%wt Li2CO3, which is a reasonable amount of lithium-containing surface impurities on such a material. On the other hand, if all the dissolved lithium were due to a Li+/H+-exchange, this would correspond to only 0.27 mol% of the lithium that is contained in the 5 g of the LMR-NCM sample (56.6 mmol of Li based on a molecular weight of 88.4 g mol−1 for Li1.14(Ni0.26Co0.14Mn0.60)0.86O2).
Next, the washing of 5 g LMR-NCM with 25 ml 0.11 M H2SO4 at 70 °C for 4 h was examined (see first row in Table II). In this case, reaction 1 can be rewritten as:

Table IV shows the lithium, nickel, manganese, and cobalt ions that were determined in the washing solution.
Table IV. Leached metals detected in the filtrated washing solution after washing of 5 g LMR-NCM with 25 ml 0.11 M H2SO4 (pHstart = 0.67) for 4 h at 70 °C (pHfinal ≈ 2.2). The metal ion concentrations were measured by ICP-OES. The last column gives the mol of leached metal per mol of LMR-NCM (based on a molecular weight of 88.4 g per mol of Li1.14(Ni0.26Co0.14Mn0.60)0.86O2), whereby the mol% Li are referenced to the total amount of lithium in the material and the mol% for the Σ TM refer to the overall percentage loss of transition metals.
| Leached metals | Measured amount [mg l−1] | Measured amount [mM] | Amount leached from the LMR-NCM [mol%] |
|---|---|---|---|
| lithium | 1234 | 179 | 6.9 |
| nickel | 830.1 | 14.1 | 2.8 |
| cobalt | 326.7 | 5.55 | 2.0 |
| manganese | 830.0 | 15.1 | 1.3 |
| Σ TM (Ni+Co+Mn) | 1987 | 34.8 | 1.8 |
As shown in Table IV, the molar concentration of the sum of dissolved transition metals (34.8 mM) in the washing solution is quite significant, amounting to ∼20% of that of the dissolved/ion-exchanged lithium concentration (179 mM). By considering that the 5 g of the LMR-NCM material corresponds to 56.6 mmol and that each mol of the Li1.14(Ni0.26Co0.14Mn0.60)0.86O2 material contains 1.14 mol of Li, 0.22 mol of Ni, 0.12 mol of Co, and 0.52 mol of Mn, the molar fraction of lithium dissolved/ion-exchanged from the LMR-NCM (6.9 mol%; see last column of Table IV) is only ∼4-fold higher than the molar fraction of dissolved transition metals (1.8 mol%). This clearly indicates a substantial dissolution of transition metals when washing LMR-NCM in 0.11 M H2SO4, consistent with the report by Hamam et al. 39 It should be noted, however, that the ratio of the dissolved transition metals does not correspond to what one would expect based on the LMR-NCM stoichiometry, whereby particularly the manganese concentration is very low compared to that of nickel. The origin of this is not clear, as the pH of the filtrated washing solution (∼2.2) is low enough to guarantee a large solubility in the washing solution of all of the transition metal ions dissolved from the LMR-NCM. However, since the focus of our study was to develop a washing process that would not result in any significant dissolution of transition metals, we did not further explore the detailed reactions during acid-washing, as one can already clearly conclude from this experiment that washing LMR-NCM with 0.11 M H2SO4 not only leads to an extensive Li+/H+-exchange but also to a significant and undesired dissolution of transition metals.
Li+ and TM-ion release from LMR-NCM during buffer-washing
Based on the strategy described in Fig. 1, the formation of a passivating spinel-like surface layer requires the heat-treatment of an LMR-NCM material whose near-surface region had been ion-exchanged to a significant extent with protons. At the same time, to maintain the integrity of the active material, the dissolution of transition metals should be avoided, which requires a pH of 7 or higher. 39 The latter would be possible with pure water but, unfortunately, water-washing of the here examined LMR-NCM does not lead to any significant Li+/H+-exchange (only <0.27 mol% at 70 °C over 24 h, as described above). On the other hand, these two requirements of a pH near/above 7 and of a significant Li+/H+-exchange can be met by using a buffered aqueous washing solution, allowing for a controlled supply of protons for reaction 2 while maintaining a pH near the pKa of the buffer (i.e., consuming 90% of the protons that can be provided by the buffer leads to an increase of the pH by only 1 unit). Here, we used an aqueous K2HPO4/KH2PO4 buffer at equimolar concentrations, which has an initial pH of ∼7.2 and which can supply a significant amount of protons (more precisely H3O+) near neutral pH to drive reaction 2:

Next, we will estimate the required amount of Li+/H+-exchange in order to generate a spinel-like surface layer with a targeted thickness. If the pH is at/above ∼7 to avoid transition metal dissolution, the ratio between ion-exchanged lithium and supplied protons is expected to follow reaction 2, i.e., each provided proton should be able to ion-exchange with an intercalated lithium, assuming that the proton concentration and the temperature are high enough to drive the reaction. Under these conditions, the thickness of the spinel-like surface layer can be estimated based on the following simplifying assumption:
- (i)upon heating of a Li+/H+-exchanged LMR-NCM, the protons lead to a reconstruction of the LMR-NCM particle surface into a spinel-like layer (i.e., no reaction will occur in the bulk of the material);
- (ii)ignoring the differences in the crystal density between the LMR-NCM and the reconstructed spinel-like surface layer;
- (iii)LMR-NCM particles that are accessible to the washing solution will not crack further upon cycling, as initially non-wetted surfaces would not form a protective surface layer (most closely met by single crystal LMR-NCMs and by LMR-NCMs that have a morphology like that that is produced by porous precursors; 20 it should also work with polycrystalline non-porous LMR-NCM particles, as washing, particularly at elevated temperatures, will likely open most pores between particles, as shown previously for NCM811 46 );
- (iv)approximating the CAM particles by spheres of equal size.
In this case, the ratio of the CAM particle shell volume that will be converted to a spinel-like phase (Vshell) to the total CAM particle volume (Vtotal) would correspond to the fraction of H+-exchanged lithium, and the surface layer thickness can be approximated by a spherical assumption, as outlined in the following for the here used LMR-NCM material.
The radius of a spherical particle (rparticle) of the LMR-NCM material with a BET surface area of A = 5.3 m2 g−1 and a crystal density of ρ = 4.5 g cm−3 can be estimated by Eq. 4:
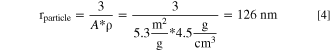
Using this estimated LMR-NCM particle radius of rparticle = 126 nm and targeting a 4.2 nm thick spinel-like surface layer (tshell) as an initial estimate for a sufficiently protective spinel-like surface layer, the required Vshell/Vtotal ratio can be determined, which in turn corresponds to the percentage of H+-exchanged lithium (%Liexchanged) that would need to be achieved.
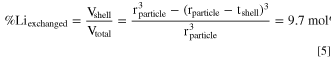
In case of stoichiometric NCMs, all the lithium of the material is located in the lithium layers, so %Liexchanged in Eq. 5 refers to the total amount of lithium. On the other hand, for LMR-NCMs, one of the two discussed crystallographic models that is adopted suggests that part of the lithium is located in the transition metal layer and will only be deintercalated towards the end of the second charge plateau during the first-cycle activation. 13,47 Since the Li+/H+-exchange by immersion into a washing solution is likely restricted to the lithium in the lithium layer, %Liexchanged in Eq. 5 will here be referenced to the lithium in the lithium layer only, i.e., to 1 mol of lithium per mol of Li1.14(Ni0.26Co0.14Mn0.60)0.86O2 or to 1 mol of lithium in 88.4 g of Li1.14(Ni0.26Co0.14Mn0.60)0.86O2.
The washing experiments in this study used 5 g LMR-NCM (≡56.6 mmol LMR-NCM or lithium in the lithium layer) and 25 ml of washing solution (see Table II). Thus, a value of %Liexchanged = 9.7 mol% (targeting a 4.2 nm thick spinel-like surface layer; see Eq. 5) amounts to 5.5 mmol of lithium or to a lithium concentration of 0.22 M when dissolved in 25 ml washing solution. Therefore, a washing experiment was conducted using 25 ml of an aqueous K2HPO4/KH2PO4 buffer with a 0.22 M concentration for each salt, which upon the complete conversion of H2PO4 − to HPO4 2− could provide a 0.22 M concentration equivalent of protons, assuming of course that reaction 2 can take place at such a high pH (upon the consumption of a 90% of the 0.22 M equivalent of protons, the pH would increase from the initial buffer pH of 7.2 to a pH of ∼8.2 in the presence of ∼0.02 M H2PO4 − and ∼0.42 M HPO4 2−).
In order to determine the extent of lithium dissolution/ion-exchange in the K2HPO4/KH2PO4 (0.22/0.22 M) buffer, 5 g LMR-NCM (Li1.14(Ni0.26Co0.14Mn0.60)0.86O2) were stirred in 25 ml of the buffer solution at different temperatures (25 °C–90 °C), quantifying the lithium concentration after different washing times (5 min to 24 h) by ICP-OES. The lithium concentration vs washing time at different temperatures is shown in Fig. 2. At 25 °C (green symbol), only ∼14 mM lithium concentration are observed in the washing solution after 24 h. Assuming that the ∼7 mM lithium concentration after washing with purified water at 70 °C for 24 h (see above) are due to lithium containing surface contaminants, an equivalent of only ∼7 mM lithium could be ascribed to the Li+/H+-exchange, which suggests that the Li+/H+-exchange that can be achieved by room temperature washing with the K2HPO4/KH2PO4 buffer over 24 h only allows for %Liexchanged = 0.3 mol%. Thus, it may be concluded that for the LMR-NCM used here, no significant Li+/H+-exchange can be obtained by washing in the K2HPO4/KH2PO4 buffer (pH of ∼7.2) at room temperature.
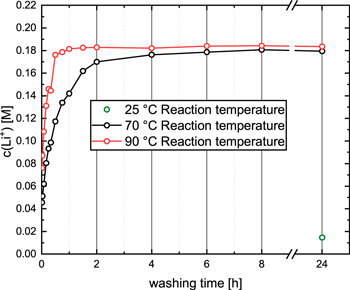
Figure 2. Concentration of dissolved/ion-exchanged lithium in the washing solution (determined by ICP-OES) as a function of washing time (5 min to 24 h) during the washing of 5 g LMR-NCM (Li1.14(Ni0.26Co0.14Mn0.60)0.86O2) in 25 ml of an aqueous solution of a mixture of 0.22 M K2HPO4 and 0.22 M KH2PO4 (pH of ∼7.2) at 25 °C (green symbol), 70 °C (black line/symbols), and 90 °C (red line/symbols). The upper y-axis limit corresponds to the maximum concentration of protons that could be provided upon the complete conversion of H2PO4 - to HPO4 2- (note: 90% conversion would increase the pH increases to ∼8.2).
Download figure:
Standard image High-resolution imageIn the case of washing at elevated temperatures, namely at 70 °C (black line/symbols) or at 90 °C (red line/symbols), however, substantially higher lithium concentrations can be observed even after 5 min (left-most points in Fig. 2). At 70 °C (black line/symbols), the lithium concentration levels off at ∼0.18 M after 8 h, corresponding to a ∼82% conversion of H2PO4 - to HPO4 2-, which should result in an estimated final pH of ∼7.9, in reasonably good agreement with our measured pH value of ∼8.1. The increase in the lithium concentration is faster when washing at 90 °C (red line/symbols), reaching a constant value of also ∼0.18 M after ∼1 h. Since one would expect faster ion-exchange kinetics at the higher temperature, the essentially identical lithium concentrations at 70 and 90 °C suggest that the driving force for the Li+/H+-exchange reaction vanishes at a pH of ∼8.1.
The washing solution at 70 °C after 4 h from the experiment shown in Fig. 2 was also analyzed for the dissolved transition metals to compare their concentration to that of lithium. As seen in Table V, after 4 h washing time at 70 °C, a similar concentration of Li+ is determined in the 0.22/0.22 M K2HPO4/KH2PO4 buffer-washing solution (177 mM) as was determined in the 0.11 H2SO4 washing solution (179 mM, see Table IV). However, as expected for the neutral or slightly alkaline pH of the K2HPO4/KH2PO4 buffer-washing solution, the total concentration of transition metals (∼0.35 mM, see Table V) is now ∼100-fold lower than when washing in 0.11 M H2SO4 (∼35 mM, see Table IV), corresponding to only ∼0.02 mol% of the transition metals in the LMR-NCM material (see Table V). Interestingly, the by far largest concentration is observed for nickel, which suggests that it derives from the dissolution of basic nickel carbonates that have been observed to be the predominant transition metal containing surface contaminants of NCMs. 48,49 Therefore, we can conclude that the LMR-NCM material does not get dissolved in the K2HPO4/KH2PO4 buffer even at elevated temperatures and that only negligible amounts of transition metals will have to be removed from the washing solution. Considering that the maximum contribution of dissolved lithium-containing impurities is equivalent to ∼7 mM (see above), ∼170 mM are contributed by the Li+/H+-exchange, which corresponds to a value of %Liexchanged ≈ 7.5 mol% (corresponding to ∼7.5 mol% of protons in the LMR-NCM material). According to Eq. 4, this would result in a spinel-like surface layer of ∼3.3 nm, i.e., ∼25% lower than the targeted nominal layer thickness of 4.2 nm. Note that in the following (as well as in Table II), we will refer to the various washed LMR-NCM samples by their nominal layer thickness that was calculated based on the Li+/H+-exchange that could be obtained for a complete conversion of KH2PO4 to K2HPO4.
Table V. Leached metals detected in the filtrated washing solution after washing of 5 g LMR-NCM with 25 ml of a 0.22 M solution of K2HPO4 and KH2PO4 (pHstart = 7.2) for 4 h at 70 °C. The metal ion concentrations were measured by ICP-OES. The last column gives the mol of leached metal per mol of LMR-NCM (based on a molecular weight of 88.4 g per mol of Li1.14(Ni0.26Co0.14Mn0.60)0.86O2), whereby the mol% Li are referenced to the total amount of lithium in the material and the mol% for the Σ TM refer to the overall percentage loss of transition metals.
| Leached metals | Measured amount [mg l−1] | Measured amount [mM] | Amount leached from the LMR-NCM [mol%] |
|---|---|---|---|
| lithium | 1223 | 177 | 6.87 |
| nickel | 19 | 0.32 | 0.064 |
| cobalt | 0.43 | 0.007 | 0.003 |
| manganese | 0.86 | 0.016 | 0.001 |
| Σ TM (Ni+Co+Mn) | 20 | 0.35 | 0.02 |
TGA-MS analysis of as-received and washed LMR-NCM
To investigate the effect of washing with a buffer solution, we first examined the LMR-NCM material washed with purified water at 70 °C for 24 h as a reference case, comparing it with materials washed in acid (0.11 M H2SO4) and in the K2HPO4/KH2PO4 buffer (0.22/0.22 M) at 70 °C for 4 h. TGA-MS is used to characterize the temperature-induced surface reconstruction of the washed LMR-NCMs. The second temperature ramp starting at 120 °C was extended all the way to 1125 °C in order to determine the decomposition temperature of the bulk layered structure of the as-received and the washed LMR-NCM materials.
Figure 3 shows the TGA-MS analysis (under Ar at 10 K min−1) of the various LMR-NCM (Li1.14(Ni0.26Co0.14Mn0.60)0.86O2) materials: (i) as-received, referred to as "as-received"; (ii) water-washed at 70 °C (see 2nd row in Table II), referred to as "water-washed"; (iii) washed with 0.11 M H2SO4 at 70 °C (see 1st row in Table II), referred to as "acid-washed"; and, (iv) washed with a K2HPO4/KH2PO4 (0.22/0.22 M) buffer at 70 °C (see 4th row in in Table II), referred to as "4.2 nm buffer-washed." Figure 3a shows the mass loss (right y-axis) and the temperature (red line, left y-axis), while the corresponding 36Ar normalized mass traces of the evolved H2O and O2 are shown in Figs. 3b and 3c, respectively.
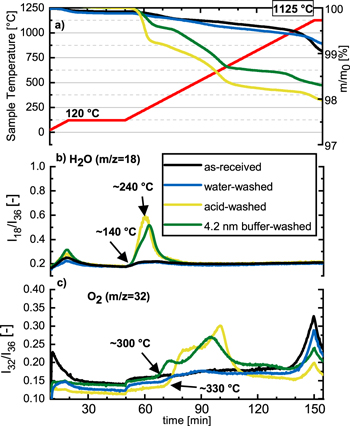
Figure 3. TGA-MS analysis under Ar at 10 K min−1 of LMR-NCMs (Li1.14(Ni0.26Co0.14Mn0.60)0.86O2): (i) as-received (black lines); ii) water-washed at 70 °C for 24 h (blue lines; see 2nd row in Table II); (iii) acid-washed with 0.11 M H2SO4 at 70 °C for 4 h (yellow lines; see 1st row in Table II); and, (iv) washed with a K2HPO4/KH2PO4 (0.22/0.22 M) buffer at 70 °C for 4 h (green lines; see 4th row in Table II). Panel (a) shows the temperature profile (red line, left y-axis) and the relative mass changes of the samples (right y-axis) vs time. The other panels show the 36Ar normalized mass traces of (b) H2O (m z−1 = 18) and of (c) O2 (m z−1 = 32).
Download figure:
Standard image High-resolution imageTowards the end of the first temperature ramp from 25 °C–120 °C, a minor mass loss is seen for every sample, extending somewhat into the first temperature hold phase at 120 °C (Fig. 3a). This mass loss is accompanied by a small and broad mass signal for H2O (Fig. 3b), suggesting that this initial mass loss is due to the removal of adsorbed water from the samples and the porous alumina crucible; as this signal was also visible for a blank measurement without CAM sample, it is not relevant for the following further discussion. As-received (black lines) and water-washed (blue line) LMR-NCMs behave very similarly upon heating, with mass losses of ∼1% up to ∼1000 °C, i.e., up to the onset of bulk oxygen loss that initiates just above 1000 °C.
In stark contrast to the as-received and water-washed LMR-NCM, the acid-washed LMR-NCM shows an additional mass-loss starting at ∼140 °C, which is accompanied by the release of water (yellow line, Fig. 3b). At higher temperatures, starting at ∼330 °C, the release of O2 is visible (yellow line, Fig. 3c). This suggests a two-step thermal decomposition of the acid-washed LMR-NCM, namely one initiating at ∼140°C accompanied by the release of mostly H2O, and one starting at ∼330 °C accompanied by the release of predominantly O2. This gas release pattern is very similar to that observed by Pritzl et al. 40,50 for a washed NCM851005, except that the onset of O2 release for NCM851005 was already observed at ∼250 °C. For the washed NCM851005, the H2O release at ∼140 °C was ascribed to the initial formation of a disordered M3O4-type spinel at the NCM particle surface due to surface reconstruction (Eq. 6), followed by the formation of an MO-type rocksalt surface accompanied by O2 release initiating at ∼250 °C, which is fully formed at ∼300 °C (Eq. 7). 40


While Eq. 6 states that the water release at ∼140 °C should be accompanied by a minor release of oxygen, this is not observed for the washed LMR-NCM examined here nor for washed NCMs. 39,40 Therefore, we now propose a different mechanism, for which the surface layer formed at ∼140 °C would not be an M3O4-type spinel but rather an M2O3-type spinel. In this case, the reaction would only release H2O, consistent with the TGA-MS data:

Upon further heating (∼200 °C–350 °C) M2O3 can then decompose under the release of oxygen to form the O-depleted M3O4-type spinel:

At even higher temperatures, M3O4 in turn can decompose to form an MO-type rocksalt according to Eq. 7 given above. The temperature at which M2O3 and M3O4 are decomposing to a rocksalt-phase is highly susceptible to the Ni-content of the layered oxide material. 51 Based on this, we propose that in the case of the washed and heated nickel-rich NCMs, the M3O4 phase is unstable and directly decomposes to the corresponding rocksalt, while an M3O4 phase for manganese-rich materials like the LMR-NCM used here is more stable and is stable up to ∼330 °C. This is hypothesis is supported by a TGA-MS analysis of an MnOOH reference compound, as described in Fig. A·1 in the Appendix. It is furthermore consistent with the data by Bak et al., who saw a complete rocksalt transformation for a partially delithiated nickel-rich NMC811 at 365 °C, while a low-nickel NMC433 never fully converts into a rocksalt phase in their measurement range up to 600 °C. 51
In summary, the TGA-MS data in Fig. 3 combined with the above described thermal decomposition mechanisms of the proton-exchanged surface phase suggest that the surface of the acid-washed LMR-NCM can reconstruct into an O-depleted surface layer upon heating, first into an M2O3 spinel-type surface layer, starting at ∼140 °C, that is stable up to ∼330 °C (analogous to what was observed for MnOOH in Fig. A·1). Beyond this temperature, the continuous mass loss and the broad O2 mass signal (yellow lines in Figs. 3a and 3b) suggest the gradual and overlapping conversion of the M2O3 spinel-type surface layer into an M3O4 spinel-type and, at least partially, into an MnO rocksalt-type phase. As the latter is expected to result in a high impedance, we have focused us in the later described electrochemical experiments on acid- and buffer-washed LMR-NCM samples that were heat-treated at 300 °C. While acid-washing therefore opens a path to reconstruct the LMR-NCM particle surface to a passivating spinel-like phase, the excessive dissolution of transition metals at the low-pH during acid-washing (see Table IV) is clearly not desired.
The latter, however, can be overcome by washing with aqueous buffers, as was demonstrated for the LMR-NCM material that was washed in the K2HPO4/KH2PO4 buffer (0.22/0.22 M) at 70 °C, where only negligible transition metal dissolution was observed (see Table V). For this reason, we also investigated the 4.2 nm buffer-washed LMR-NCM (see 4th row in Table II) by TGA-MS (Fig. 3, green lines). Upon heating, it shows a very similar mass-loss curve as an acid-washed material, with an identical onset of mass loss accompanied by H2O evolution at ∼140 °C and a slightly earlier oxygen release at ∼300 °C. Therefore, one can conclude that the surface reconstruction mechanism appears to be essentially identical for the buffer-washed and the acid-washed LMR-NCM samples, and that the desired surface reconstruction to a passivating M2O3-like phase occurs between ∼140 °C–300 °C. The obvious advantage of using a K2HPO4/KH2PO4 buffered washing solution is the negligible extent of transition metal dissolution, viz., ∼0.02 mol% (see Table V) compared to ∼1.8 mol% for the acid-washed LMR-NCM (see Table IV).
XPS analysis of as-received and washed LMR-NCM
The characterization of the buffer-washed material by TGA-MS already brought some insight into the Li+/H+-exchange in the near-surface layers and into the surface reconstruction upon heating of a buffer-washed material. In order to provide further proof that the near-surface layer underwent a Li+/H+-exchange during buffer-washing, we performed XPS measurements of the as-received LMR-NCM (Fig. 4a) as well as of the 4.2 nm buffer-washed LMR-NCMs heated to either 300 °C (Fig. 4b) or 450 °C (Fig. 4c). The spectra in the O 1 s region were fitted with peaks assigned to the layered oxide phase (referred to as "layered"), to an O-depleted oxide phase ("O-depleted," representing M3O4-type spinel or MO-type rocksalt phases), and to one peak representing the oxygen signal from hydroxide and carbonate surface contaminants ("M-OH/CO3"); the latter species strongly overlap, so that only one broad peak assigned to both species can be fitted in a meaningful manner (for the applied fitting constraints, see Table III). Figure 4 depicts the XPS data acquired in the O 1 s region of the above samples, illustrating the signal fits for the layered oxide with a peak at 529.2 ± 0.1 eV (green), for the O-depleted oxide phase at 530.0 ± 0.1 eV (orange), and for the peak representing surface hydroxides/carbonates at 531.5 ± 0.2 eV (blue). It has to be noted that no signals for phosphorus were visible in the survey spectra, indicating the quantitative removal of the buffer salts from the samples by the post-washing procedure; consequently, no phosphate features are expected in the O 1 s spectra.
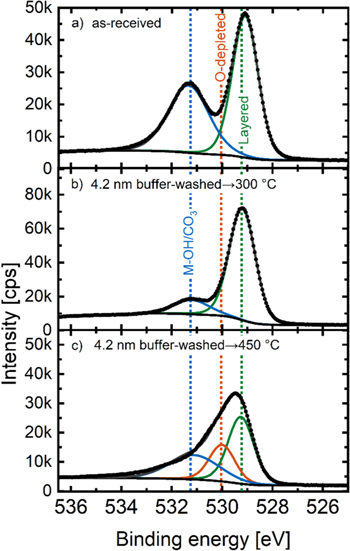
Figure 4. XPS data of the O 1 s region of LMR-NCM samples: (a) as-received, (b) 4.2 nm buffer-washed and heated to 300 °C, and (c) 4.2 nm buffer-washed and heated to 450 °C. All samples were dried at 70 °C prior to the measurement and transferred to the XPS chamber with minimized air exposure. The black symbols are the measured data points; the colored lines represent fits to the various species (see Table III) and the dark grey lines are the sum of all fitted signals.
Download figure:
Standard image High-resolution imageThe as-received LMR-NCM shown in Fig. 4a already has a high amount of hydroxide/carbonate surface contaminants, as seen by the peak at 531.4 eV (blue line), but the most pronounced peak represents the bulk layered oxide at 529.1 eV (green line). The peak height and area of the hydroxide/carbonate surface contaminants relative to the that of the layered oxide feature decreases significantly for the 4.2 nm buffer-washed LMR-NCM that was heat-treated at 300 °C (Fig. 4b). This is simply due to the fact that a large excess of water is used during the buffer-washing (see experimental), largely removing the surface impurities. However, despite the above discussed indications for the formation of an M2O3-type surface layer between ∼140 to ∼300 °C, its presence can apparently not be detected by XPS, suggesting that its O 1 s feature must closely overlap with that of the layered oxide. This assumption is supported by O 1 s spectrum of Mn2O3, which has the same O 1 s binding energy as that of the layered structure (see green line Fig. A·2a in the Appendix). On the other hand, when applying a higher heat-treatment temperature of 450 °C (Fig. 4c), a new feature at 530.1 eV (orange line) appears, which we assign to the O-depleted surface layer that forms at temperatures above ∼300 °C accompanied by the release of oxygen (see Fig. 3), and which we ascribe to an M3O4-type phase. With the appearance of this feature, the signal from the layered oxide phase decreases, as one would expect if the feature that we labelled with "layered" includes signals of both the layered bulk phase (LiMO2) and the M2O3 surface face. Again, this assumption is supported by the O 1 s signal from Mn3O4, which appears at the same binding energy (orange line in Fig. A·2b). A comparison of the O 1 s spectra of Mn3O4 with MnO (see Fig. A·2c) furthermore suggests that the O 1 s spectra do not allow to distinguish between the M3O4 and the MO phase.
For a water-washed nickel-rich NCM851005, a Li+/H+-exchange of the near-surface region was found to result in the formation of a reconstructed O-depleted layer upon subsequent heating. 40 In this case, a short water-washing procedure had been used (two times 20 min at room temperature), yielding an estimated Li+/H+-exchange of only ∼1–3 mol%, which made it difficult to detect it spectroscopically. On the other hand, the above examined 4.2 nm buffer-washed LMR-NCM prepared by heating in the 0.22/0.22 M K2HPO4/KH2PO4 buffer at 70 °C for 4 h contains a high quantity of protons (6.87 mol%, see Table V), which should be sufficiently large to detect the presence of a protonated phase by XPS. Therefore, we conducted an XPS analysis of the 4.2 nm buffer-washed LMR-NCM without heating the Li+/H+-exchanged material beyond the temperature of H2O release (i.e., prior to heating it to ∼140 °C, see Fig. 3), applying a mild drying treatment under dynamic vacuum at only 70 °C. As reference samples we synthesized NiOOH and MnOOH which have similar structures compared to LMR-NCMs, but only contain protons and no lithium in their structure. Figure 5 depicts the O 1 s region of the 4.2 nm buffer-washed LMR-NCM (panel a) together with the reference materials NiOOH (panel b) and MnOOH (panel c), all dried mildly at 70 °C. The solid lines mark the fits for the layered oxide with a peak at 529.2 ± 0.1 eV (green, labelled "layered"), a peak for an oxyhydroxide feature that corresponds to protons in the lithium layer at 530.5 ± 0.1 eV (yellow, labelled "MOOH," see Table III), and the peak representing surface hydroxides/carbonates at 531.5 ± 0.2 eV (blue, labelled "M-OH/CO3"). No signal for the O-depleted layer at 529.8 eV was detected for these samples that had only be dried at mild temperatures of 70 °C.

Figure 5. XPS data of the O 1 s region of a buffer-washed LMR-NCM sample and several reference compounds: (a) 4.2 nm buffer-washed LMR-NCM (in 0.22/0.22 M K2HPO4/KH2PO4 buffer 4 h at 70 °C), (b) as-synthesized MnOOH, and c) as-synthesized NiOOH. All samples were dried at 70 °C under dynamic vacuum for 4 h prior to the measurement and were transferred to the XPS chamber with minimized air exposure. The black symbols are the measured data points; the colored lines represent fits to the various species (see Table III) and the dark grey lines are the sum of all fitted signals.
Download figure:
Standard image High-resolution imageThe 4.2 nm buffer-washed LMR-NCM that was dried only at 70 °C has as its most pronounced feature the peak assigned to the layered oxide at 529.2 eV (green line, Fig. 5a) and a small feature corresponding to hydroxide/carbonate surface impurities at 531.5 eV (blue line). Interestingly, a new feature is visible at ∼530.5 eV (yellow line), which in the literature is assigned to protons in a layered oxide such as NiOOH. 52 To prove that this feature is truly from ion-exchanged protons in the buffer-washed manganese-rich LMR-NCM, we synthesized both MnOOH and NiOOH and analyzed them with XPS. Figure 5b shows the O 1 s region of the as-synthesized MnOOH material (Fig. 5b): in addition to a small feature for hydroxide/carbonate surface impurities at 531.7 eV (blue line, 531.7 eV), the main peak of MOOH in the O 1 s region is at 530.4 eV (yellow line), while no layered oxide feature is visible. Similarly, the most pronounced feature for the as-synthesized NiOOH material is at 530.5 eV (yellow line in Fig. 5c), which can be assigned to the oxygen located next to the proton in the lattice. However, some layered oxide at 529.1 eV is also visible (green line), which could be ascribed to an insufficient protonation on the surface and which had also been reported in the literature for this type of material. 53 In addition, some M-OH/CO3 species (blue line, 531.7 eV) are also present, which is not surprising as the synthesis of NiOOH was done under air from an aqueous solution; here it should be noted that the Ni(OH)2 precursor used in the synthesis also has a pronounced feature at 531.7 eV(data not depicted).
Thus, combining the findings from the TGA-MS experiments with the ones from the XPS characterization, a clear protonation of the (near-)surface layers of the LMR-NCM is visible. Upon heating of the buffer-washed LMR-NCM material, water is lost at ∼140 °C to form an M2O3-spinel-like layer which in turn decomposes above ∼300 °C to form an M3O4 phase which is visible in the O 1 s XPS spectrum of the 4.2 nm buffer-washed LMR-NCM after a heat-treatment at 450 °C. In the following, the effect of the surface reconstruction of the 4.2 nm buffer-washed LMR-NCM into a spinel-like surface layer that is formed upon heating to 300 °C, accompanied by the release of water, will be investigated by OEMS.
On-line electrochemical mass spectrometry (OEMS)
As mentioned earlier, it has been found that during cycling of LMR-NCMs (particularly during the first activation cycle), an O-depleted surface layer is formed on the LMR-NCM particles, accompanied by O2 evolution and a significant evolution of CO2 that is believed to be a product of the released oxygen with the electrolyte. 25,28,54 Teufl et al. furthermore showed that upon extended charge/discharge cycling, the O-depleted surface layer reconstructs into a spinel-like surface layer. 25 Therefore, if it were possible to reconstruct the LMR-NCM particle surface into a passivating spinel-like surface layer prior to its first activation in a cell, using a suitable post-treatment of the as-synthesized LMR-NCM CAM, one would expect a substantial reduction of the LMR-NCM gassing during the first activation cycle and also during subsequent cycles. This would not only alleviate the substantial difficulties encountered during the formation of LMR-NCM cells (the amount of gas evolved during the formation of graphite/LMR-NCM cells is more than doubled compared to that of graphite/NCA cells 17 ), but would also eliminate the formation of electrolyte decomposition products that are formed by the reaction of released lattice oxygen with the electrolyte, which, based on the study by Teufl et al., should improve the full-cell cycling stability. 54
To examine whether the gassing during the first activation cycle can be reduced/eliminated by a buffer-washed and heat-treated LMR-NCM, the 4.2 nm buffer-washed LMR-NCM (see 4th row in in Table II) was heat-treated at 300 °C (under dynamic vacuum, overnight), seeking to reconstruct its surface into a spinel-like M2O3 phase (according to Eq. 8) with a nominal layer thickness of 4.2 nm. On-line electrochemical mass spectrometry (OEMS) shown in Fig. 6 was employed to compare the gassing behavior in the first activation charge of the as-received LMR-NCM (black line) and of the 4.2 nm buffer-washed and heat-treated LMR-NCM (green line). Both the charge profile (Fig. 6a) as well as the O2 and CO2 evolution were analyzed (Figs. 6b and 6c).
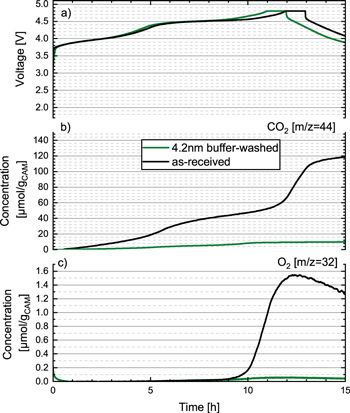
Figure 6. OEMS measurements of the first lithiation cycle to 4.8 V vs Li+/Li followed by a 1 h CV-step of Li/LMR-NCM half-cells with as-received LMR-NCM (black line) and with 4.2 nm buffer-washed and 300 °C heat-treated LMR-NCM (green line). (a) Charge voltage vs time with a charge-rate of C/10 (referenced to 250 mAh g−1 nominal capacity). Evolution of the concentrations of concomitantly evolved gases (in units of μmol/gCAM): (b) O2 and c) CO2. Cells were charged at 25 °C, using a metallic lithium counter electrode, a glassfiber separator, and an FEC-only electrolyte with 1.5 M LiPF6.
Download figure:
Standard image High-resolution imageAs shown in Fig. 6, the charge profile for the 4.2 nm buffer-washed and heat-treated LMR-NCM shows no new features compared to the as-received LMR-NCM; the only difference is that the former has a ∼24 mAh g−1 lower first-charge capacity (∼302 vs ∼278 mAh g−1), which is reasonably consistent with the lithium loss upon washing (acc. to Table V, ∼6.9% lithium were lost when referenced to the lithium in the lithium layer, which would equate to a capacity loss of ∼21 mAh g−1). The gassing of the as-received LMR-NCM (black lines) after the first charge, with ∼120 μmol/gCAM CO2 and ∼1.5 μmol/gCAM O2 is very similar to the values reported for the same LMR-NCM material reported by Teufl et al. 25 (referred to as 0.33 li2MnO3 · 0.67 liMeO2 in that work). Quite striking, however, is the observation that for the 4.2 nm buffer-washed and heat-treated LMR-NCM (green lines) almost no oxygen (<0.1 μmol/gCAM) and more than an order of magnitude less CO2 (<10 μmol/gCAM) are detected after the first charge. This drastic reduction of gassing during the first activation charge provides strong evidence for the above hypothesis that buffer-washing and subsequent heat-treatment of LMR-NCM can lead to a beneficial surface reconstruction of the LMR-NCM particles into a passivating spinel-like surface phase. Its effect on the long-term cycling performance will be examined in the following.
Cycling performance
To investigate if a surface reconstruction into a spinel-like phase on the particle surface not only leads to reduced gassing, but is also beneficial for the capacity retention of graphite/LMR-NCM full-cells, a coin-cell cycling test was conducted at 25 °C. For this, it is crucial to use practically relevant conditions such as a reasonable CAM loading and an FEC-based electrolyte, which is needed for cells with current LMR-NCM materials; 54 therefore, an FEC:DEC (2:8 g:g) electrolyte with 1 M LiPF6 was used (note that the same additive-free electrolyte was also used in the study by Teufl et al. 54 ). Full-cells are also employed to be sensitive to a loss of cyclable lithium due to parasitic side reactions.
Before starting long-term cycling experiments, various temperatures at which the buffer-washed materials were dried were tested. For this Li/LMR-NCM half-cells with buffer-washed materials were built. The first charge and discharge capacities at C/15 as well as the third cycle discharge capacity at C/10) are listed in Table VI.
Table VI. First charge/discharge capacity of Li/LMR-NCM coin-cells (∼2.1 mAh cm−2) at 25 °C, using 80 μl of FEC:DEC (2:8 g:g) with 1 M LiPF6 and a glassfiber separator. The LMR-NCM cathodes are based on either as-received LMR-NCM or on LMR-NCM materials washed in an aqueous K2HPO4/KH2PO4 (0.22/0.22 M) buffer at 70 °C for 4 h to achieve a nominal surface layer spinel thickness of 4.2 nm, then post-washed and heat-treated at 120 °C, 300 °C, and 450 °C (under dynamic vacuum, overnight). The first cycle was carried out at C/15 (CC) between 2.0–4.8 V, followed by 2 cycles at C/10.
| Sample designation | First charge capacity [mAh g−1] | First discharge capacity [mAh g−1] | Third discharge capacity [mAh g−1] |
|---|---|---|---|
| as-received | 303.4 | 262.5 | 255.2 |
| 4.2 nm buffer-washed → 120 °C | 180.1 | 164.9 | 168.2 |
| 4.2 nm buffer-washed → 300 °C | 253.2 | 238.8 | 227.1 |
| 4.2 nm buffer-washed → 450 °C | 237.4 | 222.5 | 205.4 |
The as-received material has an excellent first cycle capacity of 303.4 mAh g−1 on charge and 262.5 mAh g−1 on discharge, equating to a first charge irreversible loss of 42 mAh g−1 (see first row in Table VI). Upon buffer-washing, the LMR-NCM material contains a significant amount of ion-exchanged protons (∼7.5 mol% for the 4.2 nm buffer-washed materials; see discussion related to Table V), which would be expected to affect the extraction and insertion of Li+ from the structure when ion-exchanged protons are not removed from the material prior to charge/discharge cycling. This is the case for the 4.2 nm buffer-washed material heated to only 120 °C (4.2 nm buffer-washed → 120 °C), a temperature that is below the onset of the surface reconstruction into a spinel-like surface layer accompanied by the removal of protons from the LMR-NCM material in form of H2O (see Fig. 3 and Eq. 8). For the such treated LMR-NCM, the first charge and discharge capacities at C/15 are only 180.1 and 164.9 mAh g−1, respectively (see second row in Table VI), suggesting that the presence of ion-exchanged protons in the LMR-NCM substantially impedes lithium (de)intercalation.
On the other hand, for a buffer-washed LMR-NCM with a subsequent heat-treatment at 300 °C, the TGA-MS data (see Fig. 3) suggest that all ion-exchanged protons have been removed from the structure in form of H2O, leading to the suggested formation of an M2O3-type surface layer (see Eq. 8). This material (4.2 nm buffer-washed → 300 °C) indeed has much higher charge/discharge capacities in the first cycle at C/15, namely 253.2/238.8 mAh g−1 (see third row in in Table VI), consistent with the above assumption that ion-exchanged protons impede lithium (de)intercalation. Surprisingly, this value is lower than that obtained in the OEMS experiment (Fig. 6), which we ascribe to the fact that a CV step was used in the OEMS experiment. Finally, heat-treatment of the buffer-washed LMR-NCM to 450 °C is expected to lead to the formation of an M3O4-type surface layer according to Eq. 9, and the now again lower first charge/discharge capacities at C/15 of 237.4/222.5 mAh g−1 for this material (4.2 nm buffer-washed → 450 °C; see last row in Table VI) suggests a higher impedance of the M3O4-type compared to the M2O3-type surface layer. This hypothesis is consistent with the observed higher polarization during charge/discharge that is observed for the buffer-washed LMR-NCM heat-treated at 450 °C (data not shown). The third discharge capacities are following the above described trends of the first charge/discharge capacities, with the highest capacity observed for the buffer-washed LMR-NCM material when heat-treated at 300 °C. Because of these electrochemical data collected in half-cells, the TGA-MS data, and the O 1 s XPS spectra, the buffer-washed material was heated to 300 °C for the full-cell cycling tests described in the following.
Figure 7 shows the full-cell cycling performance of as-received LMR-NCM (black symbols) as well as of K2HPO4/KH2PO4 buffer-washed LMR-NCMs that were subsequently post-washed and heat-treated at 300 °C (under dynamic vacuum, overnight). The buffer-washed and heat-treated LMR-NCMs shown in Fig. 7 were prepared by washing 5 g of LMR-NCM in 25 ml buffer with different K2HPO4/KH2PO4 concentrations, conducted at 70 °C for 4 h: (i) with 0.11/0.11 M K2HPO4/KH2PO4, resulting in a nominal 2.1 nm surface layer thickness (yellow symbols; see 3rd row in in Table II); (ii) with 0.22/0.22 M K2HPO4/KH2PO4, resulting in a nominal 4.2 nm surface layer thickness (green symbols; see 4th row in in Table II); and, (iii) with 0.44/0.44 M K2HPO4/KH2PO4, resulting in a nominal 8.4 nm surface layer thickness (purple symbols; see 5th row in in Table II). All of the LMR-NCMs shown in Fig. 7 were carefully post-washed with purified water after filtration (see Experimental section).

Figure 7. Charge/discharge cycling of graphite/LMR-NCM coin-cells (∼2.4 mAh cm−2/∼2.1 mAh cm−2) at 25 °C, using 80 μl of FEC:DEC (2:8 g:g) with 1 M LiPF6 and a Celgard® 2500 separator. The LMR-NCM cathodes are based on either as-received LMR-NCM or on LMR-NCM materials buffer-washed at 70 °C for 4 h (see Table II), then post-washed and finally heat-treated at 300 °C (under dynamic vacuum, overnight). Activation was carried out at C/15 (CC) between 2.0–4.7 V, followed by a rate test between 2.0–4.6 V (up to 3 C discharge; see Experimental section). Subsequently, a cycling sequence was carried out, starting with 3 cycles at 0.1 C (CC) charge and 0.1 C (CC) discharge followed by 30 cycles at 0.7 C (CCCV) charge and 1 C discharge (CC) between 2.0–4.6 V; this sequence was repeated several times, ending with 3 cycles at 0.1 C (CC) charge and 0.1 C (CC) discharge (note that this cycling procedure is identical with that conducted by Teufl et al. 54 ). The error bars represent the standard deviation values of at least two repeat experiments.
Download figure:
Standard image High-resolution imageThe full-cells with as-received LMR-NCM (Fig. 7, black symbols) show a first discharge capacity of 265 mAh g−1 at C/15, consistent with the data by Teufl et al. 54 with this material (referred to as 0.33 li2MnO3 · 0.67 liMeO2 in that work) in the same electrolyte. In the second 3 C discharge cycle (following a 0.7 C CCCV charge; cycle 12), the capacity drops to 155 mAh g−1. Unfortunately, these cells also show a fast capacity fading, with only 163 mAh g−1 at 1 C after 100 cycles, which corresponds to a capacity retention of only 76% between cycle 18 (i.e., after the initial rate test) and cycle 100. This is comparable to the value obtained in the identically conducted cycling test by Teufl et al. with the same LMR-NCM material and the same electrolyte, where 170 mAh g−1 at 1 C were observed after 100 cycles for the same cycling procedure. 54
Interestingly, the cells with the nominal 2.1 nm buffer-washed LMR-NCM that was heat-treated at 300 °C (Fig. 7, yellow symbols) show a similar initial capacity at C/15 (260 mAh g−1), but vast improvements both in the 3 C discharge capacity (cycle #12) of 210 mAh g−1 and in the capacity retention (90% between cycle 18-100, with 213 mAh g−1 at 1 C after 100 cycles). Considering that the electrolyte contained no additives and that a Celgard® rather than a glass fiber separator was used, this is quite exceptional.
The cells with the nominal 4.2 nm buffer-washed LRM-NCM (Fig. 7, green symbols) have a lower initial capacity of 236 mAh g−1 at C/15 and a very low 3 C discharge capacity (cycle #12) of 105 mAh g−1, while their capacity retention (89% between cycle 18-100, with 213 mAh g−1 at 1 C after 100 cycles) is similarly good. The low 3 C discharge capacity suggests a high impedance of the reconstructed O-depleted M2O3-type surface layer.
Finally, the full-cells with the nominal 8.4 nm buffer-washed LMR-NCM (Fig. 7, purple symbols) have an even lower initial capacity of 216 mAh g−1, as more cyclable Li is leached from the material by the buffer-washing, but their capacity retention, albeit at overall lower capacities, appears very similar (note that this experiment was terminated after 50 cycles due to the overall low capacitance at that point). Surprisingly, however, their 3 C discharge capacity (cycle 12) of 145 mAh g−1 is substantially higher than that of the cells with the 4.2 nm buffer-washed LRM-NCM (105 mAh g−1), despite the nominally 2-fold thicker O-depleted surface layer. This may be due to the fact that the here used heat-treatment temperature of 300 °C is rather close to the temperature at which the reconstructed M2O3-type surface layer transforms into a M3O4-type structure (see Fig. 3), so that the 4.2 nm buffer-washed LMR-NCM material might have already undergone a partial transformation to a more resistive phase, which would still provide good surface passivation but would have a higher impedance. Future work will examine in more detail the effect of the heat-treatment temperature on the rate capability and the cycle-life of buffer-washed LMR-NCM.
In summary, the nominal 2.1 nm thick M2O3-type surface reconstruction is apparently thick enough to stabilize and passivate the surface of the LMR-NCM particles. Teufl et al. showed by estimates based on the amount of gas evolution and by HR-TEM measurements that a ∼2 nm thick spinel surface layer is formed on the surface of an LMR-NCM particle after the first two charge/discharge cycles. 25 In a different study, Teufl et al. also showed that the LMR-NCM cycling performance is drastically improved if the electrolyte in a graphite/LMR-NCM full-cell is exchanged after the first two cycles, 54 which they related to the fact that most of the reconstruction of the LMR-NCM surface that is accompanied by the release of highly reactive lattice oxygen that degrades the electrolyte occurs during the first two cycles, so that an electrolyte replacement after two cycles would improve the long-term cycling performance. As the 1 C discharge capacity of the 2.1 nm buffer-washed LMR-NCM after 100 cycles (213 mAh g−1, see yellow symbols in Fig. 7) is substantially higher than that obtained for the as-received LMR-NCM even with electrolyte replacement after the second cycle (190 mAh g−154 ), one can conclude that the 2.1 nm buffer-washed and 300 °C heat-treated LMR-NCM represents a significantly improved LMR-NCM material.
So far, all the buffer-washed LMR-NCM materials had been post-washed prior to the heat-treatment in order to quantitatively remove the buffer salts. To adapt buffer-washing as an industrial application it would be advantageous avoid the post-washing step, the following experiments investigate whether this would have any detrimental effects. This is shown in Fig. 8 for the 4.2 nm buffer-washed LMR-NCM that was either post-washed (green symbols) or not post-washed (blue symbols) prior to heat-treatment at 300 °C (see third and last row in Table II); the performance of the as-received LMR-NCM (black symbols) is also plotted for reference. Quite clearly, the cells with the LMR-NCM material that was not post-washed after the buffer-washing an prior to the heat-treatment show an overall decrease in capacity compared to that of the cells which contain material that was washed after treatment. Therefore, in the case when a K2HPO4/KH2PO4 buffer is used, the removal of the buffer salts prior to the heat-treatment is required (this is apparently not be the case when using salts like NH4H2PO4). 21 At the same time the recycling of the phosphate-containing filtrate after the buffer-washing process by precipitation with a metal salt (e.g., Ca(OH)2 55,56 ) and its redissolution with sulfuric acid 57 offers a means of recycling the buffer salts.
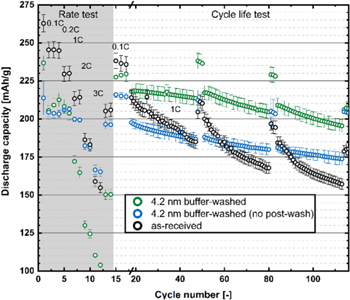
Figure 8. Charge/discharge cycling of graphite/LMR-NCM coin-cells (∼2.4 mAh cm−2/∼2.1 mAh cm−2) at 25 °C, using 80 μl of FEC:DEC (2:8 g:g) with 1 M LiPF6 and a Celgard® 2500 separator. The data for the as-received (black symbols) and the 4.2 nm buffer-washed LMR-NCM (green symbols) cathodes are the same as in Fig. 7. The data labelled as "4.2 nm buffer-washed (no post-wash)" (blue symbols) are full cells with LMR-NCM material that has undergone the same buffer-washing as the 4.2 nm buffer-washed LMR-NCM, except that it was not post-washed after the buffer-washing (see last row in Table II). All LMR-NCMs underwent a final heat-treatment at 300 °C (under dynamic vacuum, overnight). The cycling protocol is the same as that in Fig. 7. The error bars represent the standard deviation values of at least two repeat experiments.
Download figure:
Standard image High-resolution imageConclusions
In this study, we have applied a novel buffer-washing and heat-treatment procedure to reconstruct the surface of a lithium- and manganese-rich NCM (LMR-NCM) cathode active material (CAM) into a passivating spinel-like surface phase, demonstrating that this can result in a modified LMR-NCM material with more than 10-fold reduced initial gassing and with improved cycling performance in graphite/LMR-NCM full-cells. The thickness of the reconstructed surface layer that is formed upon a subsequent heat-treatment of buffer-washed LMR-NCM can be controlled by the amount of protons that can be supplied by the buffer-solution up to a pH of ∼8 and can be estimated by Eqs. 3 and 4. Choosing a buffer-system with a pH of/near 7, the detrimental dissolution of transition metals from the LMR-NCM can be avoided.
This concept was demonstrated using a K2HPO4/KH2PO4 buffer (pH of ∼7.2), for which washing temperatures of ∼70 °C–90 °C are required to drive the Li+/H+-exchange. After buffer-washing, the filtrated LMR-NCM must be washed to remove residual buffer salts. Upon heating of Li+/H+-exchanged LMR-NCM between 140 °C–300 °C, the desired reconstructed spinel-like surface layer is obtained. LMR-NCM materials with a nominal surface layer thickness of 2.1–8.4 nm (acc. to Eq. 4) were prepared.
In particular, we used TGA-MS to investigate the thermal transformation mechanism of the protonated and buffer-washed LMR-NCM, comparing it with the similar mechanism that had been reported in the literature for Ni-rich NCMs. In order to gain further insights into the processes observed during the TGA-MS experiments, the as-received LMR-NCM as well as the buffer-washed material heated to various temperatures were analyzed by XPS and by electrochemical data from Li/LMR-NCM half-cells. This showed the formation of a protonated layer after buffer-washing and the reconstruction of the LMR-NCM particle surface to form an M3O4-type spinel layer upon heating above ∼330 °C.
The OEMS experiment showed that far less gases are released during the activation plateau for buffer-washed LMR-NCM material heated to 300 °C, as a passivating spinel-like surface layer is not formed over the course of charge/discharge cycling, but during the heating step that follows the buffer-washing treatment.
So far, the highest discharge capacities and the best capacity retention was obtained for a buffer-washed LMR-NCM material heat-treated at 300 °C, followed by washing with purified water; this material had a nominal surface layer thickness of 2.1 nm (referred to as "2.1 nm buffer-washed"). Its full-cell (coin cell) capacity and capacity retention is the highest we have seen so far in an FEC:DEC electrolyte without any additives.
Acknowledgments
The authors acknowledge BASF for financial support of this research through the framework of its Scientific Network on Electrochemistry and Batteries. Daniel Pritzl and Ines Hamam are thanked for their tireless motivation and energy to discuss the washing of CAMs.
Appendix
In order to see whether the proposed formation of an M2O3 phase (see Eq. 8) can be observed for a proton-exchanged layered manganese oxide, MnOOH was synthesized and examined by TGA-MS under argon. The mass signal in Fig. A·1a indeed shows a first mass-loss region that initiates at ∼140 °C and levels off at ∼350 °C very close to the theoretical mass-loss of ∼10.2% according to Eq. 8 (marked by the uppermost blue dotted horizontal line in Fig. A·1a, labelled with the number 8). In addition, this transformation is accompanied by the expected essentially sole release of H2O (Fig. A·1b). At higher temperatures, another mass loss regime seems to indicate the gradual transition of the Mn2O3 to the Mn3O4 phase, whereby for a quantitative transformation of MnOOH to Mn3O4 according to the sum of Eqs. 8 and 9, a mass loss of ∼13.3% would be expected (this value is marked by the blue dotted horizontal line labelled with the number 9). The data suggest, however, that the formation of the Mn3O4 phase is overlapping with its decomposition to an MnO phase at higher temperatures (according to Eq. 7), whereby the expected mass loss for the complete transformation of MnOOH to MnO is ∼19.3% (marked by the blue dotted horizontal line labelled with the number 7). Overall, these data support the hypothesis that the proton-exchanged surface of the manganese-rich LMR-NCM transforms to an Mn2O3 phase that is stable up to ∼300 °C.
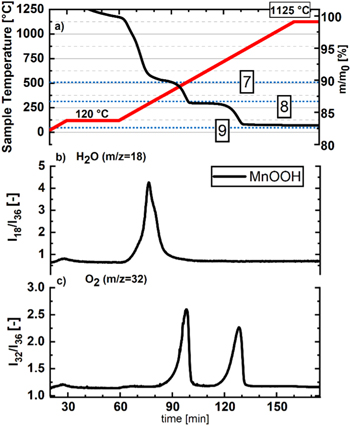
Figure A·1. TGA-MS analysis under Ar at 10 K min−1 of MnOOH (black lines). Panel (a) shows the temperature profile (red line, left y-axis) and the relative mass changes of the samples (right y-axis) vs time. The other panels show the 36Ar normalized mass traces of (b) H2O (m z−1 = 18) and of (c) O2 (m z−1 = 32). The blue dotted horizontal lines mark the expected mass losses for the decomposition of MnOOH to Mn2O3 (labelled with 8), to Mn3O4 (labelled with 9), and to MnO (labelled with 10).
Download figure:
Standard image High-resolution imageFurthermore, we characterized some manganese oxides via XPS to show that a differentiation between a layered oxide and an Mn2O3 phase is not possible by analysis of the O 1 s spectra, as both show the "layered" O 1 s signal at 529.2 eV (green line in Figs. A·2a and in Fig. 4a). At the same time, it is also impossible to separate Mn3O4 from MnO in the O 1 s spectrum of these reference samples (see Figs. A·2b and A·2c).

Figure A·2. XPS data of the O 1 s region of Mn-oxide references: (a) Mn2O3, (b) Mn3O4, and (c) MnO. All samples were dried at 70 °C under vacuum prior to the measurement and transferred to the XPS chamber with minimized air exposure. The black symbols are the measured data points; the colored lines represent fits to the various species (see Table III) and the dark grey lines are the sum of all fitted signals.
Download figure:
Standard image High-resolution image