
Abstract
High voltage cathodes suffer from degradation phenomena that are challenging to be observed and identified during cell operation. Dense and smooth sputtered thin films electrodes with absence of binders and conductive additives allow a direct study of the active material upon Li insertion and extraction at surface and bulk. Using an operando spectroscopic ellipsometry set-up combined with a customized electrochemical-optical cell (EC-SE), the evolution of the optical absorption and thickness of LiMn2O4 and LiNi0.5Mn1.5O4 thin-film electrodes was monitored upon cycling. Mixed Mn3+/4+ valence in the electrodes and evident layer dissolution associated to Transition Metal (TM) dissolution in the non-aqueous electrolyte at the applied polarization potentials was observed. Our results reaffirm EC-SE as a convenient method to study degradation phenomena in cobalt-free transition metal oxide electrodes.
Export citation and abstract BibTeX RIS

This is an open access article distributed under the terms of the Creative Commons Attribution 4.0 License (CC BY, http://creativecommons.org/licenses/by/4.0/), which permits unrestricted reuse of the work in any medium, provided the original work is properly cited.
Lithium-ion batteries have brought many social and technological advances but have also raised a dependence on scarce materials, particularly cobalt. 1 Some alternative high voltage cathodes to the well-established LiCoO2 are based on compounds of lithium, manganese, nickel and oxygen, e.g., LiMn2O4 (LMO) and LiMn1.5Ni0.5O4 (LNMO). The former is attractive because of its relatively high energy density 136.3 W h kg−1, 2,3 high charging rate, low toxicity and abundance of manganese as compared to cobalt. 4 The latter LNMO with higher operation potential (>4.7 V vs Li/Li+) and a specific capacity of ∼135 mA h g−1, 5 exhibits high-rate ability and high energy density (700 W h kg−1) 6 and stands as a promising candidate for future cobalt-free high potential lithium-ion batteries and solid-state batteries (SSBs). However, significant capacity fade, 7,8 structural instability, 9 electrolyte decomposition at high potentials 10 and transition metal (TM) dissolution 10,11 are the main issues hampering the wide use of these electrode materials.
The desire of in-depth understanding of the reaction processes, degradation mechanism and chemical decomposition mechanism under realistic conditions has pushed research towards the development of in situ/operando characterization techniques of battery systems. 12 Nevertheless, an experimental monitoring of this degradation phenomena during charge and discharge of the active material is challenging due to presence of inactive components in composite electrodes. Elucidating phenomena that are solely related to active materials often requires sophisticated facilities such synchrotron-based techniques. 13–15 Thin-film lithium-ion batteries that exclude both electrochemically inactive binder and conducting additives are an excellent model to study cathode active materials. 4
Optical techniques such as spectroscopic ellipsometry (SE) are affordable and non-destructive options, well-known to operate accurately even at sub-monolayer dimensions with multi-layer thin film systems. 16,17 SE is an optical technique where an incident light beam undergoes a change in polarization from linear to elliptical (Fig. 1) as it goes through the measured sample. 18 This change in polarization is characteristic of a specific stack of layers of a certain thickness and optical constants. A model-based analysis approach relying on a fitting procedure allows to extract optical information of a known stack of layers. Using an adapted electrochemical set-up that allows the fast acquisition of the phase (delta, Δ) and magnitude (psi, Ψ) of the reflected polarized light for multiple wavelengths, the measured optical response of Li-ion electrodes can be monitored in situ and operando. In situ ellipsometry was used to monitor the initial stage of passivation layer forming at the interface between LiMn2O4 upon exposure to fluorine-based electrolytes. 16 Recently the convenience of an operando SE-based electrochemical set-up (EC-SE) was demonstrated when tracking the effects of ionic (de)intercalation on the dielectric function (ε) of LMO thin film cathode material in a 3-electrode set-up in an aqueous electrolyte. 19 Herein, EC-SE was shown to be a fast and accurate technique for real-time monitoring of Li+ transport properties and transition metal change of oxidation state effects in the active material's optical properties. Alternatively, the pronounced reversible variation of the optical constants of LMO at different states of lithiation was previously reported using ex situ and in situ Reflectance Spectroscopy. 20 LMO shows a reversible electrochromic behavior that is consistent with the change in band structure upon lithium intercalation and transition metal change of oxidation state in 1.5–4.0 eV, 10,21 which is the typical range observable by spectroscopic ellipsometry equipment (200–1000 nm, 1–6 eV). In the previous operando ellipsometry study, monowavelength acquisition was used and aqueous solutions compatible with working in ambient air.
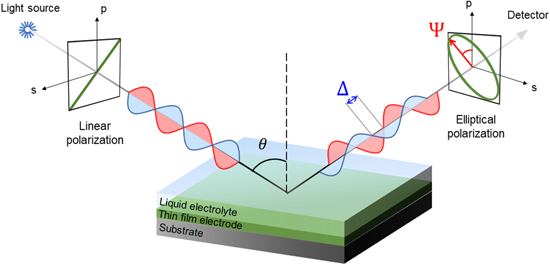
Figure 1. Configuration in spectroscopic ellipsometry for a determined incidence angle (θ, degrees). The changes of amplitude (Ψ, degrees) and phase (Δ, degrees) of the reflected elliptically polarized light are measured by the detector.
Download figure:
Standard image High-resolution imageIn this work, the operando spectroscopic ellipsometry technique is employed using a non-aqueous electrolyte. Applying an advanced multiwavelength ellipsometer with fast acquisition (12 s) of the broadband spectra of the polarization parameters, an accurate tracking of the optical absorption and thickness of thin film electrodes upon Li (de)insertion can be obtained. Results on thin film cobalt-free high voltage cathodes are obtained as a proof of concept of the technique and compared to other reported studies on LMO. The LNMO results bring promising insights into this still-under-development electrode material. An extensive study of the origins of the observed change in the measured polarized reflected signal is hereby introduced, bringing insights on the materials cyclability issues and structural stability.
Experimental
Thin-film LMO and LNMO electrodes were prepared by radio frequency (RF) sputtering in K. J. Lesker Sputtering system at 55 W at pressure of 3 mTorr. Sputtered electrodes were further thermally annealed for crystallization at 700 °C for 1 h and cooled at a rate of 4 °C min−1 in air atmosphere. The active material layers were deposited on 70 nm platinum acting as current collector. A 10 nm TiO2 layer was added between the platinum layer and the SiO2/Si wafer substrate for adhesion purposes. Scanning Electron Microscopy (SEM) was performed on a high-resolution Nova 600 NanoLab using an in-lens BSE detector (TLD-BSE). An electron beam energy of 3 keV was used to capture the images. Atomic Force Microscopy (AFM) was used for studying the surface morphology of the thin films (XE7, Park systems). Roughness values were obtained with XEI, an AFM image processing and analysis program from Park systems. Raman Spectroscopy was performed using a Renishaw Virsa system with 532 nm excitation and VRP20C-532 confocal fiber-optic probe. A 50x objective was used to focus the laser light on sample surface, and the power of the laser was adjusted to 0.4 mW to prevent local reaction on the sample. The electrochemical measurements were conducted using a BioLogic SP-200 transportable potentiostat. The potential window for all electrochemical measurements was kept between 3.5 V and 4.5 V vs Li+/Li for LMO, and between 3.5 V and 4.9 V vs Li+/Li for LNMO electrodes. Operando SE measurements were performed in a customized ellipsometry cell (see supplementary material Fig. S1 (available online at stacks.iop.org/JES/169/040501/mmedia)) designed in collaboration with Redox.me to fit our thin film systems and performed in J. A. Woollam RC2 and M2000 ellipsometers. The customized air-tight cell (Fig. S1) was assembled in an Ar-filled glovebox (Jacomex, O2 < 1 ppm, H2O < 1 ppm) and closed before the electrochemical and optical measurements in ambient air. It works in a 3-electrode configuration, and either with a non-aqueous Ag+/Ag reference electrode (Redox.me) or a piece of Li metal (Sigma Aldrich) as a reference electrode in 1 M LiClO4 in propylene carbonate (PC) electrolyte. This liquid electrolyte fully fills the cell reservoir covering the optical windows. The choice of LiClO4 was motivated to avoid HF formation when traces of water may be present 22 and the formation of weak passivation layers in contact with LiMn2O4, 23 and PC for its low volatility. All potentials are referenced vs Li+/Li also for the cases where Ag+/Ag reference was used (3.8 V vs Li+/Li in 1 M LiClO4 in PC 24 ). The ellipsometer acquisition range is kept within the values of 1.0 eV–4.5 eV, corresponding to the wavelength range of 250 nm–990 nm, assuring low depolarization to avoid high signal-to-noise ratios. The ellipsometer data was collected and fitted using CompleteEASE software.
Results and Discussion
To make a simple yet complete and relevant ellipsometry model, a good identification of the film stack (thickness and composition) as well as an accurate characterization of the surface morphology is required. For that purpose, scanning electron microscope (SEM), atomic force microscope (AFM), Raman spectroscopy and X-ray diffraction (XRD) were carried out on the samples before the electrochemical experiments and are summarized in Fig. 2. The LMO and LNMO films on top of the thin sputtered platinum current collector were dense and polycrystalline with a uniform grain size of 35–60 nm. There is another ∼10 nm TiO2 adhesion layer in-between the Pt layer and the bulk silica substrate, as specified on the SEM images in Figs. 2a, 2b. The morphology of the top layers was verified with AFM in Figs. 2c, 2d. The obtained values of arithmetic roughness averaged over the surface (Ra) and root mean square roughness (Rq) of the deposited films in a 1 μm × 1 μm AFM scan were Ra = 3.8 nm and Rq = 4.9 nm for LMO, and Ra = 3.5 nm, Rq = 4.5 nm for LNMO. The root mean square height of the roughness values were used as initial input for the ellipsometry fitting models on both electrodes. Figures 2e and 2f show Raman spectra measured on LMO and LNMO electrodes, respectively. A strong band around 600 cm−1 and two other weaker features between 400 and 600 cm−1 were identified in Fig. 2e, which are characteristic of vibrations involving oxygen atoms inside the octahedral MnO6 units in the spinel LiMn2O4.
25
The LiNi0.5Mn1.5O4 spectrum in Fig. 2f shows characteristic peaks around 161, 393, 488, 597 and 630 cm−1 corresponding to vibrational modes of Mn–O and Ni–O bonding in the structure. The relative intensity and position of these modes confirms cubic Fd m disordered spinel.
26–28
XRD measurements confirmed the cubic spinel phase and the absence of secondary phases (supplementary figure S2). The well-defined interfaces, low roughness, and uniform chemistry of LMO and LNMO thin film electrode stacks are ideally suited for modelling of the operando SE signals of our EC-SE set-up.
m disordered spinel.
26–28
XRD measurements confirmed the cubic spinel phase and the absence of secondary phases (supplementary figure S2). The well-defined interfaces, low roughness, and uniform chemistry of LMO and LNMO thin film electrode stacks are ideally suited for modelling of the operando SE signals of our EC-SE set-up.

Figure 2. Structural and morphological characterization of sputtered LiMn2O4 and LiNi0.5Mn1.5O4. Tilt and cross section SEM image of (a) LiMn2O4 and (b) LiNi0.5Mn1.5O4 on Pt/TiO2/SiO2/Si substrate. AFM topography image of (c) LiMn2O4 and (d) LiNi0.5Mn1.5O4. Raman spectroscopy on (e) spinel LiMn2O4 and (f) disordered Fd-3m spinel LiNi0.5Mn1.5O4.
Download figure:
Standard image High-resolution imageAs a proof of concept, a 1 cm × 1 cm LMO thin film sample was mounted in the EC-SE set-up and monitored during the electrochemical Li-ion extraction and insertion. The measured raw ellipsometry signals for LMO are summarized in Fig. 3. The electrode was continuously cycled at constant polarization rate of 1 mV s−1 between 2.5 V and 4.5 V vs Li+/Li as shown in Fig. 3a. The cyclic voltammogram trace showing measured current density (j, A cm−2) vs applied potential can be found in Fig. 3b. The change in polarization of the incident beam after going through the LMO sample is quantified by the detector that measures the difference in amplitude ratio (Psi, Ψ) and phase shift (Delta, Δ) of the elliptically polarized reflected wave. Figure 3c shows the measured Ψ and Δ raw signals evolution over time for multiple wavelengths as a response of the applied potential. The symmetry and reversibility of the reflected signal variations correlates with Li-ion insertion and extraction cycles between the applied potential range. To identify the maximum variations in the Ψ and Δ measured signals, the spectra were averaged for all wavelengths, and their derivatives with respect to time are calculated and plotted in Fig. 3d with the measured current density, which is normalized by the geometrical area.

Figure 3. (a) Applied potential during cyclic voltammetry on LiMn2O4, using 1 mV s−1 scan rate and between 2.5 V and- 4.4 V vs Li+/Li. (b) Cyclic voltammogram trace with indicated oxidation (1, 2, 3) and reduction (1', 2', 3') current density peaks. (c) Multiwavelength acquisition (250–990 nm) of Ψ (red) and Δ (blue) ellipsometry signals in response to the applied cyclic voltammetry. (d) Average derivatives of dΨ/dt and dΔ/dt plotted against time. The plots are further compared with the plot of peak current density j (A cm−2) vs time, which is obtained from measurements of cyclic voltammetry. Highlighted in blue the domain corresponding to the 4 V region.
Download figure:
Standard image High-resolution imageTwo regions can be identified in the cyclic voltammogram of Fig. 3b that correspond to different redox events for Mn(IV) and Mn(III). The indicated oxidation and reduction current peaks correspond to the following reactions of LMO:


The oxidation peaks (1) and (2) in the 4 V region appear at 4.12 V and 4.25 V vs Li+/Li, and the oxidation peak (3) in the 3 V region is found at 3.08 V. The peak separation in the 4 V region is related to charge ordering of LixMn2O4 at x = 0.5, during which Li-ions segregate into tetragonal crystal sites. 29 The corresponding cathodic current peaks are observed at 3.9 V and 4.04 V vs Li+/Li in the 4 V region, and at 2.75 V vs Li+/Li in the 3 V region. The redox reaction (3) occurring at low potentials (<3.5 V vs Li+/Li) implies a phase transformation from cubic to tetragonal of the spinel. 30 In practise, LiMn2O4 is generally not discharged to Li2Mn2O4 due to lattice instability, 31 and this 3 V region will be avoided in the following experiments in this study. Figure 3d shows how the ellipsometer signals accurately follow the current density peaks corresponding to the delithiation reactions (1–3) during charge and its analogous lithiation peaks during discharge. This demonstrates the high sensitivity of the technique to detect variations in the spectra between 1.0 eV–4.5 eV when Li+ is extracted and inserted electrochemically from/in the electrode.
The obtained ellipsometry signals (Ψ and Δ) were fitted with a stack model that reproduces the multilayer systems using roughness and thickness values from the morphological characterization. SE is a technique based on a fitting procedure, the model was built by subsequent measurements and fittings of the individual layers. Figure 4 includes a description of the stack model and fitting of the ellipsometry signals measured on a pristine LMO sample inside the EC-SE cell with liquid electrolyte. The geometrical model consists of a dense and smooth layer of thin film electrode on top of completely opaque Pt-coated substrate (Fig. 4a). The optical properties used for fitting the liquid electrolyte and the Pt, TiO2 and SiO2 layers of the substrate are included in section 3 of the Supplementary Material. The LMO electrode optical constants are first fitted using simple B-spline models. The Mean Squared Error (MSE) is used as an estimator to quantify the difference between the fitting model and experiment and is generally employed to assess the goodness-of-fit of the optical models.
18
Figure 4b shows the best match of Ψ and Δ signals (MSE = 3.5) with the B-spline model. Mean square roughness (Rq) values from the morphology characterization described previously were used, and no passivation layer between the electrode and electrolyte was needed in the model to obtain a good fitting of the ellipsometry signals (MSE < 5). This can be explained by the choice of LiClO4-based electrolyte that was demonstrated to form a weaker passivation layer than other fluorine-based electrolytes in contact of LiMn2O4.
23
While the B-spline model guarantees that the fitting will be smooth, it does not guarantee that the optical properties are physical, and it requires many fit parameters. Therefore, the general procedure is to parametrize the optical constants with a simpler analytic expression (based on oscillators) once the shape is determined using the B-spline layer.
32
From the reflected Ψ and Δ signals of the LMO stack at each photon energy, the complex dielectric function ( ) of the electrode layer can be derived for a certain incidence angle θ. Theoretically,
  relates to the complex refractive index (N) to a power of two i.e.,
  and the real
  and imaginary
  part of the dielectric constant are related to the refraction index
  and absorption coefficient
  33
33
 provides new insights not easily obtainable otherwise with
  Notably, the complex dielectric function can be mathematically described by a series of damped harmonic oscillators that model the frequency dependence of the electron excitation through an external electromagnetic field.
18
The features in the spectrum of the imaginary part of the dielectric constant (
Notably, the complex dielectric function can be mathematically described by a series of damped harmonic oscillators that model the frequency dependence of the electron excitation through an external electromagnetic field.
18
The features in the spectrum of the imaginary part of the dielectric constant ( ) fitted via the initial B-spline fitting are identified and reproduced using three parametrized Tauc Lorentz oscillators, as shown in Fig. 4c. The three oscillators are placed at photon energies 1.2 ± 0.2 eV (∼1000 nm), 3.2 ± 0.2 eV (∼390 nm), and 3.5 ± 0.1 eV (∼350 nm). These are in close agreement with the Tauc Lorentz oscillators employed by A. Morata et al.
19
in their ellipsometry study on 80 nm-thick sputtered LMO. Attempts were made to fit the spectra using a fourth oscillator at higher energy (>4 eV), as previously employed by A. Morata et al.
19
but the goodness-of-fitting did not improve substantially. Thus, the simpler model with three oscillators was adopted to avoid over parametrization. The strongest features appearing at around 3.5 eV (350 nm) coincide as well with the experimental observations by Kushida and Kurimaya
34
using transmission spectroscopy, and Joshi et al.
20
using reflectance spectroscopy. All fitting parameters can be found in the section 3 of Supplementary Material.
) fitted via the initial B-spline fitting are identified and reproduced using three parametrized Tauc Lorentz oscillators, as shown in Fig. 4c. The three oscillators are placed at photon energies 1.2 ± 0.2 eV (∼1000 nm), 3.2 ± 0.2 eV (∼390 nm), and 3.5 ± 0.1 eV (∼350 nm). These are in close agreement with the Tauc Lorentz oscillators employed by A. Morata et al.
19
in their ellipsometry study on 80 nm-thick sputtered LMO. Attempts were made to fit the spectra using a fourth oscillator at higher energy (>4 eV), as previously employed by A. Morata et al.
19
but the goodness-of-fitting did not improve substantially. Thus, the simpler model with three oscillators was adopted to avoid over parametrization. The strongest features appearing at around 3.5 eV (350 nm) coincide as well with the experimental observations by Kushida and Kurimaya
34
using transmission spectroscopy, and Joshi et al.
20
using reflectance spectroscopy. All fitting parameters can be found in the section 3 of Supplementary Material.

Figure 4. (a) Stack model of the spinel LiMn2O4 thin film on Pt/TiO2/SiO2/Si substrate. A fixed roughness of 5 nm is initially set as obtained from AFM topography measurements. (b) Corresponding fitting of the measured ellipsometry signals amplitude ratio (Ψ) and phase shift (Δ). Initial fitting with B-spline with low Mean Squared Error (MSE) = 3.5 and modelling using three Tauc-Lorentz oscillators. (c) Modelling of the real (ε1) and imaginary (ε2) part of the dielectric function of LMO using three oscillators. (d) Resulting refractive index (n) and extinction coefficient (k) of the LMO model.
Download figure:
Standard image High-resolution imageUsing this model, the measured ellipsometry signals were fitted during delithiation of LiMn2O4 in the 4 V voltage region (Fig. 5). Figure 5a shows the cyclic voltammogram trace for LiMn2O4 with the characteristic anodic and cathodic current peaks corresponding to the reactions 1 and 2. As Li+ deintercalates from the spinel, the oxidation of Mn3+ to Mn4+ occurs. 35 In Fig. 5b, the evolution of the imaginary part of the dielectric constant (ε2, optical absorption) upon delithiation is shown. An overall shift towards lower energies in the ε2 spectrum is observed. This can be attributed to the change in the Mn3+/4+ oxidation state in LMO during Li-ion extraction. 19,35 Figure 5c illustrates the three absorption bands previously identified in the LiMn2O4 spectrum and fit with Tauc Lorentz oscillators at specific photon energies. Herein, each oscillator is assigned to optical absorption features at different photon energies that correspond to oxidation states of Mn due to interband transitions between the O2−(2p) orbital and Mn3+/4+ (3d) of LMO, described by its degenerate energy bands t2g and eg of the d-orbital. The first oscillator is assigned to the Mn3+/4+(t2g) interband transition at low energies (1.7–2.1 eV), second is Mn4+(eg) around 2.8–3.0 eV and third is Mn3+(eg) at 3.7–4.0 eV, based on previously reported studies. 19,36–38 Interestingly, the coexistence of the two absorption bands attributed to Mn3+ d(eg) and Mn4+ d(eg) of the LiMn2O4 in Fig. 5c indicates the mixed valence state of Mn3+/4+ in the spinel. 35 As delithiation occurs in Fig. 5b, the absorption band around 2.3 eV becomes dominant, suggesting an increase of the density of states of Mn4+ d(eg) orbital which is in line with theoretical simulation results. 35,39,40 Figure 5d includes the deconvolution of the absorption features of the delithiated Mn2O4, where a clear dominance of the band assigned to Mn4+ d(eg) at 2.6 ± 0.1 eV (∼480 nm) can be identified. The dominance of this absorption feature at lower energies causes the change in shape of the ε2 spectrum towards lower energies (Fig. 5b). This trend is consistent with the theoretical studies that report splitting of the Mn-d orbital and stabilization band upon Li deintercalation, 40 and the reflectance spectroscopy results. 20 For easier comparison with the previous experimental studies, refractive index and extinction coefficient spectra vs wavelength is included in Fig. 6. Figures 6a and 6b show the obtained optical constants (n and k, respectively) as a function of the applied potential. With comparable trends upon Li deintercalation, Joshi et al. 20 reported main resonant wavelength of the extinction coefficient of LiMn2O4 at 550 nm, and two resonant wavelengths of delithiated Lix < 1Mn2O4 at 445.5 nm (2.8 eV) and 571.7 nm (2.2 eV). These are comparable to the governing ε2 feature reported in this study at 480 nm (2.6 eV) shown in Fig. 6b. They assigned these features to the transition energies of the O-2p to Mn-eg and O-2p to Mn-t2g respectively. The more reduced thickness used in our layers (90 nm vs 300 nm) may explain some of the disparities found between these studies. With the LMO optical constants from this study, simulated reflectance data was generated using the Simulate Data Feature from J. A. Woollam CompleteEASE software. Figure 6c shows the generated reflectance intensities (%) for different thickness of LMO layer (and unvaried n, k). Interestingly, the simulated reflected intensity at 0 degrees for a 300 nm LMO layer upon delithiation in Fig. 6d was closely matching the experimental trend previously observed in Joshi et al. 20 and reinforces our interpretation of the LMO optical constants.

Figure 5. Monitoring of the optical properties of LiMn2O4 upon Li extraction using operando spectroscopic ellipsometry in the high potential region. (a) Cyclic voltammogram of LiMn2O4 at 1 mV s−1 showing characteristic redox peaks at 4.05 V vs Li+/Li and 4.2 V vs Li+/Li. (b) Evolution of the imaginary part of the dielectric function ε2 during delithiation from LiMn2O4 (blue) to Mn2O4 (red) during the applied cyclic voltammetry. (c) The ε2 spectra of (c) LiMn2O4 and (d) Mn2O4 is deconvoluted and the main features are fit using Tauc Lorenz oscillators. Each oscillator is assigned to the different charge-transfer transitions indicated.
Download figure:
Standard image High-resolution image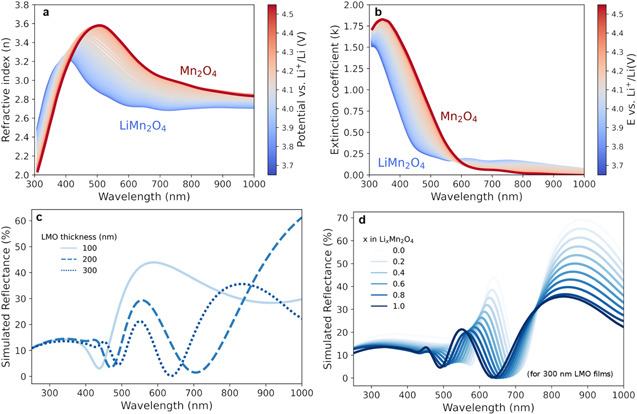
Figure 6. Optical constants of LiMn2O4 layer obtained with the oscillator model adopted in this study as a function of the applied potential. Refractive index (a) and extinction coefficient (b) evolution vs wavelength (nm) and applied potential (E) vs Li+/Li (V). (c) Simulated reflected intensity (%) of the LiMn2O4 for layers of 100, 200 and 300 nm thickness and (d) Simulated reflectance spectra of 300 nm thick LiMn2O4 upon delithiation. Simulations were made for various EMA compositions, where x = 1.0 in LixMn2O4 corresponds to 100% L1: LiMn2O4 and 0% L2 Mn2O4.
Download figure:
Standard image High-resolution imageIntercalation compounds such as LMO and LNMO typically undergo low volume changes in the range of 3–6% upon Li+ (de)intercalation. 29,41 Hence, for thin films of ∼90 nm, the absolute volume changes are minimal (<5 nm). Nonetheless, the high sensitivity of spectroscopic ellipsometry allows to detect changes in the polarization state of the reflected light caused by nanoscale thickness changes in situ even for these thin-film electrodes. For that purpose, it is necessary to deconvolute the variation in the spectra due to changes in optical absorption and thickness. A simultaneous fitting of the changes in thickness and optical constants during the delithiation can be obtained by means of the Effective Medium Approximation (EMA). 42,43 This consists of calculating the electrode top layer optical constants by mixing two or three constituent materials whose optical constants are fixed and the relative composition (i.e., state of charge) of each material in the layer (in %) is fitted over time. From the three main EMA mixing methods (Linear, Bruggeman and Maxwell-Garnet), Bruggeman is adopted for its symmetry with respect to interchanging components of comparable volume fractions. 32 The model includes a layer with the obtained optical constants of LiMn2O4 (L1) and a layer of delithiated Mn2O4 (L2) (>4.0 V vs Li+/Li) with a fixed thickness of L2 = 0 nm (0% EMA of L2, 100% EMA of L1) at the beginning of the delithiation. Figure 7 summarizes the results of the thickness fitting over time during repeated cyclic voltammetry in the range 3.6–4.4 V vs Li+/Li with operando ellipsometry measurements. Figure 7a shows the applied potential and Fig. 7b the measured current density (j, A cm−2), where oxidation and reduction current peaks can be identified for each cycle. The relative composition (EMA) of L1 and L2 over time is shown in Fig 7c. Figure 7d shows the thickness evolution over time. For all cycles, the thickness slightly decreases as the layer is delithiated, assigned to 100% Mn2O4 (L2). This can be attributed to the expected volume changes that the material undergoes during Li-ion extraction. 29 It is also evident that the total layer thickness decreased upon repeated cycling. Interestingly, the stabilized thickness after seven CV cycles is 90.5 ± 1 nm, which is around 8% thinner than the obtained value 98.3 ± 1 nm at t = 0 s and corresponds to an average of ∼1.2% per cycle. The overall decrease of thickness after each cycle could be attributed to transition metal dissolution and loss of coordinated oxygen, which brings the loss of active material and layer dissolution. 44 The MSE values in Fig. 7e remain generally low (<5), except from some slight oscillations at the transition between the completely lithiated LMO (L1) and the delithiated L2. This is due to a limitation of the model to follow up intermediate phases during the delithiation. Note that the EMA-based approach assumes isotropic behaviour during phase transition, 32 thus any effect of, for example, grain boundary transport in LMO during delithiation 45 is not taken into account. This may explain the overshooting of the thickness and fitting error (MSE) in the transition between phases, and it is an intrinsic limitation of this mathematical approach. The model could be extended by introducing more materials to the EMA (e.g., an L3 for an intermediate state of lithiation), however, a more complex fitting would not bring additional understanding beyond the scope of this paper.
Analogously to LMO, delithiation of LNMO was monitored by SE within the potential range (3.5–4.9 V vs Li+/Li) in a non-aqueous environment. Figure 8 includes the optical absorption evolution monitored during delithiation. In views of the structural and chemical similarities between the two spinel materials, a variation of the optical absorption due to Li-ion extraction and simultaneous change in TM oxidation state was expected in LNMO. The delithiation of the spinel in the range 3.5–4.9 V vs Li+/Li occurs in a two-step reaction 46 that can be described as:


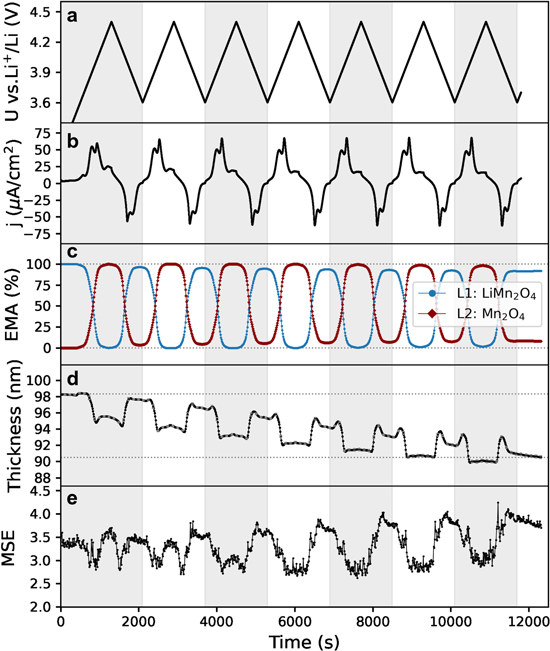
Figure 7. Thickness evolution of LiMn2O4 during repeated cyclic voltammetry within 3.6–4.4 V vs Li+/Li. (a) Plot of applied potential U vs time and (b) current density (μA cm−2) vs time. (c) Effective Medium Approximation (EMA) fitting (%) using double-layer model, being L1 a layer with the optical constants of LiMn2O4 (blue, L1), and L2 in red with optical constants of Mn2O4. (d) Thickness evolution in nm of the EMA layer approximation, horizontal lines indicating fitted thickness at the beginning and end of experiment (d) Mean Squared Error (MSE) evolution of the fitting.
Download figure:
Standard image High-resolution imageIn Fig. 8a the cyclic voltammogram trace shows the two characteristic oxidation (4.68 and 4.75 V) and analogous reduction current peaks corresponding to the solid-state Ni2+/3+ redox couple (Eq. 4) and Ni3+/4+ (Eq. 5), respectively. The variation in oxidation states of the transition metal during delithiation is identified as the main cause for the important variation of the optical absorption of the material shown in Fig. 8b. The spectrum remained almost unchanged for potentials lower than 4.6 V vs Li+/Li, where no electrochemical reaction is expected. The ε2 spectrum increased its intensity overall and shifted to lower energies, stabilizing in a new shape (darker curve) that corresponds to the completely delithiated Ni0.5Mn1.5O4. In Figs. 8c and 8d the reproduction of the optical absorption with Tauc-Lorentz oscillators is shown for LiNi0.5Mn1.5O4 (before delithiation) and Ni0.5Mn1.5O4 spectra. Three absorption bands were identified and assigned to Ni2+, Ni3+ and Ni4+(t2g) interband transition at low energies (1.7–1.9 eV), to Mn4+(eg)-Ni4+(eg) species around 2.3–2.8 eV and to Mn3+(eg)-Ni3+(eg) at 3.0–3.7 eV. 37 The increase of the absorption feature around 2.5 eV of delithiated Ni0.5Mn1.5O4 in Fig 8d was attributed to the increase of the Ni4+(eg) density of states within the photon energy range 1–4 eV as predicted by first-principle calculations. 41 An interesting observation is the evolution of the optical signal at 3.2 eV that indicates the presence of trivalent Ni3+/Mn3+in the lattice of delithiated Ni0.5Mn1.5O4, which was previously observed in LNMO films. 37 The presence of octahedral Ni3+ in the lattice is expected as the LNMO is not fully delithiated at the positive potential limit of the cyclic voltammogram. From the anodic charge under the CV, a state-of-charge (SOC) of 72% is estimated (considering a theoretical capacity of 135 mAh g−1 5 ). The presence of Mn3+ is, on the other hand, not part of the standard redox couple for LNMO as only Ni is supposed to be oxidized and reduced. The formation of Mn3+ impurities is, however, known and linked to the small redox peak around 4 V, which is also present in our voltammogram. 47,48 The reduced Mn3+ impurities are typically a consequence of the loss of oxygen anions from the lattice at the surface due to oxygen evolution at high potentials and/or by the presence of trace amounts of acid in the electrolyte. 49,50 The formation of oxygen vacancies needs to be compensated by a reduction in oxidation state of the transition metal and/or removal (dissolution) of transition metal ions. As our electrolyte solutions were prepared and stored in Ar filled glovebox and an air-tight cell is employed, a minimum of water contamination is ensured. As such, the main source of proton generation in the solutions is attributed to acid generation during electrolyte decomposition at the applied potentials (>4.6 V vs Li+/Li).
The obtained optical properties of the fully lithiated LiNi0.5Mn1.5O4 and delithiated Ni0.5Mn1.5O4 were included into a two-component EMA layer to obtain a deconvolution between thickness and optical absorption changes during electrochemical cycling. Figure 9 summarizes the thickness evolution study when a series of cyclic voltammetry and galvanostatic charge/discharge cycles were applied. Figure 9a includes the time evolution of the potential vs Li+/Li within 3.6–4.9 V vs Li+/Li when a CV, two galvanostatic cycles (GC) and another CV is applied on the EC-SE set-up. In Fig. 9b the current density j (μA cm−2) measured during the CV is plotted vs time, as well as the j applied during the GC. Figure 9c shows the EMA fitting (%) of two components model consisting of a layer with optical constants of fully lithiated LiNi0.5Mn1.5O4 (blue, L1) and second layer with the optical constants at 4.9 V vs Li+/Li identified as Ni0.5Mn1.5O4 (red, L2). At the beginning of each cycle, the L1 layer is 100%, and during the phase transition potential (>4.6 V vs Li+/Li) the component L2 becomes dominant. Figure 9d includes the thickness evolution in nm of the EMA layer. The horizontal dashed lines indicate fitted thickness at the beginning and end of experiment. Figure 9e shows the MSE evolution of the fitting which is an indicative of the quality of the fitting. The mean squared error remains low (MSE < 7) except for the transition between lithiated and delithiated phases that the two-components EMA layer is limited. The thickness of the LNMO layer in Fig. 9d slightly decreases during the potentials at which the layer is completely delithiated, due to the structural volume change that LNMO cubic framework experiences in its delithiated state. 51 Interestingly, the overall fitted thickness decreases from 68.1 ± 1 nm at the beginning of the experiment to 55.3 ± 1 nm. This means an overall decrease of 18.8% of the layer thickness, which results in 5.1% thickness decrease per cycle in average. Regardless of the absolute values, the trend of decreasing thickness is evident and faster than the observed for LMO (1.2%). The more severe layer dissolution of LNMO can be attributed to the polarization to higher positive potentials leading to more electrolyte decomposition and/or O2 evolution. Indeed, the respective acid generation and weakening of TM-bonds due to oxygen loss both increase TM dissolution in transition metal oxides. 44 The picture for LNMO is still incomplete and further refinement of the causes behind loss of active material upon cycling and its consequences is desired. Our set-up provides a suitable tool for further characterization and understanding capacity loss in transition metal oxides.
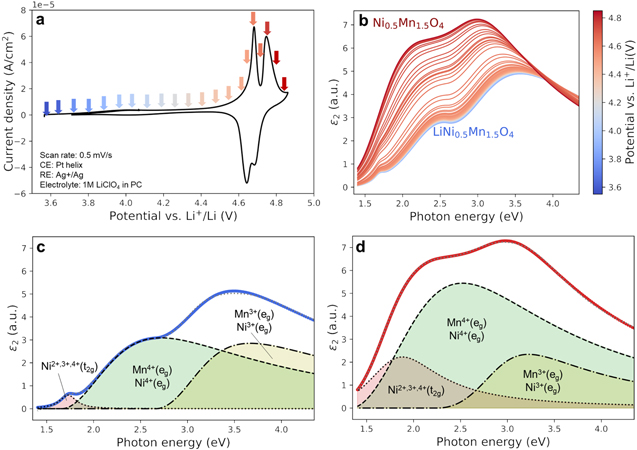
Figure 8. Monitoring of the optical properties of LiNi0.5Mn1.5O4 upon Li extraction using operando spectroscopic ellipsometry. (a) Cyclic voltammogram of a LNMO electrode at 1 mV s−1 showing characteristic redox peaks at 4.68 V (Ni2+/3+) and 4.75 V vs Li+/Li (Ni3+/4+). (b) Fitted imaginary part of the dielectric constant evolution from delithiation of LiNi0.5Mn1.5O4 (blue) to Ni0.5Mn1.5O4 (red) during the cyclic voltammetry. Spectra of (c) LiNi0.5Mn1.5O4 and (d) Ni0.5Mn1.5O4 showing three main features that were fitted with Tauc-Lorentz oscillators and assigned to the indicated states of Mn and Ni species.
Download figure:
Standard image High-resolution image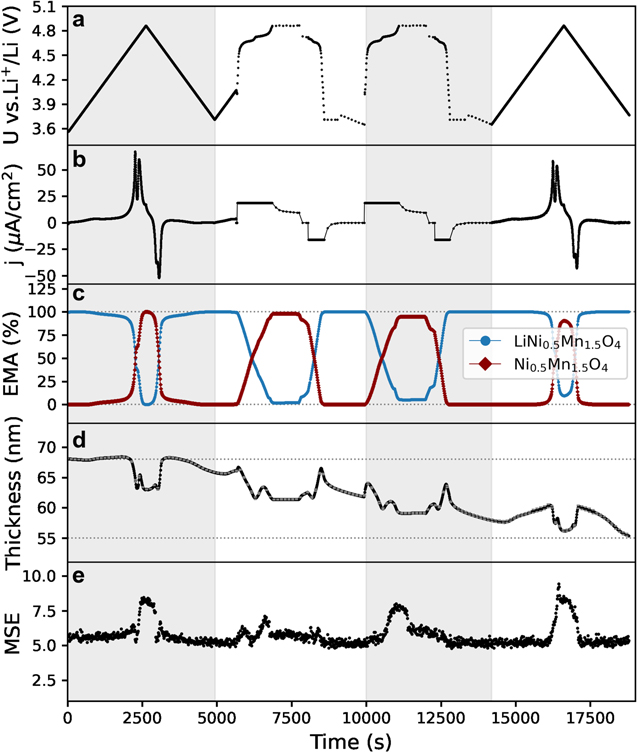
Figure 9. Thickness evolution of LiNi0.5Mn1.5O4 during repeated cyclic voltammetry and galvanostatic cycling within 3.6–4.9 V vs Li+/Li. (a) Plot of potential U vs time and (b) current density j (μA cm−2) vs time. (c) EMA fitting (%) of double layer model consisting of the model with optical constants of fully lithiated LiNi0.5Mn1.5O4 (blue, L1) and second layer with the identified optical constants of Ni0.5Mn1.5O4 (red, L2). (d) Thickness evolution in nm of the EMA layer approximation, horizontal lines indicating fitted thickness at the beginning and end of experiment. (d) Mean Squared Error (MSE) evolution of the fitting.
Download figure:
Standard image High-resolution image
Conclusions
Combining SE in an electrochemical set-up and thin-film electrodes results in a convenient, affordable, and non-destructive approach to study active material in operando conditions. The convenience of the technique lays on the coinciding acquisition ranges (1–5 eV) at which changes in the dielectric constant of the materials due to transition metal oxidation state evolution is expected to occur. The use of multiwavelength fast acquisition allows to obtain a full spectrum of reflected polarized light at very fast rates, obtaining a high sensitivity to applied potentials. Using simple and accurate fitting models based on experimental characterizations, we could successfully monitor changes in the imaginary part of the dielectric function (ε2) of LMO and LNMO electrodes during delithiation. The EMA-based fitting approach with two components relies on relatively small number of parameters and allows to have a quick yet robust estimation of thickness evolution upon cycling with the determined optical constants. The technique shows a great potential in predicting the loss of active material upon cycling that can be associated to transition metal dissolution per cycle. For each charge-discharge cycle, the LMO layers lost 1.2% of its thickness while the LNMO layers decreased 5.1% in presence of the organic electrolyte. A more severe layer dissolution in LNMO is associated to enhanced TM dissolution at high oxidation potentials (>4.6 V vs Li+/Li). Our interpretation of the optical absorption during the delithiation of LNMO films suggests an important presence of Mn3+(eg) and Ni3+(eg) species that may promote transition metal dissolution due to loss of coordinated oxygen, and structural and chemical degradation upon cycling. A more detailed study on the hypothesis made from these observations on LNMO thin films will follow. Our acceptable goodness-of-fitting of the raw ellipsometry signals justified the lack of any protective decomposition layer forming at the interface between the employed LiClO4-based electrolyte and the thin film electrodes. Further characterization using different organic electrolytes or electrode materials can bring understanding of interface phenomena (e.g., interphase layers) with the current set-up. Our results reaffirm the strength of operando EC-SE as an accurate, affordable, and promising way of reporting (de)lithiation effects on transition metal oxide electrodes.
Acknowledgments
M. C. S gratefully acknowledges the support of the PhD fellowship (Grant No. 1SB6619N) from the Research Foundation Flanders (FWO). This project was partly founded by the European Union's Horizon 2020 research and innovation program under grant agreement No. 824072 (HARVESTORE). The authors thank Priya Laha for useful discussions and feedback on the ellipsometry set-up development, and Andrea Pitillas Martinez for her input on LNMO thin film preparation and characterization. The authors acknowledge Kurt J. Lesker Company on the collaboration on thin film deposition in the Mini SPECTROS and Nano 36 glovebox cluster tool.