
Abstract
Understanding the current response at an electrode from suspended solid particles in an electrolyte is crucial for developing materials to be used in semi-solid electrodes for energy storage applications. Here, an analytical model is proposed to predict and understand the current response from non-disintegrable solid particles at a rotating disk electrode. The current is shown to be limited by a combination of ion diffusion within the solid particle and the mean residence time of the particle at the rotating disk electrode. This results in a relationship between current and angular frequency of  instead of the classical
  predicted by Levich theory. Specifically, the current response of Li4Ti5O12 (LTO) microparticles suspended in a non-aqueous electrolyte of lithium hexafluorophosphate (LiPF6) in ethylene carbonate: diethyl carbonate (EC:DEC) was determined experimentally and compared favorably with predictions from the proposed analytical model using fitting parameters consistent with the experimental conditions.
Export citation and abstract BibTeX RIS
The growing need for renewable energy sources has increased demand for scalable, high energy density energy storage systems. One system of interest is the redox flow cell which operates through reduction and oxidation of liquid anolyte and catholyte flowing across a current collector. Redox flow cells are scalable, potentially sustainable, and provide independent sizing of power and energy. 1,2 In an effort to increase energy density, semi-solid electrodes are a subject of significant interest. These electrodes consist of electroactive solid particles suspended in an electrolyte, frequently in the presence of a percolating conductive network. 3–5 There are also studies developing carbon free suspensions to reduce viscosity and increase energy density. 6,7 To characterize these semi-solid electrodes, full flow cells are often constructed to test the material properties. However, this approach can be very labor intensive and requires a significant amount of active material to make proper measurements.
Alternative approaches can provide a more facile method of characterizing these materials under non-static conditions. One such approach is the rotating disk electrode, that utilizes electrochemical characterization of species under convective-diffusive transport conditions. The rotating disk electrode (RDE) is a well-defined electrochemical technique used to characterize the mass transfer kinetics of a dissolved species in solution.
8
The convective flow caused by the RDE with angular velocity  forms a diffusion layer of characteristic thickness
  that, at a large enough overpotential, results in a steady state limiting current from the reduction or oxidation of the species of interest. According to the classical Levich equation
9–11
the limiting current is
that, at a large enough overpotential, results in a steady state limiting current from the reduction or oxidation of the species of interest. According to the classical Levich equation
9–11
the limiting current is

where  is the number of electrons transferred,
  is Faraday's constant,
  is the electrode area,
  is the active species diffusivity in the liquid bulk,
  is the kinematic viscosity,
  [rad/s] is the angular velocity, and
  is the bulk concentration of active species. A previous study predicted that the electrochemical response of nano-sized suspended materials would conform to the Levich theory.
12
However, previous work by Compton's group
13
suggested that diffusion of suspended nanoparticles to the electrode can be hindered by hydrodynamic interactions between the particles and the electrode surface, which produces a deviation from the Levich prediction
is the bulk concentration of active species. A previous study predicted that the electrochemical response of nano-sized suspended materials would conform to the Levich theory.
12
However, previous work by Compton's group
13
suggested that diffusion of suspended nanoparticles to the electrode can be hindered by hydrodynamic interactions between the particles and the electrode surface, which produces a deviation from the Levich prediction  for particles of finite size. Their proposed model
13
assumes that particles dissolve upon impact, which is a common phenomenon during oxidative impact testing of metal nanoparticles.
14–16
for particles of finite size. Their proposed model
13
assumes that particles dissolve upon impact, which is a common phenomenon during oxidative impact testing of metal nanoparticles.
14–16
In previous work, the current is limited by the transport of particles to the electrode and assumes instantaneous and complete reaction of the particle upon impact. However, when the particle reaction is non-instantaneous and the particle concentration is sufficiently high, the current becomes limited by ion diffusion within the solid. 17,18 Once a particle reaches the electrode, it will have a finite amount of time to react and transfer charge before it is removed by the radial flow over the RDE surface, as depicted in Fig. 1a. Therefore, the current from any given particle will be dependent on how long it has been in contact with the RDE. Such an effect due to the local radial flow and particle residence time at the RDE surface is not considered in the Levich equation (Eq. 1). In other words, in the classical Levich theory the charge carrying species (ions or disintegrable particles) are consumed (or dissolved) upon contact with the electrode surface, after which the reacted species is removed from the electrode via diffusion. Therefore, there is no "residence time" as defined in our work herein.
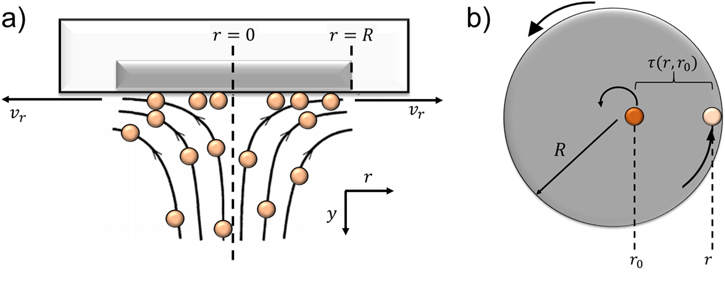
Figure 1. (a) Illustration of the RDE flow configuration with non-disintegrable suspended particles of finite dimension (not to scale). The particles in contact with the electrode have a local radial velocity  imposed by the local flow field. (b) Depiction of the initial contact position,
  for an arbitrary particle at radial position
  The residence time
  is defined as time elapsed when the particle travels from
  to
to  on the surface of an electrode of radius
  The color change of the particle from
  to
to  represents the reaction of the particle during its residence time on the electrode surface.
Download figure:
Standard image High-resolution imageHence, herein is introduced a novel approach to describe the limiting current for the case of suspended solid particles of sufficiently large dimensions. Specifically, from the suspension volume fraction  one can estimate the area coverage fraction
  by assuming a uniform normal flux of particles onto the electrode surface. It is then possible to estimate area fractions consistent with the area coverage values estimated from experimental fits. Thus, in this work, we propose an analytical model for predicting the limiting current at a RDE due to advective mass transfer of suspended particles of finite dimensions and provide experimental evidence in support of the proposed model predictions.
Experimental Methods
Materials characterization
Lithium titanium oxide (Li4Ti5O12, LTO, Sigma Alrich) was used for the studies. Transmission electron microscopy (TEM) was performed on a JEOL JEM-1400 instrument, equipped with a field-emission electron gun operating at 120 kV. Particle size analysis of the TEM images was conducted using ImageJ image analysis software where 267 particles were used for the analysis. Rietveld refinement was executed with the GSAS II software. X-ray diffraction was performed on a Rigaku SmartLab X-ray diffractometer (Cu Kα, λ = 1.5406 Å) in a Bragg−Brentano configuration. Rietveld Refinement was conducted using GSAS-II software. 19 Scanning electron microscope (SEM) images were collected using ZEISS Crossbeam-340 instrument with a secondary electron detector at an accelerating voltage of 3 kV. SEM and TEM images were collected at the Thermomechanical and Imaging Nanoscale Characterization (ThINC) facility at Stony Brook University.
Viscosity measurement
Viscosity of the LTO suspension and electrolyte were measured using a Brookfield DV-II + Pro Viscometer with cone/plate configuration. Viscosity measurements were collected at rotation rates ranging from 1.5 to 100 rpm on the viscometer. Shear rates correspond to  for this configuration. The suspension density was determined by adding the known mass of the suspension to that of the electrolyte and dividing by the known volume.
Electrochemical characterization
Rotating disk electrode (RDE) experiments were performed using a Pine WaveVortex 10 Electrode Rotator in an Argon filled glovebox. Background and suspension measurements were conducted using a three-electrode set up with a Pt RDE (R = 0.25 cm) as the working electrode and lithium foil separated by glass frits as the counter and reference electrodes. LTO particles suspended in 1 M lithium hexafluorophosphate (LiPF6) in ethylene carbonate/diethyl carbonate (3:7 v/v) was used for suspension measurements. Suspension of the particles was maintained solely via rotation of the electrode. For each rotation rate, the suspension was agitated by the electrode for ∼1 h over the course of the experiment. The suspension was agitated for ∼25 min before any CA data was collected. Visually, the suspension appeared homogeneous throughout the entire experiment. When the agitation was paused briefly between rotation rates (∼10 min), there was no observable settling. Electrochemical measurements were collected using a BioLogic VSP potentiostat. Chronoamperometry (CA) measurements were collected from 2.4 V → 1.2 V → 2.4 V vs Li/Li+ for 2 min at each potential step. CA measurements were repeated 5 times at each rotation rate for reproducibility. The Pt electrode was polished with an alumina slurry and rinsed between each rotation rate measurement.
Baseline stationary electrode experiments used the same LTO material as the RDE experiments. Electrodes with composition of 85% LTO, 10% Super P carbon, and 5% polyvinylidene fluoride binder were prepared using conventional methods, where a slurry prepared using N-methyl-2-pyrrolidone solvent was tape cast onto aluminum foil. Stainless steel coin cells were assembled using the LTO electrodes versus lithium metal with 1 M lithium hexafluorophosphate (LiPF6) in ethylene carbonate/diethyl carbonate (3:7 v/v) electrolyte. A voltage window of 2.75–1.0 V was used for cycling. Cyclic voltammetry was conducted at a scan rate of 1.0 mV s−1 while galvanostatic cycling was conducted at a C/10 rate.
Model fitting
Model fitting was done in MATLAB using the curve fitting toolbox.
Results and Discussion
Model development
We consider the case of a RDE of radius  that is immersed in a suspension of non-disintegrable particles that will be modeled as approximately spherical with characteristic radius
  The rotation of the RDE gives rise to a hydrodynamic boundary layer of characteristic thickness
  where
where  is the kinematic viscosity of the fluid. These values were determined experimentally as discussed in the viscosity section. At sufficiently close vertical distances from the electrode surface for which
  the fluid velocity profile is well described by the von Karman and Cochran theory
13,20
for axisymmetric rotating flow and thus we have the flow field components
the fluid velocity profile is well described by the von Karman and Cochran theory
13,20
for axisymmetric rotating flow and thus we have the flow field components 
 and
and ![${v}_{\theta }(r,y)\,\simeq \omega r[1-0.616(y/{\delta }_{H})]$](https://content.cld.iop.org/journals/1945-7111/169/1/010519/revision2/jesac3adeieqn32.gif) in the radial, vertical, and angular direction, respectively. For the case that that the particle radius is much smaller than the boundary layer thickness,
in the radial, vertical, and angular direction, respectively. For the case that that the particle radius is much smaller than the boundary layer thickness,  and the Reynolds number
  is very small, the particles are expected to move with the velocity imposed by the local flow field.
We further consider that for a homogeneous suspension under the stated flow assumptions, the particle flux component in the direction normal to the electrode is independent of the radial coordinate as in the case of Levich theory.
10
 homogeneous particle suspension and the particle flux sustained by the RDE in a sufficiently large domain is thus expected to produce a statistically uniform distribution of particles on the electrode surface. Therefore, the surface available for particles to contact the electrode within a disk of radius
  is
is  where
where  const is the area coverage fraction. We thus define the conditional probability density
  determining the probability that a particle on the electrode surface at radial position
  made initial contact with the electrode at a radial position
  (see Fig. 1b).
Once a particle contacts the electrode at position  the particle velocity is approximately prescribed by the radial flow velocity
  at vertical position
  The residence time
  is defined as the time it takes for the particle on the surface to traverse from its initial point of contact,
  to its current position,
  as illustrated in Fig. 1b. The particle velocity
  determines the residence time

Under the studied conditions we assume that the current from a solid particle is limited by the diffusion of ions through the crystalline structure of the particle. Hence, the diffusion controlled current density can be described by the Cottrell equation 9,21–23

where  is the initial concentration of diffusing ions in the particle and
  is the time since contact. For the studied system, it is assumed that charge diffusion inside the particles takes place over times larger than the residence time determined by the RDE angular velocity. Under this assumption, a particle at radial position
  that contacted the electrode at radial position
  produces the instantaneous current density

that is predicted by introducing the residence from Eqs. 2 into 3.
The average current density produced by all the particles lying at position r can be thus obtained according to  and the RDE current produced over the entire electrode surface is
  where
where  is the area fraction of the electrode covered by particles. Employing the average current density
  expected for a constant area fraction
  we thus arrive to
where  is the contact area fraction, defined as the fraction of the electrode surface area that is in direct contact with the particles, which have a mean contact area
  Under the studied conditions, the area coverage
  and thus the contact fraction
  are independent of the RDE angular velocity
  This is due to the fact that the studied swirling flow
  is incompressible (i.e.,
  ) and the particles are transported with the local flow velocity. Hence, the particle fluxes in and out of an arbitrary volume enclosing the electrode surface balance out for any given angular speed and the total number of particles on the electrode surface is prescribed by the particle concentration in the solution bulk. The covered area fraction
  is thus approximately determined by the solution volume fraction
  and is influenced by the particle size and shape, while the contact area
  is prescribed by the crystallite size, shape, and nanoscale surface structure. Both the area coverage and contact area are difficult to determine accurately for the case of a polydisperse suspension of particles with complex morphologies. In this work we will consider
  as a model parameter that is dependent on the solution concentration and can be adjusted to account quantitatively for experimental observations. It is worth noting that a key prediction from Eq. 5 is the scaling
  which differs significantly from the classical Levich prediction
Experimental Electrochemistry
We experimentally analyze the RDE current for suspensions of microparticles (13.5 wt% and 25 wt%). The particle compound of interest here is LTO, which maintains a relatively constant particle radius (termed zero-strain property) upon electrochemical reduction during its spinel to rock-salt phase transition. 22–27 For viscosity and electrochemical measurements, the LTO particles were suspended in an electrolyte consisting of 1 M LiPF6 dissolved in a mixture of ethylene carbonate (EC) and diethyl carbonate (DEC) (3:7 v/v). LTO does not dissolve in this electrolyte, so the particle integrity is maintained throughout the entire test.
The current due to lithium-ion insertion in LTO is shown to obey the Cottrell equation at short times and is limited by lithium-ion diffusion within the particle. 9,22,23 While other reports have provided alternative descriptions for Li+ diffusion in LTO at longer time domains, the Cottrell approximation is suitable in this case for describing the current density for short reaction times, 23 as assumed in the proposed analytical model (Eqs. 3–5) for the RDE current.
Materials Characterization
LTO characterization
Physical characterization of LTO particles (Fig. 2) was performed with X-ray diffraction (XRD), transmission electron microscopy (TEM), and scanning electron microscopy (SEM) to analyze their size and morphology and determine input parameters for the proposed analytical model. Our XRD analysis was consistent with the LTO phase. Rietveld refinement estimated a crystallite size of 0.41 μm [Table SI and Fig. S1 (available online at stacks.iop.org/JES/169/010519/mmedia)] while use of the Scherrer equation for analysis of the (111) peak indicated a crystallite size of 0.28 μm. TEM [Fig. S2] and SEM images [Fig. 2c] showed the morphology and size distribution of the LTO particles, which exhibit nearly planar polygonal facets. The average radius of the particles measured from the images was  0.26 ± 0.1 μm, which was estimated from the projected area of >250 imaged particles. The edge radius of the particles was determined to be
  = 0.14 ± 0.07 μm [Fig. S3] and adopted as the average contact radius for our analytical predictions, consistent with the crystallite size determined by our XRD analysis.
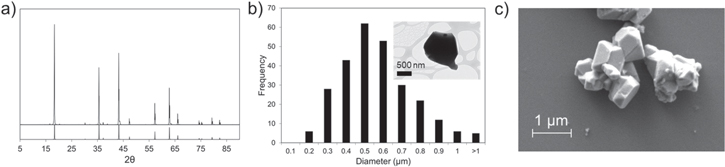
Figure 2. Characterization of the LTO particles employed. (a) XRD compared to theoretical pattern (bottom). (b) Particle size analysis from TEM images (TEM image of representative particle in inset). (c) SEM images of LTO particles.
Download figure:
Standard image High-resolution imageViscosity
Dynamic viscosity measurements performed with a cone/plate viscometer are reported in Fig. 3 for the studied LTO suspensions (13.5 wt% and 25 wt%). Numerical viscosity values are provided in Table S2. The 13.5 wt% suspension showed weak shear thinning at shear rates between 60 and 200 s−1, with viscosities ranging from 10 to 9.31 cP. In the 25 wt% suspension, shear thinning was more significant. Values ranged from 155 cP at 3 s−1 to 34.6 cP at 60 s−1 and followed a logarithmic decay until the upper limit for shear rate of the viscometer. The shear rates generated by the RDE are much larger than the maximum shear rate in our viscosity measurements. For the sake of analytical simplicity, the viscosity measured at the maximum shear rate was adopted as the characteristic suspension viscosity corresponding to the high-shear Newtonian plateau for the studied suspensions. It is worth noting that since  in Eq. 5, substantial variations in the suspension viscosity value have a relatively small effect on the predicted RDE current. Moreover, based on our viscosity measurements, the LTO particles are much smaller than the hydrodynamic boundary layer thickness of
  170 to 420 μm (13.5 wt% suspension) and
  300 to 760 μm (25 wt% suspension) at the experimental rotation rates of 400 to 2500 rpm; which is consistent with the model assumptions in Eq. 5.
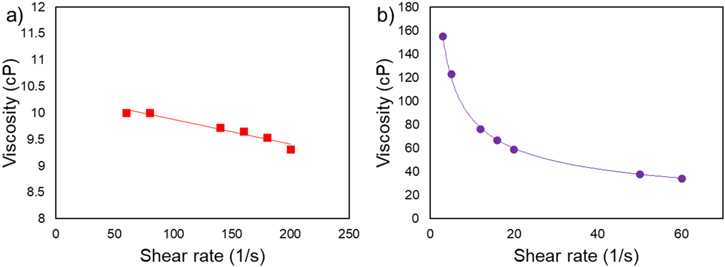
Figure 3. Dynamic viscosity measurements of the LTO suspension (a) 13.5 wt% LTO suspension. (b) 25 wt% suspension.
Download figure:
Standard image High-resolution imageElectrochemical characterization
Baseline electrochemical characterization of the LTO material in a standard stationary electrode configuration was conducted using two-electrode electrochemical cells (Fig. S4). Cyclic voltammetry showed reversible electrochemistry with an E½ of 1.6 V [Fig. S4a]. Galvanostatic cycling showed a functional capacity of 130 mAh/g, consistent with prior reports for LTO 22,28 [Fig. S4b].
Suspensions composed of large weight fractions of particles (13.5 wt% and 25 wt%) in the previously described electrolyte were used to ensure sufficient particle/electrode interactions to measure an appreciable current with the RDE. Suspension of the particles was maintained through convection and mixing produced by the RDE. Electrochemical measurements were made after allowing rotation for ∼25 min to clearly observe particles in the suspension. Measurements were taken at rotation rates of 2500, 2025, 1600, 1225, 900, 625, and 400 rpm.
Chronoamperometry (CA) [Fig. 4] was used to test the electrochemical response of the 13.5 wt% suspension [Fig. 4] and 25 wt% suspension [Fig. S5] at each rotation rate. The potential was stepped from OCV → 2.4 V → 1.2 V → 2.4 V vs Li/Li+ for two minutes at each step—long enough for the current to approach a steady-state. All electrochemical tests were performed on the background electrolyte and the suspension. Figure 4b (dashed lines) shows the CA results for the background. The background currents at the end of each step were ∼2 nA during the first 2.4 V step, ∼0.1 μA during the 1.2 V step, and ∼60 nA in the second 2.4 V step, significantly smaller than the suspension current. Each potential step was accompanied by an initial increase in current that is attributed to the formation and discharge of the electric double layer at the electrode surface.
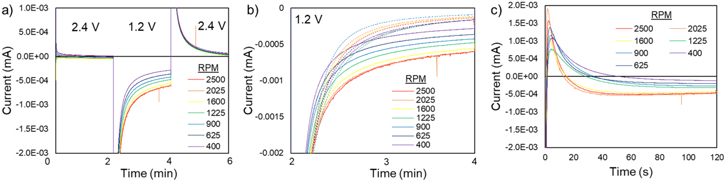
Figure 4. Chronoamperometry results of the 13.5 wt% LTO suspension and background at each rotation rate. (a) showing each potential step. (b) Overlay of the LTO suspension data (solid lines) and electrolyte background (dashed lines) at the 1.2 V potential step. (c) Background subtracted data of the 1.2 V potential step.
Download figure:
Standard image High-resolution imageThe initial OCV of the system for each experiment was between 3.4–3.5 V vs Li/Li+. Once the target rotation rate of the electrode had been reached, the working electrode potential was stepped from OCV → 2.4 V → 1.2 V → 2.4 V for two minutes at each step [Fig. 4a]. In the first 2.4 V step, negligible current was observed as this was above the reduction potential for LTO. At 1.2 V, a large negative current was initially observed, followed by a decay towards steady state. During the second 2.4 V step, an increase in the positive current was observed that decayed to zero by the end of the potential hold. These general characteristics were similar at all rotation rates.
Reduction currents from the suspension were determined by averaging the last 5 seconds of the 1.2 V potential step from the background subtracted CA results [Fig. 4c]. An average current was determined from 5 runs at each rotation rate. The suspension current decayed faster than the background current at the beginning of the 1.2 V step, Fig. 4b. However, once the current had decayed (∼80 seconds), the current of the suspension was higher than the background and were the values used for analysis as they reflected a condition approaching steady state.
Current vs rotation rate
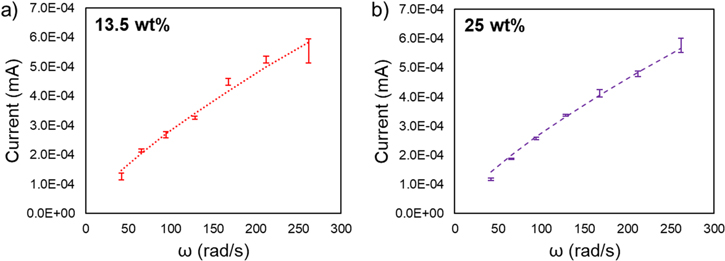
To compare our experimental data and analytical predictions from Eq. 5, we report in Fig. 5 the RDE current  vs. the rotation speed
  for the studied LTO suspension. Notably the experimental data closely follows the relation
  predicted by the proposed analytical model in Eq. 5. Least-square linear fits to log
  vs log
  report slopes of 0.8 (13.5 wt%) and 0.85 (25 wt%). These values further reflect the
  relationship as they are much closer to the model prediction of 0.75 than the Levich prediction of 0.5. The finding that the experimentally measured current scales as
  for a wide frequency range of angular velocities supports that variations of β with the angular velocity are not significant.
Figure 5. RDE current vs rotation speed. (a) 13.5 wt% and (b) 25 wt% LTO suspensions. Experimental data (markers) are reported with error bars representing a 99% confidence interval. Analytical fits via Eq. 5 (dashed lines) are obtained using the model parameters reported in Table I and are in close agreement with the data ( ).
).
Download figure:
Standard image High-resolution image
In order to obtain quantitative agreement, the analytical predictions from Eq. 5 reported in Fig. 5 employ the parameters reported in Table I and the contact area fractions  for the 13.5 wt% suspension and
  for 25 wt% suspensions, which were adjusted to give the closest possible agreement (
 ) with our experimental observations.
Table I. Experimental parameters used for the analytical model predictions.
| Variable | Value |
|---|---|

|

|

|

|

|

|

|
 (13.5 wt%) (13.5 wt%) |
 (25 wt%) (25 wt%) | |

|

|

|

|

|

|
The model parameters employed are summarized in Table I and were determined either experimentally in this work or from reports in the literature. The number of electrons transferred per redox center  is assumed to be 1 electron per Ti(IV). The concentration,
  was assumed to be the concentration of Li+ in LTO and was calculated by dividing the number of Li+ in the LTO unit cell by the unit cell volume, determined via Rietveld Refinement. The diffusion coefficient of Li+ in LTO has been reported over a wide range (1 to 10
  ).
25–27
Here, we adopted the value
).
25–27
Here, we adopted the value  that was determined via electrochemical methods in previous work.
29,30
The kinematic viscosity,
that was determined via electrochemical methods in previous work.
29,30
The kinematic viscosity,  was calculated by measuring the maximum dynamic viscosity of each suspension and dividing that value by the suspension density. The values obtained are similar to values of similar suspensions reported in the literature.
6
The particle radius
was calculated by measuring the maximum dynamic viscosity of each suspension and dividing that value by the suspension density. The values obtained are similar to values of similar suspensions reported in the literature.
6
The particle radius  was determined through TEM analysis of the LTO and the electrode radius,
  is known.
Conclusions
In this work, we have proposed a model to describe the current from non-disintegrable solid particles at a RDE, which varies substantially from the conventional Levich treatment. Current is limited by a combination of particle residence time at the electrode and ion diffusion through the particle. This combination predicts a current vs. angular velocity scaling of  Experimental data was collected using Li4Ti5O12 (LTO) particles suspended in a Li-ion electrolyte and compared to the model. Suspensions composed of 13.5 wt% and 25 wt% LTO produced a RDE current that closely agrees with the analytical predictions when a contact area fraction
  % is used. This contact area fraction would correspond to an area coverage fraction
  /
/ 10.9%–14.4% using the characteristic contact area
  estimated from SEM images. In other words, the studied solutions have volume fractions ϕ = 5% and 10%, based on the LTO density. We can then estimate area fractions α≃13% and 20%, which are consistent with the area coverage values (11% and 15%) estimated from the experimental fits. The estimates inferred from the model parameters yield quantitative agreement with experimental data, where the available information on the particle morphology suggest that only a small fraction of the RDE surface is in direct contact with the suspended particles. This finding supports the model assumption that mainly single particles cover the electrode surface, at least for the lowest solution concentration studied in our work.
The present theoretical and experimental analysis suggests that increases in the RDE current could be obtained by increasing the RDE area contacted by particles, which increases linearly with the area fraction covered by the particles and the characteristic particle contact area. Relevant experimental approaches could include tuning the suspension concentration, modifying the crystallite size, and changing particle morphology. These investigations will be the subject of future studies. The new insights provided in this work could guide the design of optimal materials, and electrochemical and hydrodynamic conditions for flow cells and related systems that exploit the convective transport of suspended solids for energy conversion and storage applications.
Acknowledgments
This research was supported by the Center for Mesoscale Transport Properties, an Energy Frontier Research Center supported by the DOE-BES, under Award #DE-SC0012673. SEM and TEM were collected at ThINC at the Advanced Energy Research and Technology Center at Stony Brook University. C.R.T. acknowledges the support of the National Science Foundation Graduate Research Fellowship under Grant 1839287. Any opinions, findings, and conclusions or recommendations expressed in this material are those of the authors and do not necessarily reflect the views of the National Science Foundation. E.S.T. acknowledges funding from the William and Jane Knapp Chair for Energy and the Environment.