
Abstract
Platinum-group-metal-free (PGM-free) catalysts are currently considered as potential oxygen-reduction-reaction (ORR) catalysts to replace costly and supply-limited platinum at the cathode side of proton exchange membrane fuel cells (PEMFCs). Extensive research efforts have led to substantial progress with regards to the ORR activity of PGM-free ORR catalysts, but there is uncertainty about the dependence of the mass activity on the catalyst loading. In this study, the effect of catalyst loading on the mass activity is investigated by means of rotating disk electrode measurements as well as single cell PEMFC tests using a commercial PGM-free ORR catalyst. Single cell tests with a wide range of loadings (0.4–4.0 mgcat cm−2MEA) are compared to rotating disk electrode measurements with low loadings of 40–600 μgcat cm−2disk. In contrast to indications in the literature that the ORR activity depends on catalyst loading, our results reveal an independence of the ORR mass activity from the catalysts loading in both RDE and PEMFC tests, if corrections for the voltage losses in H2/O2 single cell tests are considered. Moreover, no clear relation of the stability to the catalyst loading was found in H2/O2 PEMFCs.
Export citation and abstract BibTeX RIS

This is an open access article distributed under the terms of the Creative Commons Attribution 4.0 License (CC BY, http://creativecommons.org/licenses/by/4.0/), which permits unrestricted reuse of the work in any medium, provided the original work is properly cited.
Fuel cells play an important role for clean energy generation/conversion based on H2 as an energy vector. However, high cost and low abundance of platinum hinder the commercialization of proton exchange membrane fuel cells (PEMFCs), since the currently used platinum-based catalysts are reported to constitute ≈40% of the total cost of a PEMFC stack at high annual production rate. 1 In order to overcome this obstacle and to significantly reduce PEMFC stack costs, platinum-group-metal-free (PGM-free) catalysts have been widely studied, particularly for the more Pt-demanding oxygen reduction reaction (ORR). Breakthroughs in synthesis 2–4 have considerably improved activity and stability of PGM-free ORR catalysts since their first discovery by Jasinski. 5 Recently, PGM-free catalysts with H2/O2 activities in PEMFCs comparable to carbon-supported Pt (Pt/C) have been reported in the literature. 6–8 Although the first commercial PGM-free-catalyst-based PEMFC was announced in 2017 (as described in Ref. 9), further achievements in activity and stability/durability are required for automotive applications. The generally lower active-site density of inexpensive PGM-free catalysts compared to Pt/C catalysts has to be compensated by higher active-site turnover frequencies or by higher catalyst loadings. Today, state-of-the-art PGM-free electrodes are reported to use mostly a loading of ≈4 mgcat cm−2 MEA (MEA: membrane electrode assembly) in order to achieve the high current densities that are needed for automotive applications according to theoretical projections. 10,11
Already in 2008, Bonakdarpour et al . 12 investigated the effect of the loading for PGM-free catalysts in rotating ring disk electrode (RRDE) measurements in acidic medium. A reduced quantity of hydrogen peroxide detected on the ring electrode with increasing catalyst loading was found. They suggested that thicker electrodes that result from higher catalyst loadings more efficiently convert intermediately formed peroxide species. Ramaswamy and Mukerjee compared the activity of an Fe–N–C catalyst in acidic and alkaline electrolytes. Their findings indeed indicated that diffusion of intermediate peroxide species is facilitated in acidic media, since H2O2 binds less strongly to the active sites compared to deprotonated peroxide species. 13 Later, Muthukrishnan et al. also found a loading effect for an Fe–N–C catalyst, showing an overall four-electron transfer is only observed for loadings higher than 0.2 mgcat cm−2 disk. 14 More recently, our group observed a loading dependency for an Fe-substituted ZrO2 catalyst (Fe0.07Zr0.93O1.97), finding that the mass activity at 0.65 ViR-free roughly doubled when the catalyst loading was increased from 30 to 576 μgcat cm−2 geom. 15 Like in the studies by Bonakdarpour et al. 12 and by Muthukrishnan et al., 14 the effect of catalyst loading on activity/selectivity was observed in RRDE measurements, whereby the mass activity at higher loading compared well with single-cell PEMFC tests. More recently, Teppor et al . 16 reported the same trend of decreasing activity/selectivity with decreasing catalyst loading for Co–N–C catalysts using rotating disk electrode (RDE) measurements, over a catalyst loading range between 0.1 and 1.8 mgcat cm−2 geom.
In summary, independent of whether higher catalyst loadings lead to higher mass activities or not, higher catalyst loadings result in an overall improved kinetic performance, but also lead to thicker catalyst layers. For fuel-cell applications, constraints in the catalyst layer thickness need to be considered, since both mathematical models and experimental works in the literature show that the thickness of the catalyst layer plays an important role in terms of specific current and stability/durability, depending on the operating regime. 8,17–19 PGM-free catalyst layers of ≈4 mgcat cm−2 MEA, mentioned earlier, thereby correspond to a thickness of ≈100 μm, which is approximately ten times thicker than in the case of conventional Pt/C electrodes. 10,20 Such thick electrodes somewhat negatively affect the stack dimensions (≈4 cm additional length for a 400-cell stack), but more importantly, transport resistances that are negligible for the ≈10 μm thick Pt-based catalyst layers are expected to play a more significant role for the ≈100 μm thick PGM-free catalyst layers. Therefore, investigations on the catalyst layer design, in relation to the cell performance and to the reaction mechanism, are important in order to be able to guide a systematic development in the preparative catalyst design. 21
In this study, we investigate the effect of catalyst loading on the ORR mass activity of a commercial Fe–N–C catalyst in both RDE as well as single-cell PEMFC tests. First, the origin of the different voltage-loss terms under H2/O2 operation in PEMFCs is identified in dependence of the catalyst loading. Subsequent corrections for losses originating from ionic and electrical resistances allow for the accurate determination of the ORR mass activity. It turns out that mass activity is not affected over a wide range of loadings in both H2/O2 PEMFC tests (0.4–4.0 mgcat cm−2 MEA) as well as in RDE tests (0.04–0.60 mgcat cm−2 geom). Catalyst layer thickness and loading are critical descriptors of MEAs using PGM-free catalysts and hence activity and stability tests should be carried out considering catalyst loading and voltage losses.
Experimental
Membrane electrode assembly preparation
All fuel cell tests were conducted using 5 cm2 active area MEAs, prepared by decal transfer. For cathode catalyst layers, a Pajarito Powder catalyst, PMF011904 (≈0.5 wt% of Fe) was used, 1 g portion of which was ball-milled prior to ink preparation in a 20 mL ZrO2 milling-vessel with 10 ZrO2 beads of 10 mm diameter (corresponding to 30:1 beads-to-catalyst mass ratio) for 30 min at 200 rpm, using a planetary ball-mill (Pulverisette 7 premium line Fritsch, Germany). PGM-free catalyst inks were prepared by mixing the ball-milled catalyst with a low-equivalent-weight ionomer (700 EW, Asahi Kasei, Japan) dispersed in water and 1-propanol, using a Thinky planetary mixer (500 rpm for 10 min). The ionomer-to-carbon weight ratio (I/C-ratio) was 0.67/1. The inks were coated onto virgin PTFE foil (50 μm thick, APSOparts, Germany) using a Mayer-rod and an automated coater (RK Print Coat Instruments Ltd., UK). To achieve the targeted cathode catalyst loadings of 0.4, 1.0, 2.0, and 4.0 mgcat cm−2 MEA, gap bar coaters (RK PrintCoat Instruments, UK) were used with nominal wet-film thicknesses of ≈70, ≈175, ≈350, and ≈700 μm, respectively. The cathode catalyst coatings were dried at room temperature.
Anode catalyst layers based on a platinum catalyst supported on Vulcan XC72 carbon (20 wt% Pt/C, Tanaka, Japan) were prepared to obtain a loading of 0.1 mgPt cm−2 MEA with an I/C-ratio of 0.65/1 using the same ionomer; ink preparation and coating were done according to our previous study. 22
MEAs with an active area of 5 cm2 were assembled by hot-pressing a 50 μm thick membrane (Nafion 212®, Fuel Cell Store, USA), sandwiched between anode and cathode decals, at 135 °C and 4 kN force for 10 min. While the targeted cathode catalyst loadings were 0.4, 1.0, 2.0, and 4.0 mgcat cm−2 MEA, the precise catalyst loadings were determined by weighing the decals before and after hot-pressing. All tested MEAs had a maximum cathode loading deviation of ±10% from the above given target loadings. This is consistent with the maximum ±10% variation in the catalyst mass normalized cathode capacitances calculated from cyclic voltammograms (see Table I). Two nominally identical MEAs were prepared for each of the cathode catalyst loadings, and the error bars shown in the later figures represent the minimum and maximum values of independent measurements with two MEAs. The thickness of the cathode electrodes was measured at four different points for each MEA using a Mitutoyo dial gauge (accuracy of ±3 μm, series 543); the resulting average thickness and standard deviation for the different MEAs are reported in Table II.
Table I. Specific charge between 0.2−0.75 V (qspec) and specific capacitance at 0.4 V (Cspec), both referenced to the cathode catalyst mass, for the MEAs with the four different PGM-free ORR catalyst loadings (two MEAs per loading).
| nominal catalyst loading [mgcat cm−2 MEA] | qspec [C g−1] | Cspec [F g−1] |
|---|---|---|
| 0.4 | 41 ± 2 | 97 ± 6 |
| 1.0 | 39 ± 0.4 | 97 ± 1 |
| 2.0 | 37 ± 1 | 90 ± 3 |
| 4.0 | 35 ± 2 | 92 ± 5 |
Table II. Thicknesses and electrical resistances of the MEAs with the four different catalyst loadings: cathode catalyst layer thickness (tcathode, using a Mitutoyo dial gauge series 543), electrical in-plane resistivity of the cathode catalyst layer ( determined from in-plane four-point-probe acc. to Eq. 1), and estimated electrical through-plane resistance (
 acc. to Eq. 2).
| nominal catalyst loading [mgcat cm−2 MEA] | actual catalyst loading for two MEAs [mgcat cm−2 MEA] | tcathode [μm] |
 [Ω cm] [Ω cm] |
 [mΩ cm2] [mΩ cm2] |
|---|---|---|---|---|
| 0.4 | 0.40 ∣ 0.33 | n.a. | n.a. | n.a. |
| 1.0 | 0.90 ∣ 0.84 | 27 ∣ 24 | 2.2 ∣ 2.4 | 5.9 ∣ 5.7 |
| 2.0 | 2.02 ∣ 2.03 | 59 ∣ 63 | 2.7 ∣ 2.9 | 15.9 ∣ 18.3 |
| 4.0 | 3.60 ∣ 3.70 | 121 ∣ 141 | 2.8 ∣ 4.5 | 33.4 ∣ 63.4 |
Cathode catalyst layer electrical resistance
Ex situ analysis of the electrical resistance of the cathode catalyst layers was conducted using a four-point probe that was placed onto the cathode catalyst layer of the MEA at room temperature and at ambient relative humidity (≈45% RH). These measurements were conducted by applying the current through the two outer pins and measuring the voltage between the two inner pins of the probe head. The in-plane resistivity of the cathode catalyst layer ( ) was calculated for each MEA according to Eq. 1:
23
) was calculated for each MEA according to Eq. 1:
23

Here, t is the measured cathode electrode thickness, U is the measured voltage, I is the applied current, and W/L is a geometrical factor derived from the ratio between the width of the tested sample (≈2.24 cm) and the spacing between the two inner pins (1 mm), yielding W/L = 4.53. Under the reasonable assumption that the electrical resistance of the cathode catalyst layer is isotropic, i.e., that in-plane and through-plane resistivity are identical, the through-plane areal resistance ( ) for each cathode catalyst loading was calculated according to the following equation:

Here, the calculated through-plane electrical resistance  is expressed in units of mΩ cm2, so that it can later be used for the correction of the voltage loss originating from the electrical resistivity of the cathode catalyst layer.
Single-cell PEMFC assembly and testing
Electrochemical measurements in 5 cm2 single-cell PEMFCs were performed using an in-house manufactured cell hardware and commercial graphite flow fields with 7 channels and a single serpentine (0.5/0.5 mm land/channel widths; manufactured by Poco Graphite, USA). 24 Gas diffusion layers (GDLs) were supplied by Freudenberg (H14C10, Germany), and the GDL compression was adjusted by setting the GDL strain to 20.0 ± 1.0% by adjusting the thickness of the nearly incompressible PTFE-coated fiberglass gaskets (compressing by 7% at the applied force), assembled at a torque of 12 Nm. Fuel cell tests were performed on automated test stations (G60, Greenlight Innovation, Canada) equipped with a load-bank and an additional potentiostat (Reference3000, Gamry, USA) to conduct electrochemical impedance spectroscopy (EIS) as well as cyclic voltammetry (CV).
MEAs with platinum-based cathode catalysts are generally subjected to a several hours long conditioning procedure under H2/air. 25 However, since PGM-free catalysts are reported to exhibit significant degradation within the first hours of operation, 8,17 no MEA conditioning was performed in the present study. The mass activity of the PGM-free catalysts was determined from H2/O2 polarization curves at an absolute pressure of 170 kPaabs (set at the cell inlet), a relative humidity 90%, and at Tcell = 80 °C, using differential flow conditions (2000 nccm and 5000 nccm on anode and cathode, respectively; nccm is defined at standard conditions of 273.15 K and 101.3 kPa). Polarization curves were recorded in galvanostatic mode, holding each current point for 5 min and recording the averaged cell potential over the last 30 s; the polarization curves were recorded starting from open circuit voltage (OCV) and progressing to higher current densities. After each current measurement point, the high frequency resistance (HFR) was determined by electrochemical impedance spectroscopy (EIS) with 10% current perturbation (in the frequency range of 1–100 kHz with 10 points per decade).
After recording a first H2/O2 polarization curve, cyclic voltammograms (CVs) were recorded at Tcell = 40 °C and at ambient pressure, with fully-humidified 5% H2 in N2 supplied to the anode (at 200 nccm) and dry N2 supplied to the cathode (at 50 nccm). Three different scan rates were used (50, 100 and 150 mV s−1), recording three cycles for each scan rate.
After recording the CVs, a second H2/O2 polarization curve was recorded to investigate if the preceding tests may have already degraded the catalyst. This is followed by an impedance analysis under blocking conditions to determine the cathode electrode proton conduction resistance: following the procedure introduced by Liu et al ., 26 EIS was conducted at 0.2 V (acquired between 500 kHz and 0.2 Hz, with a voltage amplitude of 3.5 mV) with H2 on the anode and N2 on the cathode side (1000 nccm each) at Tcell = 80 °C, at 90% relative humidity, and at 170 kPaabs. After these measurements, three more consecutive H2/O2 polarization curves were recorded in the same way as described above.
Rotating disk electrode (RDE) measurements
RDE measurements were performed in 0.1 M HClO4 (Kanto Chemical Co.,Inc., Japan) at 25 °C, using a glassy-carbon disk working electrode (Pine, USA, A = 0.196 cm2) coated with the catalyst. A rotating ring disk electrode shaft (Pine, USA) with a Pt-ring was employed, whereby the ring electrode was used to calibrate the static reversible hydrogen electrode (RHE) that was used as reference electrode prior and after the actual RDE experiments: by conducting hydrogen oxidation/evolution scans on the Pt ring electrode (at 400 rpm) while bubbling pure H2 through the electrolyte, the precise value for 0 V vs RHE was determined from the transition potential between oxidation and reduction currents; this was used to determine the offset of the static RHE reference electrode from 0 V vs RHE (typically less than 2 mV). The static RHE reference electrode consisted of a Pt wire immersed in H2-saturated 0.1 M HClO4 (Kanto Chemical Co., Inc., Japan); 27 a gold wire was used as counter electrode.
The catalyst inks for RDE experiments were prepared by dispersing a commercial PGM-free ORR catalyst from Pajarito Powder (PMF11904, USA) in dimethylformamide (anhydrous, 99.8%, Sigma-Aldrich, Germany) and bath sonicating the dispersion for 30 min, followed by the addition of a defined amount of a 5 wt% Nafion® ionomer solution (Sigma-Aldrich, Germany) and another bath sonication for 5 min. The ionomer/catalyst ratio was chosen to be 0.44 g g−1 and the concentration of the catalyst ink was chosen such that upon deposition of 10 μL of ink onto the glassy carbon disk, the desired catalyst loadings were obtained (ranging from 40–600 μgcat cm−2 geo).
Rotating disk measurements were carried out at 25 °C in O2-saturated HClO4, using an Autolab potentiostat (Metrohm, Switzerland) in a potential window of 0.05–1.1 VRHE, a scan rate of 5 mV s−1, and at 1600 rpm. The ORR data were recorded during the 3rd positive-going scan. Impedance spectroscopy was measured to determine the non-compensated high frequency resistance (HFR) between the working and the reference electrode. All RDE data were i) iR-corrected using the determined HFR and ii) corrected by the capacitive currents determined in the absence of O2 (i.e., under Ar); as the commonly used oxygen mass transport correction is not valid for these thick catalyst films, 28 the RDE data are shown only for current densities of ≤0.6 mA cm−2, which is ≤20% of the diffusion-limited current density for a 2-electron reduction process, so that oxygen concentration gradients within the electrolyte boundary layer and within the electrode can be considered negligible.
Results and Discussion
MEA loading validation via cyclic voltammetry
Prior to the measurements, the cell was not subjected to any H2/air conditioning that is conventionally used for MEAs with Pt-based ORR catalysts, in order to avoid any possible catalyst degradation. In the case of PGM-free ORR catalysts, conditioning with air on the cathode might likely result in hydrogen peroxide production in the catalyst layer; this in turn is hypothesized to constitute a major catalyst degradation pathway via hydroxyl radicals that are produced in a Fenton reaction. 8 Since this study focuses on the loading impact of a PGM-free catalyst on the ORR mass activity and the H2/O2 performance, the confirmation of the catalyst loading is essential and was achieved via an analysis of the mass normalized currents obtained by cyclic voltammetry, which are not compromised by any possible mass transport resistances in the thick catalyst layers.
Hence, CVs were recorded and normalized by the mass of the catalyst in the cathode electrode, whereby the reasonably good areal overlap of the mass-normalized CVs indicates that the nominal cathode catalyst loadings are in good agreement with the actual catalyst loadings (Fig. 1). This can be examined more quantitatively by comparing the catalyst mass-normalized or specific charge (qspec) between 0.2 V to 0.75 V (marked by the gray shaded region in Fig. 1) and the specific capacitance (Cspec) at 0.4 V (marked by the dashed line in Fig. 1). The average values for qspec and Cspec are 38 C g−1 cat and 95.5 F g−1 cat, respectively, and differ by only ±7% across all MEAs (Table I).
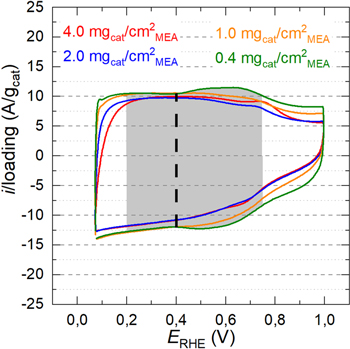
Figure 1. Mass-normalized capacitive currents (in A/gcat) obtained from cyclic voltammograms of the PGM-free cathode catalyst in an MEA recorded in the voltage window of 0.07–1.00 V at a scan rate of 150 mV s−1. CVs were recorded at ambient pressure and Tcell = 40 °C, using a fully-humidified 5% H2 in N2 feed at the anode and dry N2 feed at the cathode. The gray shaded area was integrated to determine the mass-normalized charge between 0.2 and 0.75 V vs RHE, and the dashed vertical line indicates the potential at which the mass-normalized capacitance was determined.
Download figure:
Standard image High-resolution imageBy further inspection of the CVs with the 0.4 and 1.0 mgcat cm−2 MEA loadings, a slight current increase is observed at ≈0.6 V, which in the literature is usually assigned to a quinone/hydroquinone redox couple. 29 Another redox couple is evident at ≈0.8 V for the higher MEA loadings (2.0 and 4.0 mgcat cm−2 MEA) and can be assigned to a Fe3+/Fe2+ redox couple (at 0.77 V according to the Fe Pourbaix diagram 30 ) that is typical for non-heme Fe–N4 moieties of Fe–N–C catalysts, exactly as reported in Ref. 31, meaning a moiety different from those in biological heme groups. These slight differences in the shape of the CVs between low- and high-loaded electrodes could derive from a difference in degradation between low and high loadings during the electrochemical tests preceding the CVs (see the section entitled "Stability of the catalyst during sequential H2 /O2 polarization curves"), which could cause a slight increase in capacitance and the little changes observed in the CV profiles.
Oxygen polarization curves and HFR
For all four loadings, the oxygen mass activity of the PGM-free cathode catalyst was determined from the first recorded H2/O2 polarization curve (referred to as initial in the subsequent figures). For MEA loadings from 0.4 mgcat cm−2 MEA to 2.0 mgcat cm−2 MEA, the H2/O2 performance increases substantially (Fig. 2a), as one would expect. However, no significant gain in H2/O2 performance at high current densities is observed anymore between 2.0 mgcat cm−2 MEA and 4.0 mgcat cm−2 MEA, suggesting a substantial decrease in catalyst utilization for the thick high-loaded MEAs. A similar behavior was observed by Banham et al ., 8 who showed a significant gain in the high-current density H2/O2 performance for their MEAs with an Fe–N–C ORR catalyst when increasing the loading from 1.0 mgcat cm−2 MEA to 2.5 mgcat cm−2 MEA, but no further gain when increasing the loading from 2.5 mgcat cm−2 MEA to 4.0 mgcat cm−2 MEA. These authors had concluded that it would be necessary to optimize the porosity of the electrodes as well as the ionomer content in the cathode catalyst layer to further improve the high-current density H2/O2 performance for the MEAs with the high cathode catalyst loading of 4.0 mgcat cm−2 MEA. With regards to the evaluation of the ORR mass activity that is determined in the low current density region under O2, the transport resistances should be sufficiently small to still allow for its quantification.
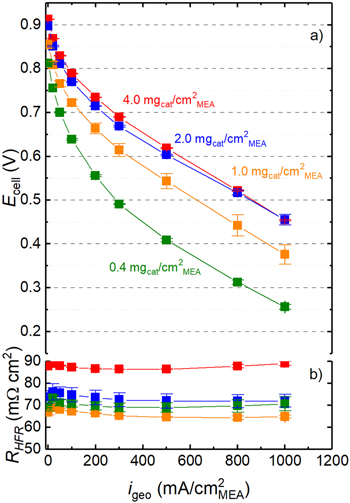
Figure 2. (a) Initial H2/O2 polarization curves, showing the cell voltage (Ecell) vs the geometric current density (igeo) recorded at 170 kPaabs, Tcell = 80 °C, and 90% relative humidity under differential flow conditions (2000/5000 nccm on anode/cathode) for four different loadings of the PGM-free ORR catalyst. (b) HFR values for all the loadings determined via EIS for each current density point. Error bars in both (a) and (b) represent the mean absolute deviation of two independently measured MEAs.
Download figure:
Standard image High-resolution imageFor a typical PEMFC with Pt/C catalyst based MEAs, the high frequency resistance (HFR) represents the sum of the membrane proton conduction resistance ( ) and the electrical contact resistance between the GDL and the flow field (
 ). However, here we observe an increase of the HFR when increasing the cathode catalyst loading from 1.0 to 4.0 mgcat cm−2
MEA (i.e., from ca. 70 to ca. 90 mΩ cm2; see Fig. 2b), and no significant HFR difference between 0.4 and 1.0 mgcat cm−2
MEA (i.e., ca. 70 mΩ cm2). For the used membrane (Nafion® 212), the expected resistance under the described operating conditions of 80 °C and 90% RH is
). However, here we observe an increase of the HFR when increasing the cathode catalyst loading from 1.0 to 4.0 mgcat cm−2
MEA (i.e., from ca. 70 to ca. 90 mΩ cm2; see Fig. 2b), and no significant HFR difference between 0.4 and 1.0 mgcat cm−2
MEA (i.e., ca. 70 mΩ cm2). For the used membrane (Nafion® 212), the expected resistance under the described operating conditions of 80 °C and 90% RH is  ≈50 mΩ cm2,
32
while the contact resistance between the gas diffusion layers and the flow fields (
≈50 mΩ cm2,
32
while the contact resistance between the gas diffusion layers and the flow fields ( ) was measured by a previously described method,
33
yielding a value of ≈10 mΩ cm2 for 20% GDL compression. This would add up to an estimated HFR of ≈60 mΩ cm2, which means that the PGM-free catalyst based MEAs in this study show a higher than expected HFR value, particularly for the thick high-loaded electrodes. A similar HFR increase with increasing cathode catalyst loading was observed by Baricci et al.
18
. One reasonable explanation for this behavior could be the higher electrical resistance of the rather thick catalyst layers based on PGM-free catalysts compared to the conventional, only ≈10 μm thick Pt/C electrodes, for which the through-plane electrical resistance is negligible and generally ignored.
34
In fact, in one of the previous studies of our group (Landesfeind et al.
35
), an increase in HFR was reported for cases where the electrical resistance across a porous electrode becomes significant compared to the ionic resistance. In this case, the determination of the ionic resistance from the Nyquist plot obtained under blocking conditions is less straightforward. This will be discussed in more detail in the following section.
) was measured by a previously described method,
33
yielding a value of ≈10 mΩ cm2 for 20% GDL compression. This would add up to an estimated HFR of ≈60 mΩ cm2, which means that the PGM-free catalyst based MEAs in this study show a higher than expected HFR value, particularly for the thick high-loaded electrodes. A similar HFR increase with increasing cathode catalyst loading was observed by Baricci et al.
18
. One reasonable explanation for this behavior could be the higher electrical resistance of the rather thick catalyst layers based on PGM-free catalysts compared to the conventional, only ≈10 μm thick Pt/C electrodes, for which the through-plane electrical resistance is negligible and generally ignored.
34
In fact, in one of the previous studies of our group (Landesfeind et al.
35
), an increase in HFR was reported for cases where the electrical resistance across a porous electrode becomes significant compared to the ionic resistance. In this case, the determination of the ionic resistance from the Nyquist plot obtained under blocking conditions is less straightforward. This will be discussed in more detail in the following section.
To further confirm the impact of the electrical resistance of the electrode, four-point-probe in-plane electrical conductivity measurements were conducted, which, in combination with the measured cathode electrode thickness (tcathode; see 2nd column in Table II) and Eq. 1, yields the electrical in-plane resistivity of the cathode catalyst layer ( see 3rd column in Table II). As shown in Table II, the cathode catalyst layer thickness is roughly proportional to the cathode catalyst loading of the MEA, whereby owing to the error in the thickness measurement (ca. ±3 μm), no sufficiently accurate thickness values could be obtained for the thinnest electrode with a loading of 0.4 mgcat cm−2
MEA. (for this reason, no thickness values are reported for the 0.4 mgcat cm−2
MEA electrodes in Table II). The variation of the electrical in-plane resistivity values (
see 3rd column in Table II). As shown in Table II, the cathode catalyst layer thickness is roughly proportional to the cathode catalyst loading of the MEA, whereby owing to the error in the thickness measurement (ca. ±3 μm), no sufficiently accurate thickness values could be obtained for the thinnest electrode with a loading of 0.4 mgcat cm−2
MEA. (for this reason, no thickness values are reported for the 0.4 mgcat cm−2
MEA electrodes in Table II). The variation of the electrical in-plane resistivity values ( ) of the MEAs is reasonably small (as one would expect), except for one of the 4.0 mgcat cm−2
MEA loading MEAs, for which an almost 2-fold higher
) of the MEAs is reasonably small (as one would expect), except for one of the 4.0 mgcat cm−2
MEA loading MEAs, for which an almost 2-fold higher  value was obtained. We believe that this high
  value is the result of cracks in the catalyst layer that lead to an apparent increase of in-plane resistivity. In general, one can conclude that reliable in-plane four-point probe resistance measurements can only be made with electrodes that are thick enough to allow for a sufficiently precise thickness measurement and that are thin enough to be sufficiently free of cracks. Therefore, the true in-plane resistivity of the here produced catalyst layers is approximately 2.6 ± 0.3 Ω cm (corresponding to the average and the standard deviation of the five measurements in Table II, excluding the measurement of one of the 4.0 mgcat cm−2
MEA loading MEAs).
value is the result of cracks in the catalyst layer that lead to an apparent increase of in-plane resistivity. In general, one can conclude that reliable in-plane four-point probe resistance measurements can only be made with electrodes that are thick enough to allow for a sufficiently precise thickness measurement and that are thin enough to be sufficiently free of cracks. Therefore, the true in-plane resistivity of the here produced catalyst layers is approximately 2.6 ± 0.3 Ω cm (corresponding to the average and the standard deviation of the five measurements in Table II, excluding the measurement of one of the 4.0 mgcat cm−2
MEA loading MEAs).
Assuming an isotropic electrical conductivity of the cathode catalyst layer, an approximate value of the through-plane electrical resistance ( ) can be calculated from Eq. 2 and is shown in the last column of Table II (for the above given reason, the value of one of the 4.0 mgcat cm−2
MEA loading MEAs is likely compromised due to cracks in the catalyst layer).
) can be calculated from Eq. 2 and is shown in the last column of Table II (for the above given reason, the value of one of the 4.0 mgcat cm−2
MEA loading MEAs is likely compromised due to cracks in the catalyst layer).
Proton conduction resistance via EIS
It has already been discussed in the literature that for the typically rather thick PGM-free cathode catalyst layers the proton conduction resistance ( ) plays an important role, especially in the high current density region.
17
Therefore, AC impedance measurements in blocking condition (i.e., with H2 on the anode and N2 on the cathode) were conducted to further quantify the ionic resistance of the cathode catalyst layer. As in the case of MEAs with platinum-based cathode catalysts, the proton conduction resistance through the catalyst layer can be quantified using a transmission line model (TLM) analysis.
26
In general, for Pt/C-catalyst-based electrodes the difference between the low-frequency resistance (LFR) and the HFR represents one third of
) plays an important role, especially in the high current density region.
17
Therefore, AC impedance measurements in blocking condition (i.e., with H2 on the anode and N2 on the cathode) were conducted to further quantify the ionic resistance of the cathode catalyst layer. As in the case of MEAs with platinum-based cathode catalysts, the proton conduction resistance through the catalyst layer can be quantified using a transmission line model (TLM) analysis.
26
In general, for Pt/C-catalyst-based electrodes the difference between the low-frequency resistance (LFR) and the HFR represents one third of  26
whereas for PGM-free catalysts this may not be the case, depending on the
26
whereas for PGM-free catalysts this may not be the case, depending on the  ratio. As mentioned in the previous section, the determination of the proton conduction resistance from the Nyquist plot (blocking conditions) is less straightforward if
  becomes significant compared to
  which is described in Fig. 2 of Ref. 35. On the other hand, in that study it has been shown that if
  ≤ 0.10, the true
  value is larger by at most 20% compared to the apparent
  value that would be obtained from the simple TLM analysis approach given by Liu et al.,
26
i.e., compared to the value obtained from
value that would be obtained from the simple TLM analysis approach given by Liu et al.,
26
i.e., compared to the value obtained from  for
for  ≤ 0.05, this difference between the true and the apparent
  value is at most 10%.
To evaluate the possible error in the  value (in through-plane direction) obtained from the simple TLM analysis (i.e., assuming a negligible contribution from
  ), we assume that the electrical resistance of the catalyst layers determined by the 4-point-probe measurements is a reasonably good measure of the catalyst layer through-plane electronic resistance. For this, we first determine the
  values for the differently loaded electrodes by applying the simple TLM analysis to the blocking condition impedance data shown in Fig. 3a. The resulting apparent
  values are given by the gray bars in Fig. 3b for all four loadings. Based on the
  values in Table II, the
  ratios for the 1.0-4.0 mgcat cm−2
MEA loaded MEAs are ≈0.05, which means that the actual
ratios for the 1.0-4.0 mgcat cm−2
MEA loaded MEAs are ≈0.05, which means that the actual  values are expected to be ≈10% larger than the apparent
  values reported in Fig. 3b. Therefore, the simple TLM analysis yields reasonably accurate
  values for the here examined electrodes.

Figure 3. (a) Nyquist plot for the determination of the cathode catalyst layer proton conduction resistance ( ) for four different cathode catalyst loadings, recorded at 200 mV under 170 kPaabs H2/N2 at 90% RH and 80 °C. Solid lines represent the TLM fits and the symbols represent the raw impedance data. (b) Apparent proton conduction resistances (
 plotted vs the left y-axis) determined using the simple TLM that assumes that
  ≪ 0.10, and apparent proton conduction resistivities (
 plotted vs the right y-axis vs cathode catalyst loading), determined from
  and the measured electrode thicknesses (see Table II).
Download figure:
Standard image High-resolution imageNote that despite the fact that the ratio of  of ≈0.05 is relatively small, this will still result in a significant added contribution of
  to the HFR, estimated to be on the order of ΔHFR ≈ 0.05·
 (see Fig. 2 in Ref. 35). For the 2.0 and 4.0 mgcat cm−2
MEA loaded MEAs, this would amount to ΔHFR ≈ 6 mΩ cm2 and 33 mΩ cm2, respectively, which is reasonably consistent with the HFR measurements shown in Fig. 2b. It should further be noted that the here-observed small impact of
(see Fig. 2 in Ref. 35). For the 2.0 and 4.0 mgcat cm−2
MEA loaded MEAs, this would amount to ΔHFR ≈ 6 mΩ cm2 and 33 mΩ cm2, respectively, which is reasonably consistent with the HFR measurements shown in Fig. 2b. It should further be noted that the here-observed small impact of  on the determination of
  does not necessarily mean that the impact of
  is negligible for all PGM-free cathode catalyst based electrode layers, as the electronic resistance of some PGM-free catalysts can be significantly higher, in which case a more complex analysis of the impedance spectra is required in order to quantify
  (currently being examined in our group).
Cell voltage correction and mass activity
Assuming that the ORR kinetics of the PGM-free catalyst follow Tafel kinetics, the effective proton conduction resistance ( ) that allows to determine the voltage loss due to the proton conduction resistance across the cathode (
 ) can be determined by the same approach previously described by Neyerlin et al.
36
(based on assuming a negligible electrical resistance of the catalyst layer):
) can be determined by the same approach previously described by Neyerlin et al.
36
(based on assuming a negligible electrical resistance of the catalyst layer):

Here, ζ represents the dimensionless correction factor that depends on the product of current density and the proton conduction resistance divided by the intrinsic Tafel slope for the ORR (b), i.e., on  36
The voltage losses associated with the proton conduction resistance can then be determined from:
36
The voltage losses associated with the proton conduction resistance can then be determined from:

Since  depends on the intrinsic Tafel slope for the ORR, the Tafel slope must be known in order to determine
  For this reason, Fig. 4 shows the cell voltage correction for the proton transport losses for the differently loaded MEAs, assuming either b = 140 mV dec−1 (open symbols) or b = 70 mV dec−1 way that is generally observed for Pt/C-based cathodes
22
(closed symbols).
For this reason, Fig. 4 shows the cell voltage correction for the proton transport losses for the differently loaded MEAs, assuming either b = 140 mV dec−1 (open symbols) or b = 70 mV dec−1 way that is generally observed for Pt/C-based cathodes
22
(closed symbols).
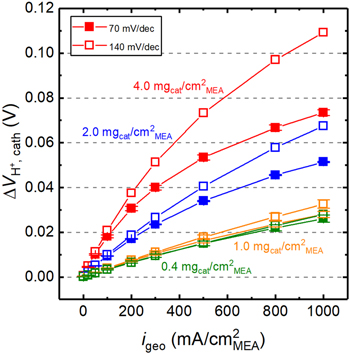
Figure 4. Voltage losses associated with the proton conduction resistance at 80 °C and 90% RH (acc. to Eqs. 3 and 4) vs current density for the differently loaded MEAs, using the apparent  values shown in Fig. 3b and assuming intrinsic Tafel slopes of either 70 mV dec−1 or 140 mV dec−1.
Download figure:
Standard image High-resolution imageFigure 4 shows that for the small  values for the thin electrodes of the low loaded MEAs (i.e., for 0.4 mgcat cm−2
MEA (green) and 1.0 mgcat cm−2
MEA (orange)), the difference in
values for the thin electrodes of the low loaded MEAs (i.e., for 0.4 mgcat cm−2
MEA (green) and 1.0 mgcat cm−2
MEA (orange)), the difference in  based on assuming Tafel slopes of either 70 or 140 mV dec−1 is negligible in the whole current density range. On the other hand, for the thicker catalyst layers of the MEAs with 2.0 mgcat cm−2
MEA (blue) and 4.0 mgcat cm−2
MEA (red) that exhibit rather large
based on assuming Tafel slopes of either 70 or 140 mV dec−1 is negligible in the whole current density range. On the other hand, for the thicker catalyst layers of the MEAs with 2.0 mgcat cm−2
MEA (blue) and 4.0 mgcat cm−2
MEA (red) that exhibit rather large  values (see Fig. 3b), the difference in
  between the two assumed Tafel slopes becomes more significant at high current densities, amounting to ≈20 mV and ≈30 mV at 1000 mA cm−2
MEA for the 2.0 and 4.0 mgcat cm−2
MEA loaded MEAs, respectively. Nevertheless, this difference is insignificant in the low current density region in which ORR mass activities are generally determined. For example, when determining the ORR mass activity of the PGM-free catalyst at the commonly used cathode potential of 0.80 V, the current density even for the highest catalyst loading of 4.0 mgcat cm−2
MEA would only be ≈100 mA cm−2
MEA (see Fig. 2a), where the difference in
between the two assumed Tafel slopes becomes more significant at high current densities, amounting to ≈20 mV and ≈30 mV at 1000 mA cm−2
MEA for the 2.0 and 4.0 mgcat cm−2
MEA loaded MEAs, respectively. Nevertheless, this difference is insignificant in the low current density region in which ORR mass activities are generally determined. For example, when determining the ORR mass activity of the PGM-free catalyst at the commonly used cathode potential of 0.80 V, the current density even for the highest catalyst loading of 4.0 mgcat cm−2
MEA would only be ≈100 mA cm−2
MEA (see Fig. 2a), where the difference in  is only ≈2 mV between the two assumed Tafel slopes of 70 and 140 mV dec−1.
However, when correcting the polarization curves shown in Fig. 2 for  over the entire current density range, a specific Tafel slope value has to be chosen a priori and then would have to be consistent with the transport-corrected H2/O2 performance curves. In the following, we have assumed an intrinsic Tafel slope of 140 mV/dec. For comparison, Ahluwalia et al.
37
reported two ORR Tafel slopes for an Fe–N–C catalyst, namely ≈120 mV dec−1 at low current densities and ≈220 mV dec−1 at high current densities, whereby the latter was considered to be the intrinsic Tafel slope based on their kinetic model.
over the entire current density range, a specific Tafel slope value has to be chosen a priori and then would have to be consistent with the transport-corrected H2/O2 performance curves. In the following, we have assumed an intrinsic Tafel slope of 140 mV/dec. For comparison, Ahluwalia et al.
37
reported two ORR Tafel slopes for an Fe–N–C catalyst, namely ≈120 mV dec−1 at low current densities and ≈220 mV dec−1 at high current densities, whereby the latter was considered to be the intrinsic Tafel slope based on their kinetic model.
Figure 5 shows the H2/O2 polarization curves in terms of the recorded cell voltage ( same data as in Fig. 2a), of the HFR-corrected cell voltages ((
 using the HFR data shown in Fig. 2b), and of the cell voltages corrected for the HFR and for
 based on the values shown in Fig. 4 for b = 140 mV dec−1).
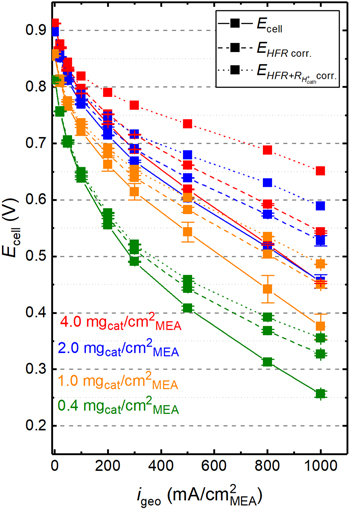
Figure 5. Initial H2/O2 polarization curves for the differently loaded MEAs at 80 °C/90% RH, and 170 kPaabs, applying different voltage loss corrections to the cell voltage: as-measured  (solid lines; same data as in Fig. 2a); HFR-corrected cell voltages (
 dashed line; based on the HFR data shown in Fig. 2b); and HFR- and
  -corrected cell voltages (
 dotted lines; based on the
  values shown in Fig. 4 for b = 140 mV dec−1).
Download figure:
Standard image High-resolution imageIn order to determine the ORR mass activities for the differently loaded MEAs, the current densities of the HFR- and  -corrected H2/O2 performance curves (dotted lines in Fig. 5) were normalized by the cathode catalyst loading. This is shown in Fig. 6a, indicating that for a given HFR- and
  -corrected voltage (
 ) the mass activity (imass, in units of A/g) is essentially independent of the cathode catalyst loading. At the typical transport-corrected reference voltage of 0.80 V, the mass activities for cathode catalyst loadings of 1.0-4.0 mgcat cm−2
MEA range between 30–40 A g−1; at 0.75 V, the mass activities range between 60–100 A g−1 for all MEAs (0.4–4.0 mgcat cm−2
MEA). Thus, there is no significant variation of the ORR mass activity over a 10-fold change in catalyst loading. Jaouen et al. also reported that the mass activity at 0.8 V over a 4-fold change in the loading has just slightly changed for nine PGM-free different catalysts.
38
) the mass activity (imass, in units of A/g) is essentially independent of the cathode catalyst loading. At the typical transport-corrected reference voltage of 0.80 V, the mass activities for cathode catalyst loadings of 1.0-4.0 mgcat cm−2
MEA range between 30–40 A g−1; at 0.75 V, the mass activities range between 60–100 A g−1 for all MEAs (0.4–4.0 mgcat cm−2
MEA). Thus, there is no significant variation of the ORR mass activity over a 10-fold change in catalyst loading. Jaouen et al. also reported that the mass activity at 0.8 V over a 4-fold change in the loading has just slightly changed for nine PGM-free different catalysts.
38
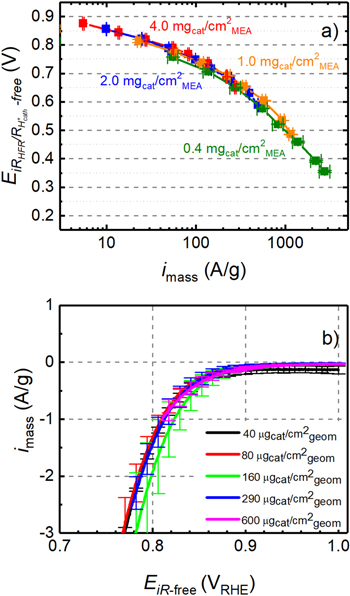
Figure 6. Dependence of the ORR mass activity (imass) on the proton transport-corrected cell voltage for different cathode catalyst loadings: (a) deduced from proton transport-corrected H2/O2 performance curves (same data as shown by the dotted lines in Fig. 5) at 80 °C/90% RH, and 170 kPaabs in a single-cell PEMFC (error bars represent the min/max values of two independent repeat experiments for each loading); (b) obtained from RDE experiments at 1600 rpm conducted in O2-saturated 0.1 M HClO4 at 25 °C from the positive-going scan at 5 mV s−1 (error bars represent the standard deviation of three independent repeat experiments for each loading).
Download figure:
Standard image High-resolution imageThe dependence of the ORR mass activity of the PGM-free catalyst on catalyst loading was also investigated by RDE experiments in 0.1 M HClO4 at 25 °C, using a wide range of catalyst loadings (40, 80, 160, 290, and 600 μgcat cm−2
geom). After correcting the disk potential for the uncompensated electrolyte resistance (obtaining the iR-free cell voltage,  ) and for the capacitive current contributions, the geometric currents were normalized by the catalyst loadings to obtain the mass activities (imass). No correction for the oxygen mass transport resistance was performed, since the maximum geometric current densities for the RDE data shown in Fig. 6b are kept at ≤20% of the diffusion-limited current density for a 2-electron reduction process, so that O2 transport resistances should be negligible (i.e., the RDE data are acquired in the kinetically-controlled region). As can be seen in Fig. 6b, the mass activities in the kinetically-controlled region overlap quite closely for all the catalyst loadings (40–600 μgcat cm−2
geom), suggesting that the catalyst loading does not have any impact on the ORR mass activity in the kinetically-controlled region, analogous to what has been observed in the PEMFC measurements (Fig. 6a). The mass activities at 0.80 V vs RHE range between 1.3–2.0 A g−1, without showing any trend with respect to catalyst loading (excluding the data set for the loading of 160 μgcat cm−2
geom that has very large error bars, the mass activity ranges between 1.3–1.5 A g−1). This is comparable to the mass activities of Fe–N–C catalysts synthesized by several different groups, reported to range between 0.7–3.2 A g−1 at 0.80 V vs RHE and 25 °C (taken in 0.5 M H2SO4 at 1600 rpm, at loadings of 800 μgcat cm−2
geom).
39
The ≈25-fold higher ORR mass activities at 0.80 V vs RHE obtained in the single-cell PEMFC measurements at 80 °C (Fig. 6a) compared to the RDE measurements at 25 °C (Fig. 6b) is likely due to the difference in temperature, in which case this would correspond to an apparent activation energy of ≈50 kJ mol−1. This is much higher than expected
40,41
and requires a further reason to explain the difference. The use of catalyst without ball milling for RDE analysis and ball-milled for PEMFC test could be the second important origin of lower activity in RDE, possibly increased in PEMFC due to exposition of additional active sites to electrolyte/ionomer and to improved dispersion/homogeneity of the catalyst ink.
42
) and for the capacitive current contributions, the geometric currents were normalized by the catalyst loadings to obtain the mass activities (imass). No correction for the oxygen mass transport resistance was performed, since the maximum geometric current densities for the RDE data shown in Fig. 6b are kept at ≤20% of the diffusion-limited current density for a 2-electron reduction process, so that O2 transport resistances should be negligible (i.e., the RDE data are acquired in the kinetically-controlled region). As can be seen in Fig. 6b, the mass activities in the kinetically-controlled region overlap quite closely for all the catalyst loadings (40–600 μgcat cm−2
geom), suggesting that the catalyst loading does not have any impact on the ORR mass activity in the kinetically-controlled region, analogous to what has been observed in the PEMFC measurements (Fig. 6a). The mass activities at 0.80 V vs RHE range between 1.3–2.0 A g−1, without showing any trend with respect to catalyst loading (excluding the data set for the loading of 160 μgcat cm−2
geom that has very large error bars, the mass activity ranges between 1.3–1.5 A g−1). This is comparable to the mass activities of Fe–N–C catalysts synthesized by several different groups, reported to range between 0.7–3.2 A g−1 at 0.80 V vs RHE and 25 °C (taken in 0.5 M H2SO4 at 1600 rpm, at loadings of 800 μgcat cm−2
geom).
39
The ≈25-fold higher ORR mass activities at 0.80 V vs RHE obtained in the single-cell PEMFC measurements at 80 °C (Fig. 6a) compared to the RDE measurements at 25 °C (Fig. 6b) is likely due to the difference in temperature, in which case this would correspond to an apparent activation energy of ≈50 kJ mol−1. This is much higher than expected
40,41
and requires a further reason to explain the difference. The use of catalyst without ball milling for RDE analysis and ball-milled for PEMFC test could be the second important origin of lower activity in RDE, possibly increased in PEMFC due to exposition of additional active sites to electrolyte/ionomer and to improved dispersion/homogeneity of the catalyst ink.
42
Based on the PEMFC and RDE data in Fig. 6, it is clear that the loading of the here examined Fe–N–C-based ORR catalyst does not affect its mass activity, which is at variance with our previous study with an Fe-substituted ZrO2 (FexZr1−xO2−δ ) catalyst, where we had observed an increase in ORR mass activity with catalyst loading. 15 In that study we had hypothesized that with an increase in catalyst loading, which entails an increase in catalyst layer thickness, the probability of intermediate hydrogen peroxide to be further reduced rather than leaving the catalyst layer would also increase. The associated decrease in peroxide concentration within the catalyst layer with increasing catalyst loading was then assumed to results in a positive potential shift of the Nernst potential for the electrochemical reduction of O2 to H2O2, thus in an apparent variation in mass activity. The here reported catalyst is also known to provide a lower peroxide yield (≈3% at 0.4 VRHE and 800 μgcat cm−2 geom 39 ) compared to FexZr1−xO2−δ catalyst (≈10% at 0.4 VRHE and 576 μgcat cm−2 geom 15 ). The evident large difference in mass activity and peroxide yield between the here used Fe–N–C catalyst and the FexZr1−xO2−δ catalyst in our previous study is the most likely origin for the different relationships between ORR mass activity and catalyst loading. More explicitly, using a very active (and very low peroxide-producing, see 43 ) catalyst, it is unlikely that peroxide leaves the catalyst layer unreacted even at low loadings, and it is hard to detect any further significant decrease in peroxide concentration with a loading increase, i.e., it is unlikely to detect any loading effect on mass activity.
Stability of the catalyst during sequential H2/O2 polarization curves
Aside from the lower ORR mass activity compared to Pt/C-based catalysts, the low stability of PGM-free catalysts is another barrier on the way of their utilization as an alternative for PGM-based catalysts in PEMFCs. Their degradation mechanisms have been studied, but they are not completely clear, thus the way to prolong the operating hours for PGM-free catalysts has not yet emerged. Recent comprehensive studies suggested that the main degradation mechanisms of MEAs with PGM-free cathode catalysts is related to a loss of active sites caused by the Fe-catalyzed formation of hydrogen peroxide in the presence of oxygen. 44,45
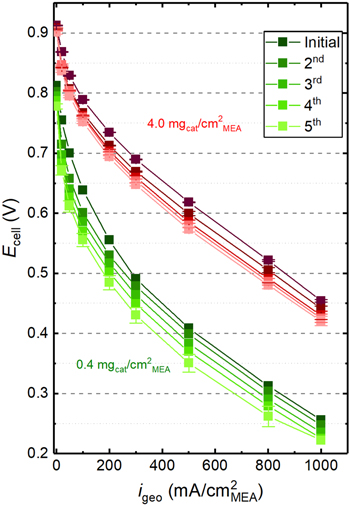
As shown in Fig. 7, a significant catalyst degradation is evident over the course of the acquisition of only five H2/O2 polarization curves. Comparing the initial polarization curve with the 2nd polarization curve, which was recorded after the CVs shown in Fig. 1, a clear performance decay is evident for both low loaded (green curves) and high loaded (red curves) MEAs. Between the 2nd and the 3rd polarization curve, the impedance measurements to determine the proton conduction resistance were conducted. As the performance loss between the 2nd and the 3rd polarization curves does not seem larger than between the 1st and the 2nd polarization curves, this impedance measurement under H2/N2 does not seem to lead to an additional performance degradation; this would be consistent with the findings by Ahluwalia et al. 44 that the degradation of PGM-free catalysts is most pronounced in the presence of oxygen. Over the 4th and 5th polarization curve, the performance degradation per curve is decreasing, but it is still significant.
Figure 7. H2/O2 polarization curves at 80 °C/90% RH and 170 kPaabs for highest and lowest catalyst loadings examined in this study. "Initial" refers to the very first polarization curve without any prior conditioning procedure; the 2nd polarization curve is taken after the acquisition of the CVs shown in Fig. 1; the 3rd, 4th, and 5th polarization curves are recorded after the impedance measurements in blocking conditions to determine the proton conduction resistance (done between the 2nd and 3rd curve).
Download figure:
Standard image High-resolution image
Looking at the cell voltage difference between initial and 5th H2/O2 polarization curves at a current density of 100 mA cm−2 MEA, higher degradation in the low loaded MEAs (85 mV loss) was observed compared to high loaded MEAs (40 mV loss). These results are in agreement with the literature, where it has been reported that higher loadings show higher stability due to the higher absolute catalyst amount available for the ORR reaction. 8 At higher current density (500 mA cm−2 MEA) the difference in the degradation of the low and high loaded MEAs is rather small (55 mV vs 45 mV loss). Nevertheless, it cannot be excluded that this may also be related to the different potential ranges in which the differently loaded cathodes operate when recording the H2/O2 polarization curves, i.e., extending to much lower voltages in the case of the low loaded MEAs. Therefore, the difference in the average potential might also be another factor if there were a potential dependence of the catalyst degradation, even though Ahluwalia et al. 44 suggest that potential is not the main driver for the degradation of PGM-free catalysts.
In summary, while MEAs with lower catalyst loadings exhibit higher degradation at low current density and almost the same degradation at high current density, the presented data do not allow to conclude whether the loading of the PGM-free ORR catalyst impacts catalyst durability. Also, in order to evaluate the loading impact on stability of the catalyst, it is necessary to deconvolute and quantify the various voltage loss terms over the course of a durability experiments, which will be part of future work.
Conclusions
The ORR mass activity of a commercial PGM-free Fe–N–C-type catalyst (from Pajarito Powder) was determined from H2/O2 performance curves at 80 °C/90% RH and 170 kPaabs after correcting for the voltage losses originating from electrical, contact, membrane, and proton conduction resistances in a PEM single-cell fuel cell, evaluating a wide range of catalyst loadings (0.4–4.0 mgcat cm−2
MEA). A comparison of the through-plane electrical resistance  of the catalyst layer determined by ex situ in-plane 4-point-probe measurements (
 ) with the apparent proton conductivity determined by in situ impedance measurements under blocking conditions (
 ) shows that for this catalyst the effect of the electrical resistance is sufficiently low to determine
  with an estimated error of ≈10% or less. At the same time, for the thick high-loaded catalyst layers, a clear increase of the high frequency resistance (HFR) due to the electrical resistance of the catalyst layer can be observed; the HFR increase is shown to be consistent with the measured
  and
and  values. For the appropriately resistance-corrected H2/O2 performance curves, the ORR mass activity is independent of catalyst loading.
These data were compared to solution-resistance and capacity-corrected RDE data that were also taken over a wide range of loadings (40–600 μgcat cm−2 geom) at 25 °C in 0.1 M HClO4. Also for this measurement configuration, no significant dependence of the ORR mass activity on catalyst loading was observed, consistent with the PEMFC data. These findings are at variance with our previous measurements on an Fe-substituted ZrO2 catalyst, for which we had observed an increase in ORR mass activity with catalyst loading. 15 This is likely related to differences in the hydrogen peroxide yield for these two types of catalyst.
Over the course of five sequential H2/O2 polarization curves, a significant loss in MEA performance is observed for both 0.4 and 4.0 mgcat cm−2 MEA loadings, where lower loading MEA exhibits higher degradation at low current density (100 mA cm−2 MEA) and almost the same degradation at high current density (500 mA cm−2 MEA). While we cannot draw a solid conclusion with regards to the impact of catalyst loading on the performance degradation, we suggest that the determination of voltage losses is important when studying the performance degradation of MEAs with PGM-free ORR catalysts.
Acknowledgments
We would like to thank the German Federal Ministry of Economy (BMWi) for the financial support (Project: innoKA, Project number: 03ET6096A) and European Union's Horizon 2020 Programme (PEGASUS). PEGASUS has received funding from the Fuel Cells and Hydrogen 2 Joint Undertaking under grant agreement No 779550. This Joint Undertaking receives support from the European Union's Horizon 2020 research and innovation programme, Hydrogen Europe and Hydrogen Europe research. We would like to thank Anna Freiberg, Armin Siebel, and Bharatkumar Suthar for the fruitful discussions during this study.