Abstract
In this contribution, we demonstrate the presence of high-spin Fe3+ in Fe-substituted ZrO2 (FexZr1−xO2−δ), as deduced from X-ray photoelectron spectroscopy (XPS), near-edge X-ray absorption fine structure (NEXAFS), and 57Fe Mössbauer spectroscopy measurements. The activity of this carbon-supported FexZr1−xO2−δ catalyst toward the oxygen reduction reaction (ORR) was examined by both rotating (ring) disk electrode (R(R)DE) method and single-cell proton exchange membrane fuel cells (PEMFCs). DFT calculations suggest that the much higher ORR mass activity of FexZr1−xO2−δ compared to Fe-free ZrO2 is due to the enhanced formation of oxygen vacancies: their formation is favored after Zr4+ substitution with Fe3+ and the oxygen vacancies create potential adsorption sites, which act as active centers for the ORR. H2O and/or H2O2 production observed in RRDE measurements for the Fe0.07Zr0.93O1.97 is also in agreement with the most likely reaction paths from DFT calculations. In addition, Tafel and Arrhenius analyses are performed on Fe0.07Zr0.93O1.97 using both RRDE and PEMFC data at various temperatures.
Export citation and abstract BibTeX RIS

This is an open access article distributed under the terms of the Creative Commons Attribution Non-Commercial No Derivatives 4.0 License (CC BY-NC-ND, http://creativecommons.org/licenses/by-nc-nd/4.0/), which permits non-commercial reuse, distribution, and reproduction in any medium, provided the original work is not changed in any way and is properly cited. For permission for commercial reuse, please email: oa@electrochem.org.
Year 2015 was a landmark in the field of green energy, as 195 countries reached an agreement on the platform of the United Nations in France to lower greenhouse gas (GHG) emissions.1 Zero emission vehicles (ZEVs) have gained paramount importance in order to decrease global GHG emissions from the transportation sector, which accounts for ≈14% of the total global emissions.2,3 Proton-exchange-membrane fuel cell (PEMFC) technology is currently most suitable to power fuel cell electric vehicles (FCEVs). However, its large-scale commercialization is impeded by several drawbacks, among which the high cost and limited availability of platinum-based catalysts is considered one of the most severe problems. Since ≈4 times more Pt is required for the cathode than for the anode (owing to the slow oxygen reduction reaction (ORR) kinetics in contrast to the very fast kinetics for the hydrogen oxidation reaction (HOR)), decreasing the Pt loading at the cathode is one possible approach to decrease the cost of the PEM fuel cell stack. However, low-loaded Pt electrodes are known to exhibit performance losses originating from mass-transport limitations, which have been assigned primarily to oxygen transport resistances occurring at the Pt/ionomer interface.4,5 In addition, Kongkanand and Mathias6 have reported that a decrease of the noble metal loading to below 100 μgPt/cm2geo results in an increase in the stack cost since below this loading other stack components like the bipolar plates, the gas diffusion layer, the membrane as well as system components need further improvements and become more costly. Thus, current ORR catalyst research for PEMFCs is mainly driven by developing either highly active Pt-alloy catalysts or active and cost-effective platinum-group-metal-free (PGM-free) catalysts. Iron-based catalysts, specifically those based on iron coordinated to nitrogen and carbon (often referred to as Fe-N-C catalysts), are currently the most advanced PGM-free catalysts and recent developments have dramatically narrowed the ORR activity gap between Fe-N-C and Pt catalysts.7–14 However, the biggest drawback of Fe-N-C catalysts is their lack of long-term operational stability.15,16 Another class of PGM-free catalysts is based on valve metal compounds (nitrides, carbonitrides, and oxides of Group 4 and 5 metals); in particular valve metal oxides (ZrO2, Ta2O5, etc.), have been reported to be ORR active.17–20 The intrinsic thermodynamic stability against dissolution in an acidic environment of valve metal oxides and their reported ORR activity makes this class of materials very attractive. However, in our previous work, we concluded that ORR activities of pure carbon supported ZrO2 nanoparticles are still far too low for practical PEMFC applications.21 One strategy to increase their ORR activity is to increase the density of oxygen vacancies or uncoordinated metal sites, hypothesized to be sites with higher ORR activity.22–24 In this respect, Ishihara et al.25 have already claimed enhanced ORR activity for titanium-niobium oxides (prepared by a sol-gel method), showing that the strength of oxygen interaction with the oxide surfaces could be tuned by substitutional ions (here, Nb in TiO2) causing valence changes and/or oxygen vacancies. Creation of oxygen vacancies in bulk ZrO2 by substitution of Zr4+ by Fe3+ has been reported by Sangalli et al.26 In their study, they use both theoretical (density functional theory, DFT) and experimental approaches (synthesis of Fe-doped ZrO2 thin films) to prove the formation of oxygen vacancies by Fe3+ doping into the ZrO2 lattice.
Based on these positive effects of cation substitution, in 2017 we developed and communicated a novel approach to significantly increase the ORR activity of carbon-supported (graphitized Ketjenblack, KBgraph) ZrO2-based catalysts.27 Even though the nature of active sites was not clear, it was demonstrated that a very small amount of Fe (as low as 0.36 wt% referenced to the total weight of the catalyst) in 12 wt% ZrO2 supported on carbon (≡ Fe/Zr atomic ratio of 7/93) significantly boosted the ORR activity. In addition, we showed that an optimum ORR activity was obtained for an Fe loading between 0.36–1.0 wt%, whereas the ORR activity was substantially lower at 0.1 and 10 wt% Fe loading. This lower ORR activity for the latter was hypothesized to be mainly due to a decreased density of active sites for 0.1 wt% Fe and the presence of less active compounds with 10 wt% Fe.
Understanding the nature of active sites is of utmost importance in (electro-)catalyst research; hence, the focus of the present work is to decipher the actual structure of the catalyst, i.e., to demonstrate that Fe is indeed substituted into the ZrO2 structure, and the exact nature of the Fe coordination. For this reason, we here characterize our previously reported most active catalysts (assessed by the rotating (ring) disk electrode technique, R(R)DE), viz., Fe0.07Zr0.93O1.97 (0.36 wt% Fe in ZrO2) and Fe0.17Zr0.83O1.91 (1.0 wt% Fe in ZrO2) by X-ray photoelectron spectroscopy (XPS), near-edge X-ray absorption fine structure (NEXAFS), and 57Fe Mössbauer spectroscopy. In addition, we perform particle size analyses of ZrO2 nanoparticles in the catalysts by transmission electron microscopy (TEM). Furthermore, the Fe0.07Zr0.93O1.97 catalyst is subjected to further rigorous electrochemical characterization in thin-film R(R)DE and single-cell PEMFC measurements, including determination of the apparent activation energy and the Tafel slope. RRDE measurements at various electrode loadings are conducted to determine the hydrogen peroxide (H2O2) yield characteristics of the Fe0.07Zr0.93O1.97 catalyst. Finally, the structural and electronic features of the Fe-substituted ZrO2 surface is investigated by first-principles simulations. While recent theoretical studies have addressed the surface chemistry of pure, non-defective zirconia,28 here we focus on the effects of Fe substitution on the catalyst's electronic structure, on the formation of surface oxygen vacancies, and on the interaction with reactive oxygen species. Our DFT-based results provide additional new insights that support the interpretation of our experimental ORR data.
Experimental
Chemicals
All commercially available chemicals were used without further purification. Zirconium tetrachloride (≥99.5%), 2-methylnaphthalene (97%), 2-bromonaphthalene (97%), 1,8-diazabicyclo[5.4.0]-5-undec-7-ene (≥99.0%), and 2-ethoxyethanol (99%) were purchased from Sigma-Aldrich. 4-tert-butylphthalonitrile (≥98%) was obtained from TCI. Zirconium (IV) tetra-tert-butyl-dichlorophthalocyanine (ZrCl2Pc(t-Bu)4) and iron(II) tetra-tert-butyl-phthalocyanine (FePc(t-Bu)4) were synthesized similarly to what is reported in previous publications,29,30 except that 4-tert-butylphthalonitrile instead of 1,2-dicyanobenzene was used as a starting precursor in order to obtain soluble phthalocyanines. ZrCl2Pc(t-Bu)4 and FePc(t-Bu)4 were characterized by Fourier transform infrared spectroscopy (to confirm metal insertion into the Pc)31 and by thermogravimetric analysis under air (to quantify the metal content).21 We would also like to mention that the obtained precursor contained a significant fraction of organic impurities, resulting in a Zr content ≈3 times smaller than expected for an ideal ZrCl2Pc(t-Bu)4. Unfortunately, we were unable to remove the impurities from the precursor even after rigorous purification and then we used in the synthesis an amount ≈3 times higher. The exact origin of the presence of organic impurities in the precursor is not yet known, but it could be due to the presence of water impurities in a reactant, leading to the catalysis of an organic side reaction.
Catalyst synthesis
For the present study, we synthesized four carbon-supported catalysts, viz., Fe0.17Zr0.83O1.91 [denoted as Fe-ZrO2 (1.0 wt%)], Fe0.07Zr0.93O1.97 [denoted as Fe-ZrO2 (0.36 wt%)], Fe, and ZrO2. All samples were supported on graphitized Ketjenblack carbon [denoted as KBgraph] (EA-type from Tanaka Kikinzoku Kogyo). A graphitized carbon was chosen in order to minimize the presence and effect of surface oxygen groups, thus to have a better control of the partial oxidation during the heat-treatment step in the catalyst synthesis procedure. The ZrO2 content was kept constant (theoretical 12 wt% ZrO2/KBgraph) in all samples, except for the pure Fe catalyst [denoted as Fe], where no ZrO2 is present. The synthesized catalysts Fe0.17Zr0.83O1.91 and Fe0.07Zr0.93O1.97 (FexZr1−xO2−δ) are those reported in our past research, where the Fe/ZrO2 atomic ratios are 7/93 (Fe-ZrO2 (0.36 wt% of Fe)) and 17/83 (Fe-ZrO2 (1.0 wt% of Fe)), whereby wt% of Fe is referred to the mass of metallic Fe in the final catalyst.27 Catalysts were synthesized by first depositing the corresponding amounts of ZrCl2Pc(t-Bu)4 and/or FePc(t-Bu)4 onto KBgraph using a similar impregnation process as described previously.32 After impregnation, the solvent (chloroform, ≥99.9%) was removed by rotovaporation (Heidolph, Hei-VAP Value). The mixture was further dried overnight at 70°C to remove all residual chloroform. The dried mixture was then transferred to a quartz tube furnace (HTM Reetz, LK 1300-150-600-3). Initially, the temperature was ramped up to 800°C in 5% H2/Ar gas atmosphere. A heating rate of ≈10°C min−1 was maintained until ≈700°C, which was then decreased to 2°C min−1 until 800°C to avoid temperature overshoot. The temperature was then held for 2 h in the same gas-mixture, before switching to a mixture of 2.5% H2 and 0.5% O2 in Ar (partial oxidation, PO) (5.0 grade, all gases supplied by Westfalen AG) for another 1 h at the same temperature. Finally, the furnace was cooled to RT in 5% H2/Ar. The as-prepared catalysts were not subjected to any acid washing step after their synthesis.
Physicochemical characterization
Catalysts were subjected to inductively coupled plasma atomic emission spectrometry (ICP-AES; iCap 6500, Thermo Fisher Scientific) in order to determine the exact amount of Fe and ZrO2. The samples were first digested in hydrofluoric acid (40 wt%), and then in aqua regia by using a microwave digester. In addition to ICP-AES, the total metal oxide content (ZrO2 + Fe2O3) was evaluated by thermogravimetric analysis (TGA, Mettler-Toledo, TGA/DSC 1) from the residual sample weight after complete combustion of the catalyst at 1000°C in a mixture of O2/Ar (67/33%) atmosphere. The particle size distribution of ZrO2 was evaluated by transmission electron microscopy (TEM) measurements with a JEOL JEM 1400-Plus transmission electron microscope, operated at an acceleration voltage of 120 kV. Holey carbon-coated TEM grids were used for sample mounting. A CCD camera was employed to collect several images at 200,000× magnification. The software ImageJ33 was used to measure the diameter of at least 100 individual particles. From this data, the number averaged particle size (DAverage) and the standard deviation (SD) were computed. The Sauter diameter (DSauter) (surface−volume averaged diameter) was calculated as in Eq. 1, where li is the number of particles with diameter (di).
![Equation ([1])](https://content.cld.iop.org/journals/1945-7111/166/7/F3032/revision1/d0001.gif)
Fe0.17Zr0.83O1.91 and Fe0.07Zr0.93O1.97 were subjected to X-ray photoelectron spectroscopy (XPS) to investigate the Fe coordination and oxidation state. Analyses of the samples were performed on a Kratos Axis Supra spectrometer using monochromated Al Kα radiation at an energy of 1486.6 eV, operated at a total power of 525 W, 15 kV and 35 mA anode current. The samples were previously outgassed (overnight) in an ultrahigh vacuum chamber in order to remove atmospheric moisture and contaminants, so that the pressure in the chamber during the analysis was less than 1.0·10−8 Torr. All the binding energy values were calibrated using the carbon signal from the KBgraph carbon support (C 1s = 284.8 eV) as reference. The narrow Fe 2p spectra were collected between 702.5 to 745 eV binding energy (BE) using a step size of 0.1 eV and a pass energy of 40 eV. The XPS data analysis was performed by Casa XPS software. The represented data are an average of 10 spectra recorded for 10 min each.
Fe0.17Zr0.83O1.91 and Fe0.07Zr0.93O1.97 were also characterized by near-edge X-ray absorption fine structure (NEXAFS) data at the Fe L2,3 edges. A pure ZrO2 sample was also measured to demonstrate the absence of Fe. Spectra were collected at IFP's (Institut für Festkörperphysik) soft X-ray analytics facility WERA at the Karlsruhe synchrotron facility ANKA, Germany. Partial fluorescence-yield (FY) detection was used, both for its quasi-bulk probing depth of about 50 nm and for its independence from charging effects in non-conducting samples. For the Fe concentrations in this study, self-absorption and saturation effects were small and were not corrected. The photon-energy resolution was set to about 340 meV at the Fe L edges. The photon energy was calibrated to better than 30 meV by simultaneously measuring a NiO reference sample at the Ni L3 edge (853.0 eV).34 The collected data are the sum of two distinct scans (30 min each). To obtain the simulated data, the code developed by Thole and van der Laan, Butler, and Cowan,35–37 and maintained and further developed by Stavitski and de Groot38 was used to calculate spectra for different values of the crystal-field splitting (Delta_CF) and charge transfer energy (Delta_c). Hund's rule for exchange interaction was also taken into account. Charge-transfer effects were included for Fe2+ (Fe3+) by admixing transitions of the type 2p6 3d7L → 2p5 3d8L (2p6 3d6L → 2p5 3d7L), where L denotes a hole at the oxygen ligand. Multiplet parameters (in eV) are: i) Fe2+ HS: Delta_CF (10Dq) = 1.0, Delta_c = 4.0; ii) Fe2+ LS: Delta_CF (10Dq) = 2.5, Delta_c = 4.0; iii) Fe3+ HS: Delta_CF (10Dq) = 0.8, Delta_c = 4.5; and, iv) Fe3+ LS: Delta_CF (10Dq) = 3.0, Delta_c = 4.5. The correlation energy U_dd, the core-hole potential U_pd, as well as the hopping parameters T_sigma and T_pi were set for all spin and valence states to 5.0, 6.0, 2.0, and 1.0, respectively. The Slater integrals were renormalized to 80% of their Hartree-Fock values. According to the experimental resolution and the lifetime broadening, the simulations have been convoluted with a Gaussian with σ_G = 0.2 eV and with a Lorentzian with σ_(L_3) = 0.2 eV (σ_(L_2) = 0.3 eV) for the L_3 (L_2) edge. Finally, the position on the energy scale of the modelled spectra was adjusted by matching the white-line energy of experimental spectra with that of the Fe3+ high-spin modelled spectrum; the correctness of this adjustment was confirmed by comparison of the experimental data with the literature (see Results and Discussion).
In addition to XPS and NEXAFS, the Fe0.17Zr0.83O1.91, Fe0.07Zr0.93O1.97, and Fe catalysts were also subjected to 57Fe Mössbauer analyses to ascertain the exact nature of Fe coordination in the catalysts. Mössbauer spectra were recorded on powder samples placed in poly(methyl methacrylate) based holders (absorber thickness: 80–90 mg/cm², sample holder diameter = 10 mm) at 4.2 K. For this, the absorber and the source of 57Co in rhodium (ca. 1 Giga Becquerel) were cooled in a liquid helium bath cryostat. The spectra were fitted with a superposition of Lorentzian lines grouped into sextets using the MOS90 software (version 2.2). The fitted components often show broadened lines and have to be considered as representing distributions of magnetic hyperfine fields. Isomer shifts were measured with respect to the source having the same temperature as the absorber. Lastly, 0.245 mm/s was added to each isomer shift so that it can be referenced to α-Fe.
Electrochemical characterization
Rotating (ring) disk electrode measurements
The thin-film rotating (ring) disk electrode (TF-R(R)DE) technique was used to screen the ORR activity of the samples. Details of the experimental protocol and set-up can be found in a previous publication.21 In short, catalyst inks were prepared by dispersing 7.2 mg of catalyst powder in 5.1 ml of N,N-dimethylformamide (≥99.8, Fisher Scientific), followed by sonication in an ice-bath for 50 min. Subsequently, 40 μL of 5% Nafion 117 solution was added to the dispersion (resulting in a Nafion/carbon ratio of ≈1/4 g/g) and the sonication was continued for another 10 min. Finally, 10 μL of ink was drop-cast onto a pre-cleaned glassy carbon electrode (Ø = 5 mm, obtained from Pine Research Instrumentation). The film was dried under an infrared heater for ≈60 min until the solvent was completely evaporated. The resulting catalyst films had a loading of 70–72 μgcat/cm2.
RDE measurements were performed at 20°C in 0.1 M HClO4 in a homemade three-electrode water-jacketed glass cell. 60% HClO4 solution (Guaranteed Reagent, Kanto Chemical) was used to prepare 0.1 M HClO4 solution. Dilution was done with deionized ultrapure water (Milli-Q Integral 5, 18.2 MΩ·cm). Electrochemical measurements were done using an Autolab PGSTAT302N (Metrohm) potentiostat, where linear sweep voltammograms (LSVs) were recorded at 1600 rpm under Ar and O2 saturated electrolyte. ORR activities were determined from anodic scans in pure oxygen saturated electrolyte, whereby the here obtained currents were corrected for their capacitive contribution by subtracting the anodic LSV in Ar saturated electrolyte. The reported potentials are referenced to the reversible hydrogen electrode (RHE) scale and are corrected for the uncompensated solution resistance, which was determined by electrochemical impedance spectroscopy. The apparent activation energy of the ORR was determined for the Fe0.07Zr0.93O1.97 sample by recording LSVs between 10–40°C. In addition, H2O2 quantification from the Fe0.07Zr0.93O1.97 catalyst at different catalyst loadings (30 to 576 μgcat/cm2) was carried out using the RRDE technique, where the platinum ring was held at 1.2 VRHE, while the potential of the disk was swept between 1.0–0.1 VRHE. The collection efficiency of the ring (N) was taken to be −0.255,21 which is influenced by two variables i.e., gap between the ring and disc, and the ring width which in this case are 750 μm and 500 μm, respectively. In our case, these values are constant as the exactly same electrode setup was used for all measurements. Furthermore, the effect of loading variation on collection efficiency is negligible as catalyst-film thickness variation with its loading (30–576 μg/cm2) ranges roughly from 0.8 to 16 μm, which is minor in comparison to the above mentioned variables. The limiting current used in the mass transport correction of geometric currents from Fe-substituted ZrO2 catalysts is calculated by weighted analysis after considering the %H2O2 at 0.1 VRHE (%H2O: 100 – %H2O2) from the ring and assuming a theoretical 4 or 2 e− limiting current (5.6 or 2.8 mA/cm2 at 1600 rpm) as no limiting current is reached. Weighed analysis is performed by adding the current obtained after multiplication of the %H2O2 and %H2O with the respective theoretical limiting currents. A similar procedure is followed for Fe-N-C catalysts from the literature, with the only difference of using measured limiting currents instead of theoretical. On the other hand, for pure Fe and ZrO2 samples we considered only theoretical 2 e− limiting current (2.8 mA/cm2) for the mass transport correction.
Proton exchange membrane fuel cell measurements
An in-house made 5 cm2 active area single-cell PEMFC hardware with single serpentine graphite flow field channels (Fuel Cell Technologies) was used. It was operated with a customized fuel cell test station (G60, Greenlight Innovation), equipped with a Reference 3000 potentiostat/frequency response analyzer (Gamry). MEAs were produced by the decal transfer method. Catalyst inks were prepared by mixing the ink components in the following sequence in an 8 ml HDPE capped bottle containing 20.8 g of 3 mm diameter ZrO2 beads as grinding medium: catalyst, water, 1-propanol (99%, Sigma-Aldrich). The ink was pre-mixed using a roller mixer at 250 rpm for 1 h. Subsequently, the low equivalent weight ionomer in a water-solvent dispersion (Asahi Kasei, 700 EW) was added and the mixing was continued for 18 h at 60 rpm. The water concentration in the inks was 10 wt%, while the solid content and the ionomer-to-carbon weight ratio were 0.03 gcatalyst/mlink and ≈0.75/1.0 g/g, respectively. Thereafter, the ink was coated onto a 50 μm PTFE substrate using a Mayer rod (100 μm wet-film thickness). The electrodes were then dried at room temperature (RT) until complete solvent evaporation. Thereafter, the MEA was assembled by hot pressing (155°C, 3 min, 0.11 kN/cm2) a Nafion 212 membrane (50 μm thickness) between an anode (20 wt% Pt/Vulcan, 100 μgPt/cm2) and cathode (Fe0.07Zr0.93O1.97, 380 μgcat/cm2) decal. The loadings were obtained by weighing the decals before and after hot-pressing.
Finally, the MEA was sandwiched between two gas diffusion layers (GDLs) (29BC, SGL Carbon, Germany) and the cell was assembled using PTFE coated fiberglass subgaskets (Fiberflon, Germany) to adjust a nominal GDL compression of ca. 20%. The ORR activity vs. temperature was measured with H2/O2 (400/400 nccm flows), whereby the total cell pressure was adjusted such that the H2 and O2 partial pressures remained at 100 kPa at a relative humidity of 90%. At each temperature, the cell was equilibrated for 10 min prior to recording a cyclic voltammogram at 10 mV/s. Subsequently, the high frequency resistance (HFR) was determined (at open circuit voltage, AC amplitude: 10 mV) and the cell potentials were corrected to obtain the so-called iR-free potential, using the HFR which ranged between ≈90 mΩ·cm2 (at 100°C) and ≈150 mΩ·cm² (at 40°C). The same procedure was repeated with N2 instead of O2 on the cathode; the so-obtained anodic capacitive currents in H2/N2 were then subtracted from the anodic currents obtained in H2/O2, yielding the here given capacitively corrected ORR currents.
DFT calculations
In order to describe the adsorption of molecular oxygen on ZrO2, we considered the most stable surface of tetragonal t-ZrO2 i.e., the  surface, which is equivalent to the (1 1 1) in the cubic system. As proven by Christensen and Carter,39 this is the lowest energy surface of ZrO2, thus we expect that it is the most exposed surface in our samples. Our structural model consists of a surface slab cleaved from t-ZrO2 bulk at the theoretically determined lattice constants. We included in this slab three oxygen-terminated tri-layers, each with 16 ZrO2 formula units, for a total system of 144 atoms (please see supporting information (SI), Fig. S1a). This model is sufficient to converge the O2 adsorption energy with respect to slab thickness within 20 meV. Moreover, we used a 2 × 2 lateral supercell to ensure a realistic concentration of Fe surface species in the substituted zirconia and to avoid spurious image interactions upon formation of surface oxygen vacancies or adsorption of molecular oxygen. Each tri-layer presents oxygen atoms that points up (toward the electrolyte) and down (toward zirconia bulk), as shown in Fig. S1b and c; both these oxygen-atom types have been considered when modeling oxygen vacancies. All the coordinates of the bottom-most tri-layer (B in Fig. S1a) have been kept fixed at the bulk values during geometry optimizations, while the other two topmost tri-layers (S and SS in Fig. S1a) have been fully relaxed to their minimum-energy structure. Fe-substituted zirconia has been modeled by substitution of one Zr by one Fe atom on the surface (or on the sub-surface tri-layer), for a total Fe content of ≈2 at% with respect to all Zr atoms and of ≈6 at% considering only the surface atoms.
With these structural models, we carried out spin-polarized DFT calculations with the Vienna Ab-Initio Simulation Package (VASP).40 We chose as level of theory the Perdew-Burke-Ernzerhof (PBE)41 exchange-correlation density functional and the on-site Hubbard U-J term for correcting SIE42 associated to Zr and Fe (partially) occupied d states. In particular, as in previous works, we have used the rotationally invariant DFT+U scheme as implemented in VASP with an effective U-J value of 4.0 eV for both Zr and Fe d electrons. This is an average U-J calculated from the values derived via ab initio calculations (Unrestricted-Hartree-Fock embedded cluster) for FeO (Fe(II) U-J = 3.7 eV) and Fe2O3, (Fe(III) U-J = 4.3 eV).43,44 This value has been extensively validated in previous works on defective Fe-containing oxides.45–50 We have chosen the same U-J value for Zr d electrons in order to avoid artificial electronic overlocalization on the transition-metal center with the highest U-J parameter. Moreover, this choice is also consistent with the DFT+U results from recent studies on ZrO2: this U-J value delivers the correct electronic structure of bulk ZrO251 and, besides, it has been shown that adsorption energy of O2 is qualitatively unchanged upon variation of the Zr d U-J value from 0 to 5 eV.52
Nuclei and inner core electrons were replaced by projector augmented wave potentials (PAW) as obtained from the VASP repository. The valence/outer-core electrons that are included in the KS-DFT SCF cycles are listed in parentheses for each atom: Zr (4s2, 4p6, 4d2, and 5s2), O (2s2 and 2p4 with the intermediate core radius PAW potential), C (2s2 and 2p2), Fe (3d6 4s2), and H (1s1). These electronic variables are described via a plane-wave basis set, with a kinetic energy cutoff of 800 eV and a gamma-centered 3 × 3 × 1 k-point mesh. These numerical parameters are required for convergence of the total electronic energies within a threshold of 1 meV per formula unit. Bader's Atom-In-Molecule partial charges53 have been computed within the super-cell-based approach. Oxygen vacancies, O2 adsorption, and OOH species have been considered only on a side on the slab (S in Fig. S1), thus dipole corrections have been applied to avoid long-range polarization from the periodic images along the 'z' direction. Oxygen-vacancy formation energies have been computed in vacuum, while for O2 adsorption and OOH formation energy calculations have been performed considering a PCM-like implicit solvent model for water as implemented in VASP_sol.54
Results and Discussion
Elemental analysis with ICP and TGA
Quantitative analysis was performed to obtain the amount of Fe and Zr (as Fe2O3 and ZrO2) in the carbon-supported catalysts. Table I summarizes the ICP and TGA results. In both Fe0.17Zr0.83O1.91 and Fe0.07Zr0.93O1.97 samples, atomic percent of Fe and Zr are calculated from the ICP quantitative analysis shown in Table I, while the oxygen content is a nominal content calculated based on the amount of Fe. For Fe and ZrO2 samples, it is clearly seen that they do not contain any ZrO2 and Fe, respectively, indicating that the catalyst synthesis did not result in any cross-contamination. It is also observed that in the pure Fe sample (first row) a higher Fe content is found analytically, compared to the nominally expected amount based on the synthesis. This is likely due to the loss of some carbon (likely from the support) during the partial oxidation (PO). This decrease in sample amount further translates into an effective increase in the Fe wt%. In addition, the agreement between the results for 1st and 2nd row of Table I from two different techniques i.e., ICP and TGA, further support their validity. On the other hand, the metal content in ZrO2, Fe0.17Zr0.83O1.91, and Fe0.07Zr0.93O1.97 (2nd, 3rd, and 4th row) is only approximately half of the nominally expected value. This discrepancy is likely due to the carbon produced by decomposition of the Zr precursor, which is significantly larger in comparison to that produced in the Fe sample, since the amount of FePc(t-Bu)4 is ≈70 times lower than the ZrCl2Pc(t-Bu)4. Although the absolute amount of Fe and ZrO2 in Fe0.17Zr0.83O1.91, and Fe0.07Zr0.93O1.97 is 50% of the expected, the atomic ratios between them are still the same as theoretical.
Table I. Nominal (nom.) Fe and Zr content (as oxides) in the carbon supported catalysts samples in comparison to the actual content determine by quantitative analyses via ICP and TGA. SD is the standard deviation calculated for the respective analysis based on the instrumental precision. The oxygen atomic content in the Fe-substituted samples Fe0.17Zr0.83O1.91 [Fe-ZrO2 (1.0 wt%)] and Fe0.07Zr0.93O1.97 [Fe-ZrO2 (0.36 wt%)] is calculated from the analytically quantified metals content, assuming all Fe to present as a solid solution of Fe2O3 in ZrO2, thus forming oxygen vacancies. While Fe-ZrO2 (1.0 wt%) and Fe-ZrO2 (0.36 wt%) is the nomenclature used in our previous paper,27 where wt% represent the nominal Fe content in the catalyst assuming Fe as metal.
| Sample name | Fe as Fe2O3 (nom.) | Zr as ZrO2 (nom.) | Fe2O3 (ICP ± SDICP) | ZrO2 (ICP ± SDICP) | ZrO2 + Fe2O3 (TGA ± SDTGA) |
|---|---|---|---|---|---|
| wt% | wt% | wt% | wt% | wt% | |
| Fe | 0.58 | 0 | 0.95 ± 0.01 | 0 | 1.1 ± 0.1 |
| ZrO2 | 0 | 12.00 | 0.01 ± 0.01 | 5.66 ± 0.06 | 5.7 ± 0.1 |
| Fe0.17Zr0.83O1.91 [Fe-ZrO2 (1.0 wt%)] | 1.41 | 12.00 | 0.73 ± 0.01 | 5.69 ± 0.06 | 6.2 ± 0.1 |
| Fe0.07Zr0.93O1.97 [Fe-ZrO2 (0.36 wt%)] | 0.51 | 12.00 | 0.29 ± 0.01 | 5.77 ± 0.06 | 5.8 ± 0.1 |
| Non-heat treated Fe0.07Zr0.93O1.97 | 0.15 | 3.46 | — | — | 3.6 ± 0.1 |
The last row in Table I shows the analytical results from a non-heat treated Fe0.07Zr0.93O1.97 sample, which served as a reference to determine whether there is any loss of metal precursors before the heat-treatment step. The TGA analysis reveals that the theoretical and actual metal loadings are in very close agreement with each other, which clearly confirms that no precursors were lost until the heat-treatment. On the other hand, we could not completely exclude some loss of precursors during the heat-treatment due to sublimation.
Morphological characterization
XRD characterization of the above samples can be found in a previously published article by Madkikar et al.,27 which clearly indicated the formation of nanometric ZrO2 in all samples. From the broadening of reflexes, a crystallite size of <10 nm was clearly confirmed after comparing the XRD data with our past study.32 From the here conducted TEM image analysis (Fig. 1), it was found that the (number-based) average particle size of ZrO2 in Fe0.17Zr0.83O1.91 and Fe0.07Zr0.93O1.97 is very similar (≈3 nm) (black and red bars in Figs. 1a, 1b). On the other hand, the ZrO2 particle size in pure ZrO2 sample was ≈6.5 nm (yellow bar in Fig. 1c), which is in accordance with our past study on nanometric carbon-supported ZrO2 catalysts.32 The smaller ZrO2 particle size in the samples where Fe is introduced could be a combined effect of increased nucleation rate and/or hindered growth due to crystal strain generated in Fe-substituted ZrO2. These hypotheses are based on the past papers by Leite et al.55 and Chen et al.,56 which also observed that oxide nanoparticles with a dopant (Nb-doped SnO2 and Al-doped ZnO) have smaller particle size than undoped oxide nanoparticles.
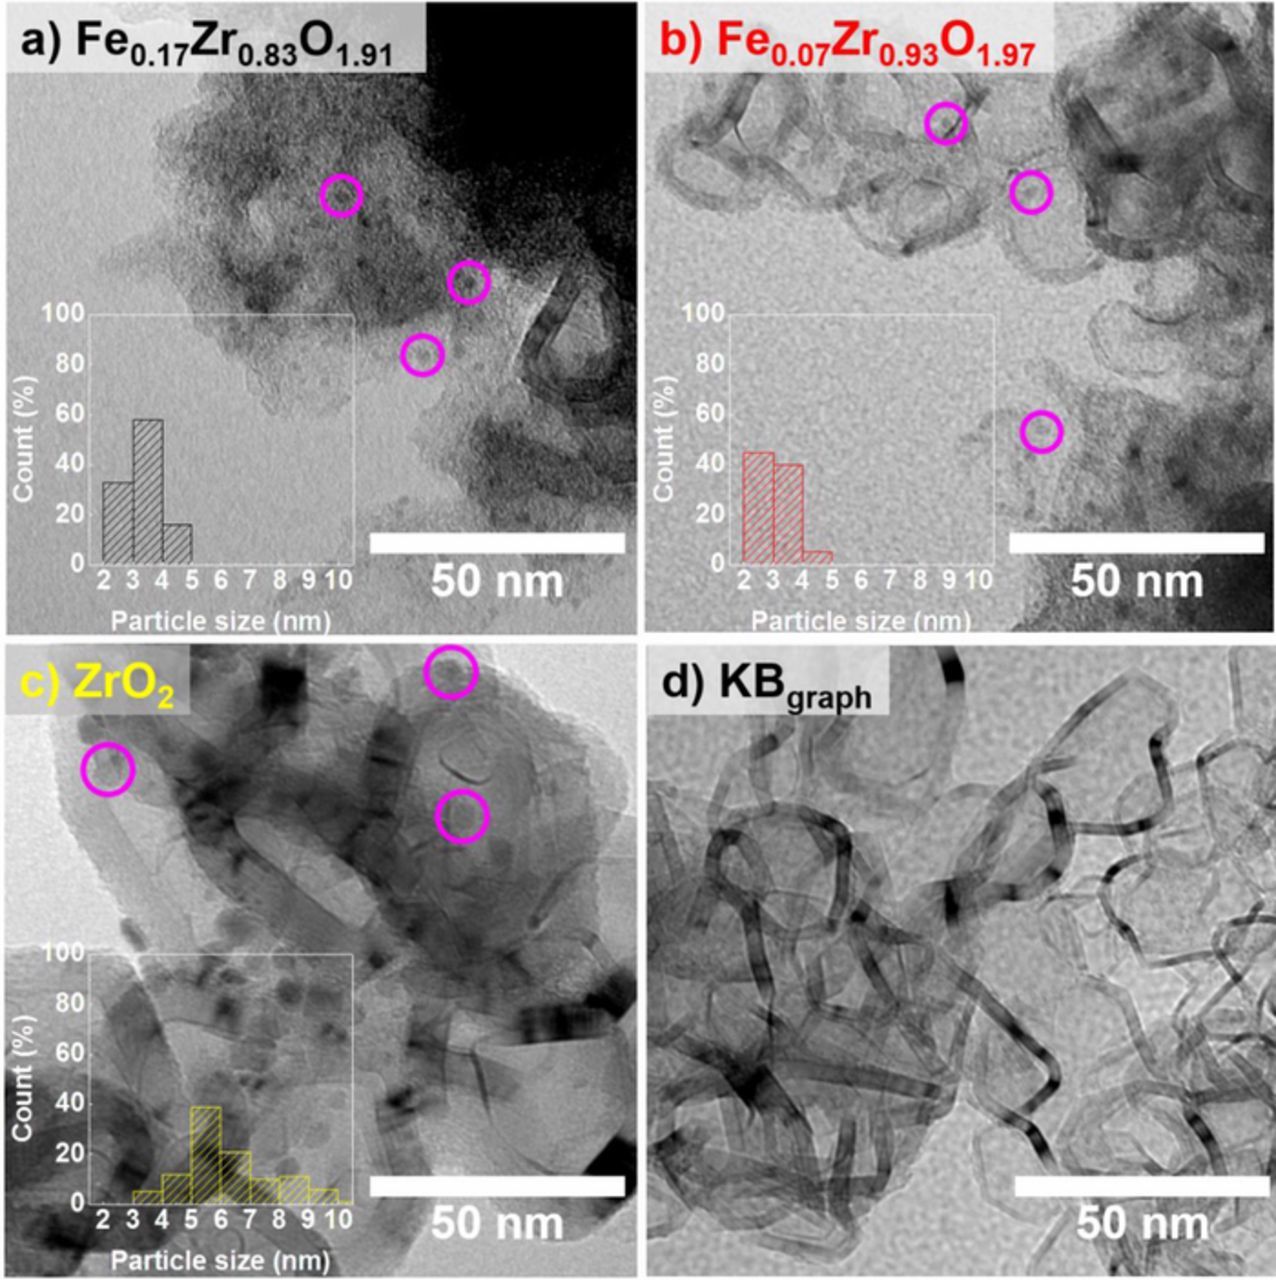
Figure 1. TEM micrographs of KBgraph-supported catalysts along with the histogram depicting ZrO2 particle size distribution in: a) Fe0.17Zr0.83O1.91; b) Fe0.07Zr0.93O1.97; c) ZrO2; and finally the support d) pristine KBgraph. Few catalyst nanoparticles are marked by magenta colored circles for the sake of clarity.
Unveiling Fe coordination
XPS analysis
High-resolution XPS spectra of the Fe 2p region for the Fe0.17Zr0.83O1.91 and Fe0.07Zr0.93O1.97 samples are shown in Fig. 2. Since the signal-to-noise ratio is unfortunately rather low due to the low amount of iron in the samples, reliable deconvolution of the spectra is impossible. Instead, we compare the binding energy of the Fe 2p3/2 signal to known binding energy values of Fe3+, Fe2+, and Fe0 species reported in the literature (cf. green, blue, and brown markers in Fig. 2, respectively).57,58
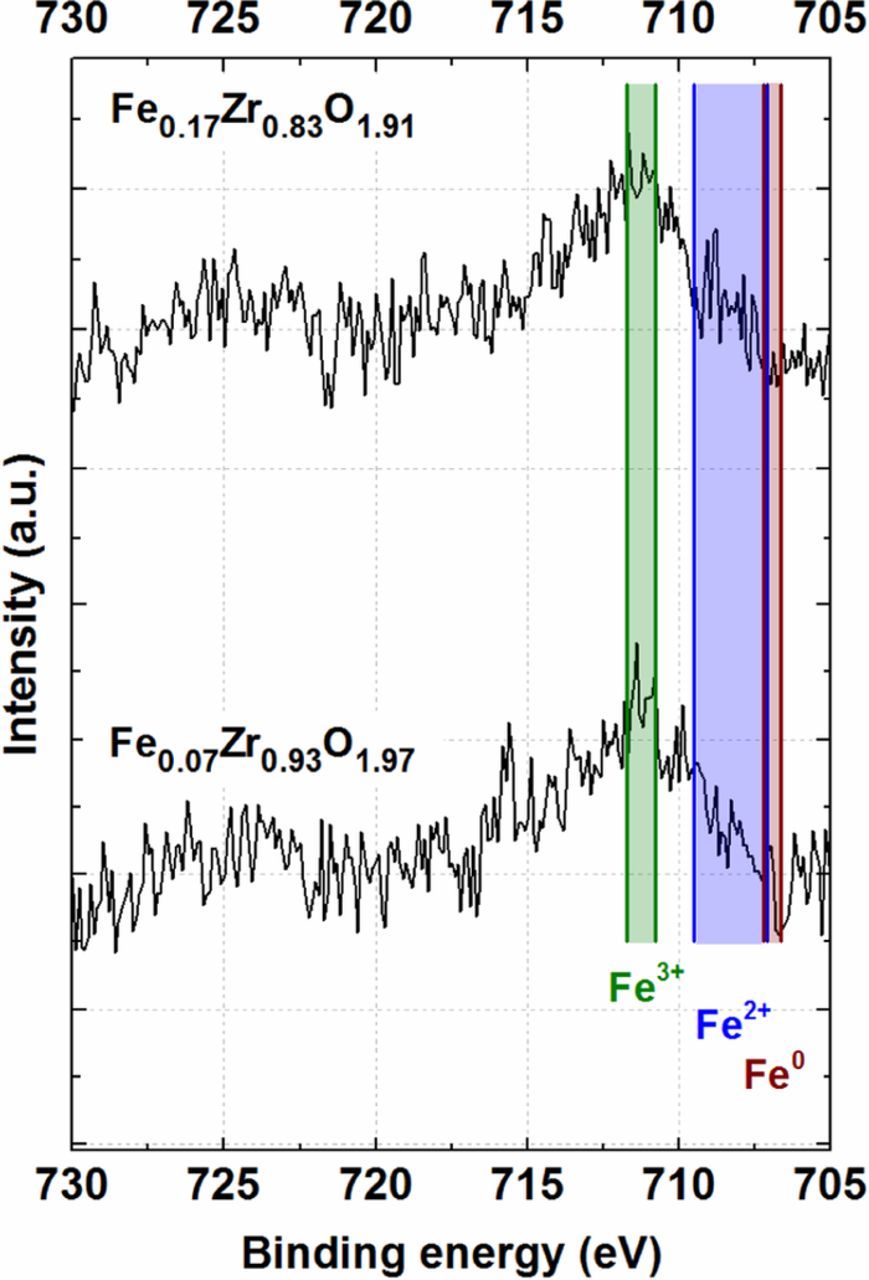
The observed binding energy range for the Fe 2p3/2 signals reveals clearly that the dominant oxidation state of Fe in both samples is 3+ (711.8–710.8 eV, green region).57 Owing to the rather low signal/noise ratio, however, the simultaneous presence of Fe2+ as minor phase cannot be completely ruled out (709.5–707.1 eV, blue region). Metallic Fe (Fe0, 707.2–706.7 eV, brown region) is clearly absent in both catalysts. Additionally, ZrO2 formation was also confirmed (data not shown) by comparing the narrow Zr 3d spectra to a previous study from our group.32
NEXAFS analysis
From Fig. 3 it is evident that the experimental spectra at the Fe L2,3 edges of Fe0.17Zr0.83O1.91 and Fe0.07Zr0.93O1.97 (light and dark blue lines, bottom panel of Fig. 3) closely resemble in shape the simulated multiplet structure of high-spin Fe3+ (bold red line, middle panel). This is further corroborated by the close match of the position of the L3 white-line energy of our experimental spectra with previously-reported Fe in hematite (Fe3+).59 It is also observed that the shapes of the L3 and L2 edge are similar to that of goethite FeO(OH) and hematite α-Fe2O3, where Fe is present as high-spin Fe3+ at ambient temperatures and pressures.60,61 Thus, it can be stated quite unambiguously that Fe exists for the most part as high-spin Fe3+ in both Fe0.17Zr0.83O1.91 and Fe0.07Zr0.93O1.97. Lastly, the pure ZrO2 sample (containing negligibly small amount of Fe, ICP (Table I)) serves as a baseline and confirms the absence of significant amounts of Fe (Fig. 3).
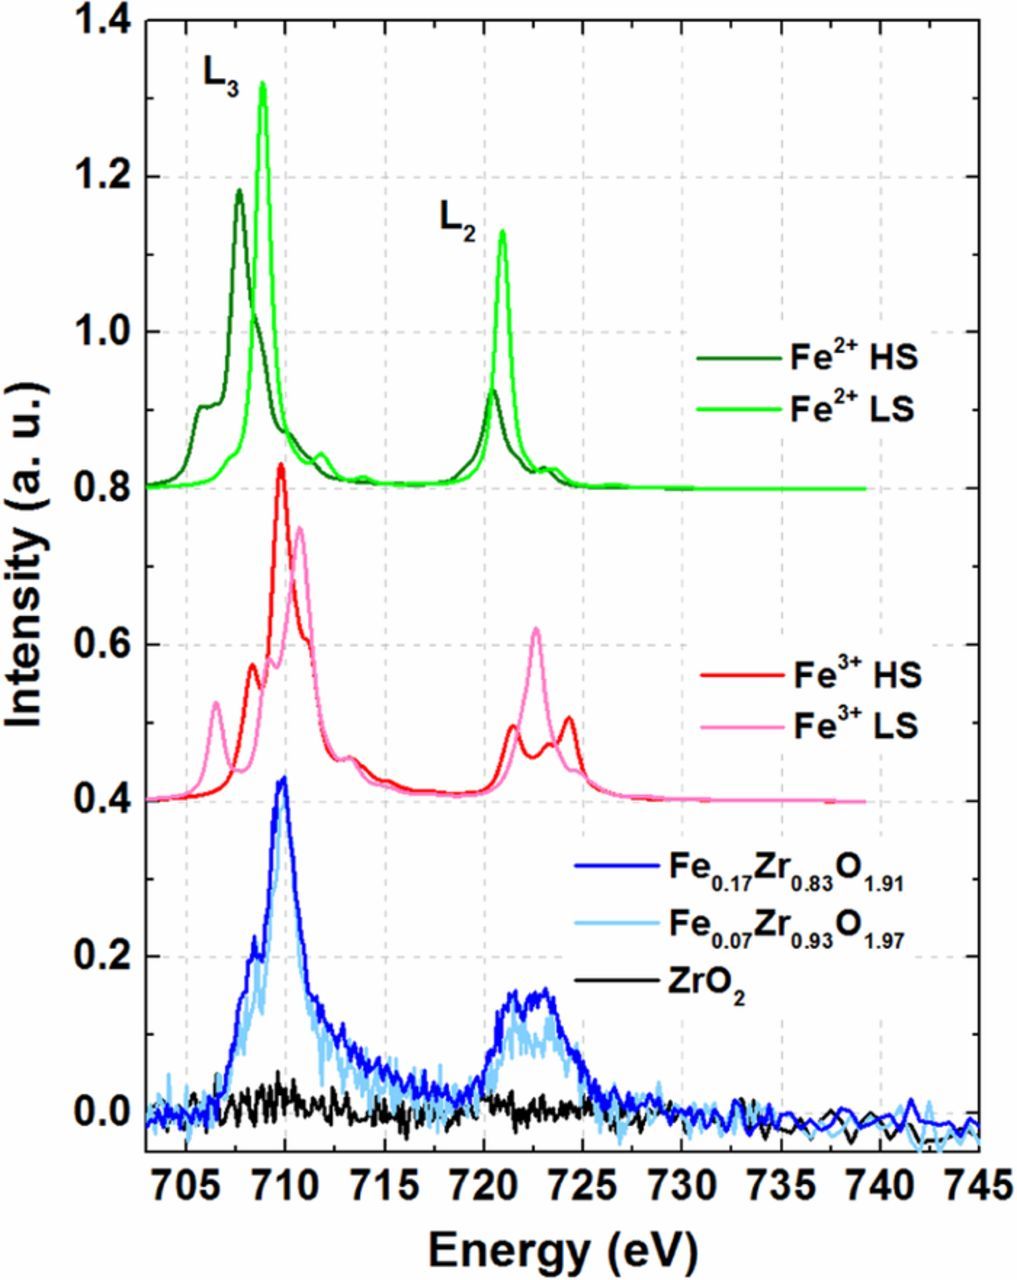
Figure 3. Bottom panel: Room temperature NEXAFS spectra at the Fe L2,3 edge recorded in fluorescence mode for Fe0.17Zr0.83O1.91 (dark blue line), Fe0.07Zr0.93O1.97 (light blue line), and ZrO2 samples (black line). Middle and top panels: multiplet analyses of the different Fe oxidation and spin states (HS = high-spin, LS = low-spin).
Mössbauer analysis
Based on the Mössbauer spectra (Fig. 4), only one type of Fe is present in the Fe0.17Zr0.83O1.91 and Fe0.07Zr0.93O1.97 catalysts (top and middle panel). The isomer shift (δ) and quadrupole splitting (QS) of the primary doublet are 0.5 and 1.0 mm/s, respectively. These values indicate that Fe is present in high-spin isolated Fe3+ state.62 The δ and QS of the secondary doublet also fits to the previous assignment. In addition, some paramagnetic relaxation related to the same Fe3+ are also identified. On the contrary, Mössbauer spectra of the catalyst sample containing only iron (denoted as Fe) looks completely different (bottom panel in Fig. 4).
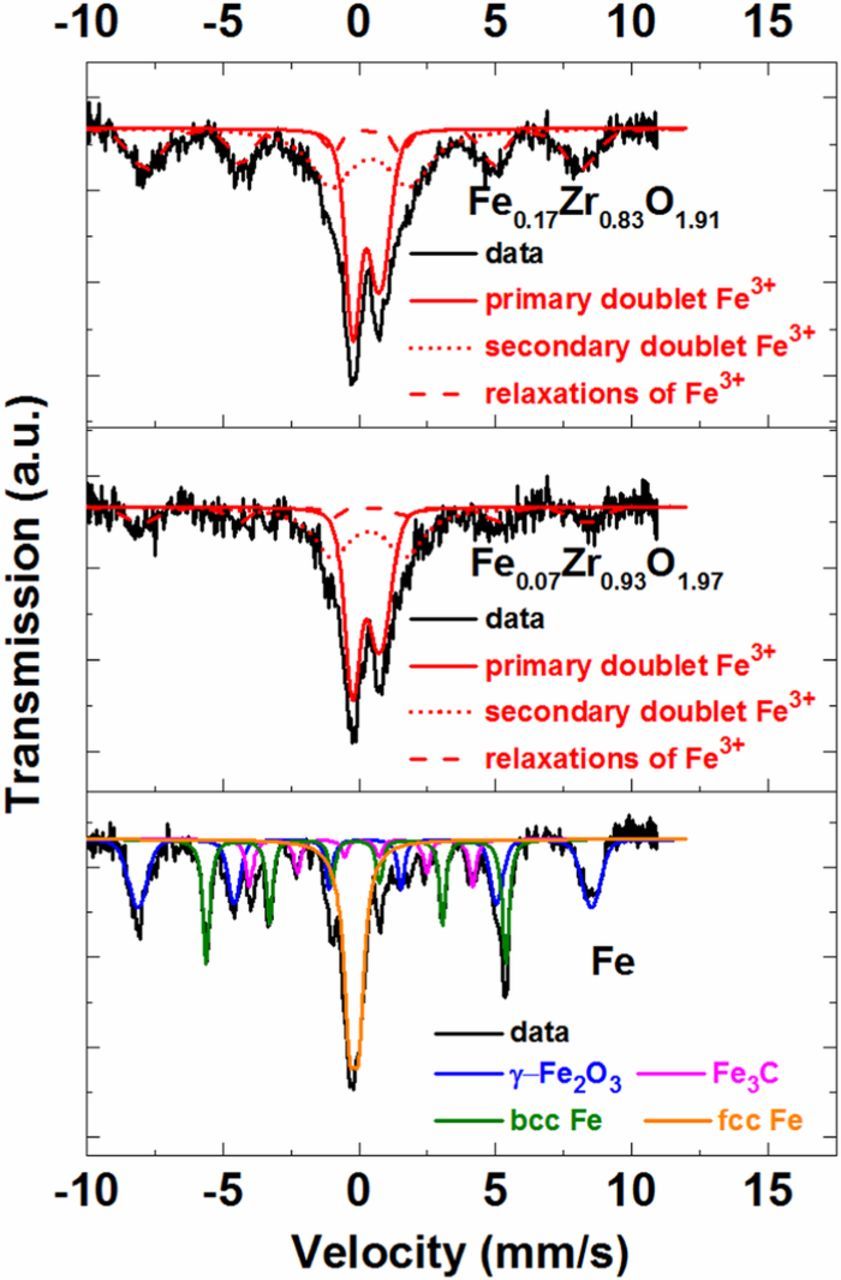
Figure 4. 57Fe Mössbauer spectra of the Fe0.17Zr0.83O1.91, Fe0.07Zr0.93O1.97, and Fe catalysts measured at 4.2 K. The Fe oxidation state and the various phases are also depicted in each spectra. Secondary doublets and paramagnetic relaxations of Fe3+ are observed only in Fe0.17Zr0.83O1.91 and Fe0.07Zr0.93O1.97.
In this case, three phases, viz., metallic Fe (bcc and fcc), along with γ-Fe2O3 and Fe3C are identified, while isolated Fe3+ is not detected. This clearly indicates that the formation of metallic Fe, iron carbide, and iron oxide is hindered when ZrO2 is present. The finding that iron is present for the most part in form of isolated Fe3+ in our Fe0.17Zr0.83O1.91 and Fe0.07Zr0.93O1.97 catalysts can be compared to reports in the literature, for which iron in the active sites of Fe-N-C catalysts is mainly in the Fe2+ oxidation state.63–65 Thus, since we do not detect any Fe2+ in our NEXAFS and in our XPS analysis, we can exclude the presence of ORR active Fe-N-C moieties in our Fe0.17Zr0.83O1.91 and Fe0.07Zr0.93O1.97 catalysts. The high-spin state of Fe3+, evident in NEXAFS data, indicates that Fe is likely coordinated by oxygen, typically observed for this spin configuration.60,61 On the other hand, from the Mössbauer analysis we observe only isolated Fe3+. Combining these two observations, we can conclude that Fe3+ substitutes Zr4+ in the ZrO2 structure, forming the solid solution FexZr1−xO2−δ.
Oxidation state of Fe from DFT
Sangalli et al.26 have reported the presence of Fe as Fe3+ in the bulk of Fe-substituted ZrO2 (oxide phase, tetragonal). We have studied here the electronic structure of the material considering Fe as substituent at the catalyst surface. First, the computed energy difference between the slabs containing Fe in the surface and subsurface positions (E(Fe-ZrO2_S) − E(Fe-ZrO2_SS) = −2.4 eV) indicates that Fe is likely to be found at the topmost atom layer, i.e., at the surface of the FexZr1−xO2−δ catalyst. The computed atomic magnetic moment of the Fe atom (4.17 μB, thus more than four unpaired electrons in Fe66) and the projected density of states (PDOS) (Fig. S2 in the SI) provide further evidence of a high-spin 3+ state for the Fe atom at the catalyst surface, with a full occupation (d5) of d states in the α channel (spin-up) and no occupation of d states in the β channel (spin-down).
R(R)DE data at various catalyst loadings
In the following, we compare the ORR activity of our catalysts by comparing the potential at a fixed current (EiR-free @ −1 A/gcat) at which the faradaic current is 3–5 times higher than the capacitive current but still <5% of the diffusion limited current. This implies capacitive correction errors will be small and oxygen transport resistances are negligible at our chosen mass-specific reference current of −1 A/gcat.
Determination of ORR currents is always performed after subtraction of the capacitive current contribution (measured in Ar-saturated electrolyte) from the overall currents measured in oxygen-saturated solution (Fig. 5a). Clearly, Fe0.17Zr0.83O1.91 and Fe0.07Zr0.93O1.97 are much more active than the catalysts containing only Fe or ZrO2 (Fig. 5a, inset). In addition, we would also like to mention that the difference in the activity between ZrO2 and Fe0.07Zr0.93O1.97 does not originate from the difference in particle sizes (Fig. S6). This undoubtedly indicates a strong synergism between Fe and ZrO2. It should be also noted that, since Fe is confirmed to be in Fe3+ oxidation state (see above), it is assumed that Fe is present as Fe2O3 for the ease of quantification. In addition, from our previous work, we concluded that the optimum ORR activity lies between 0.3–0.75 wt% Fe2O3 (7–17 at% Fe).27 However, based on durability considerations, we decided to use the catalyst with lowest amount of Fe (i.e., 0.3 wt% Fe2O3 (7 at% Fe) ≡ Fe0.07Zr0.93O1.97) as a benchmark catalyst for further analyses and characterizations. This is because Fe could be leached from the catalyst in the strongly acidic environment of a PEMFC. These liberated iron cations cannot only replace protons in the electrode layer and in the membrane, but can also act as Fenton's reagent which leads to the decomposition of locally formed hydrogen peroxide to hydroxyl and hydroperoxyl radicals which lead to membrane degradation and are thus detrimental to PEMFC long-term performance.67,68
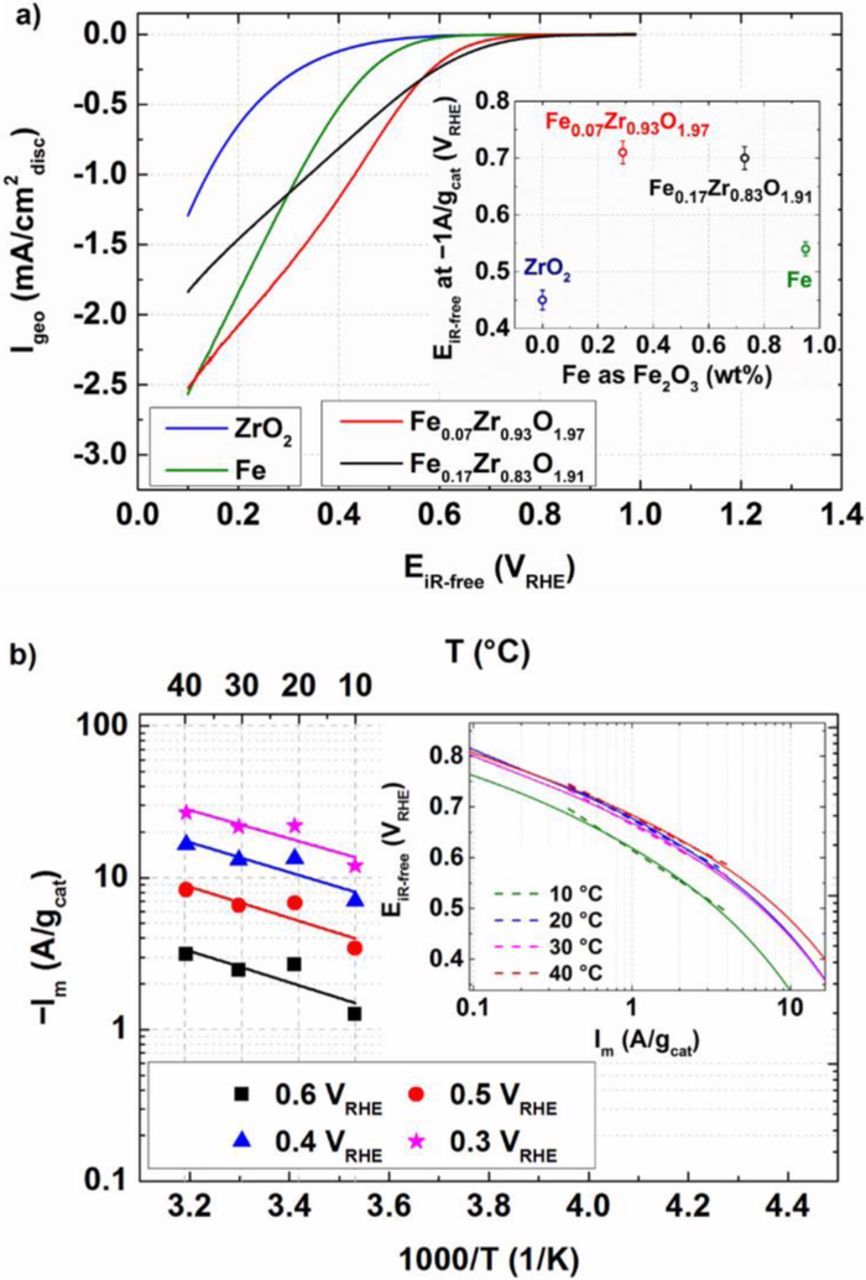
Figure 5. a) Capacitively corrected geometric (disc) currents of the depicted samples with respect to iR-free potential (EiR-free in VRHE). Data collected in a TF-RDE setup in 0.1 M HClO4 at 1600 rpm, 5 mV/s (anodic scans), and 20°C. Inset: EiR-free in VRHE at −1 A/gcat as function of Fe amount (on the basis of Fe2O3) for the carbon-supported catalysts specific in Table I; b) ORR activities of Fe0.07Zr0.93O1.97 measured at constant cathode potentials in a TF-RDE at various temperatures (T = 10–40°C) in 0.1 M HClO4 at 1600 rpm, 5 mV/s. Inset: Tafel plot (EiR-free vs. −Im) of Fe0.07Zr0.93O1.97 (10–40°C), where dashed lines represent the linear regression used to calculate Tafel slopes. Oxygen transport resistance correction was calculated as described in the experimental section.
From our DFT-based results, the much higher mass activity of Fe-substituted ZrO2 with respect to ZrO2 can be ascribed to the different surface patterns and, hence, potential oxygen (intermediate) adsorption sites. Besides surface Zr and Zr/Fe atoms in pure and Fe-substituted ZrO2, respectively, we must consider the presence of oxygen vacancies (VO). In pure ZrO2, the concentration of VO is very small, since the oxygen vacancy formation energy (ΔEform) both in the bulk69 and in the surface51,70 is quite high. It is well known that ΔEform can be dramatically decreased, and hence, VO can be increased by aliovalent substitution of Zr4+ cations with trivalent species like Y, La, or Al.71,72 While Sangalli et al. have studied oxygen vacancies in bulk Fe-substituted ZrO2,26 we focus here on surface vacancies, due to their possible implication on the ORR catalysis. As detailed in Fig. S3 and Table S1 of the SI, the presence of Fe atoms dramatically decreases ΔEform. For any possible surface vacancy position in ZrO2, ΔEform ranges between 5.6 and 5.9 eV, while in Fe-substituted ZrO2 ΔEform decreases to a value between 0.07 and 0.8 eV. It is noteworthy here that ΔEform decreases not only for the generation of oxygen vacancies which are directly linked to Fe (along Fe-O-Zr bonds), but also for the other Zr-O-Zr bonds along the surface slab. This effect arises from the strong hybridization of Fe d-eg states and O p states, which significantly lowers ΔEform by allowing the convenient delocalization of the extra charge (2 e− left by the leaving oxygen atom) onto the O sublattice (Table S1 in SI).73 This is also a further indication that, different from pure ZrO2 where vacancies induce the formation of Zr3+ centers, Fe exists mainly as Fe3+ without a formal reduction to Fe2+ in Fe-substituted ZrO2.
Fig. 5b shows mass activities at 0.3, 0.4, 0.5, and 0.6 VRHE as a function of temperature in an Arrhenius representation. Via a linear regression, the activation energy (Eact) was determined and is reported in the last part of this manuscript. A Tafel analysis (Fig. 5b, inset) of the Fe0.07Zr0.93O1.97 catalyst in the range of ≈0.4–4 A/gcat reveals a Tafel slope (TS) between 200–160 mV/decade (from 10–40°C). These TS values are slightly lower compared to pure ZrO2 based catalysts (180–210 mV/decade), which were reported in an extensive study by Mittermeier et al.21
The influence of catalyst loading on H2O2 yield and the apparent mass activity of the Fe0.07Zr0.93O1.97 catalyst was also investigated by RRDE. Four catalyst loadings were tested (30, 72, 288, and 576 μg/cm2) and the H2O2 yield at each loading was evaluated (Fig. 6). The loadings were selected such that the difference between consecutive loadings should be at least a factor of two, with the lowest and highest loading differing by a factor of ≈20. Peroxide yield is only shown within the potential window where a meaningful signal-to-noise ratio is obtained, i.e., where capacitive corrections to the disk currents were small (see above). It is readily observed that an increase in the catalyst loading is accompanied by a decrease of the H2O2 yield.
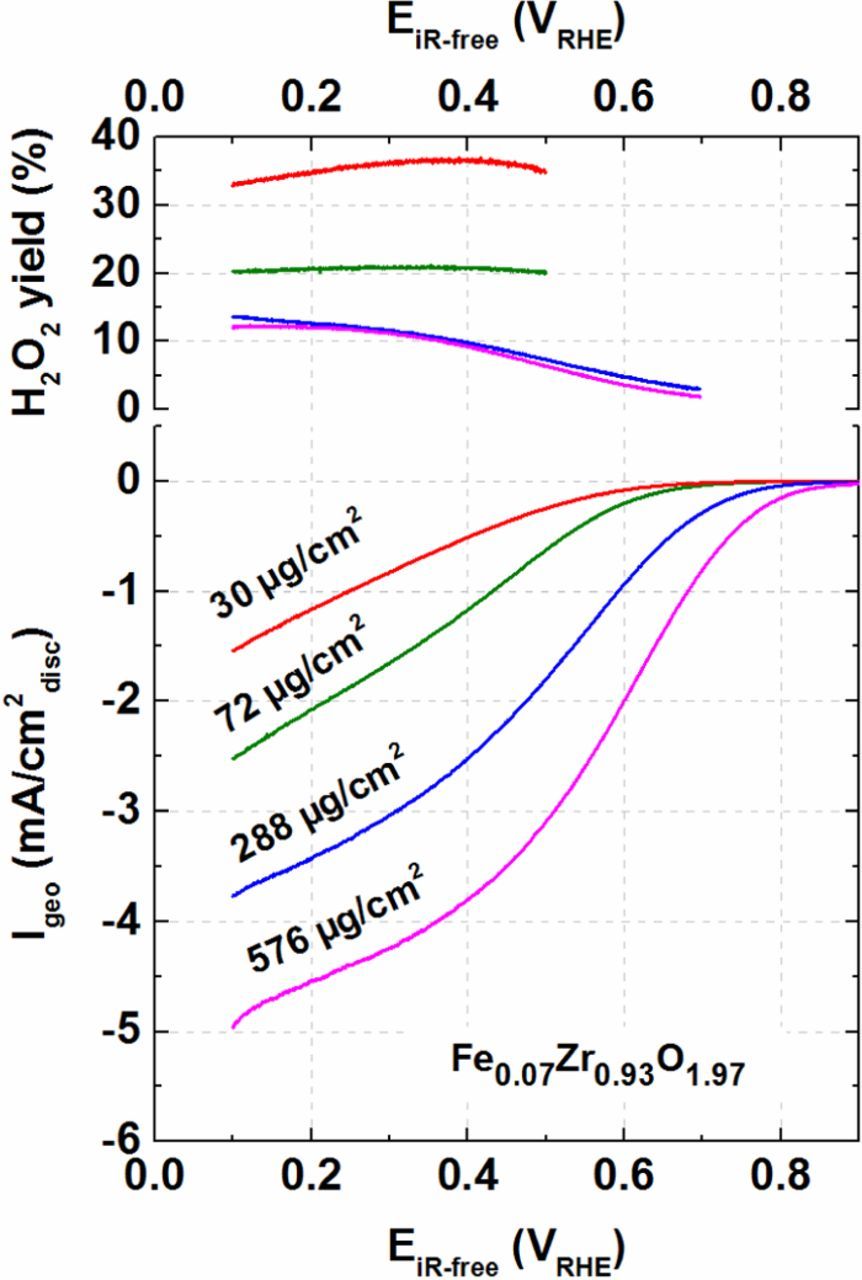
Figure 6. Upper panel: RRDE-derived H2O2 yield vs. potential for different loadings of the carbon-supported Fe0.07Zr0.93O1.97 catalyst. Lower panel: disk current versus potential for different catalyst loadings. Shown are the data for anodic scans at 5 mV/s (capacitively corrected) in O2 saturated 0.1 M HClO4 at 20°C and 1600 rpm. The collection efficiency (N) of the ring (potentiostated at 1.2 VRHE) is taken to be −0.255.21
At the lowest loading of 30 μg/cm2, the fraction of oxygen being reduced to hydrogen peroxide amounts to ≈37%, while at the highest loading of 576 μg/cm2 it decreases to <10%. Bonakdarpour et al.74 and Muthukrishnan et al.75 have reported a similar trend for Fe-N-C type catalysts. It is also worth mentioning that, for similar loadings, the H2O2 yield from Fe0.07Zr0.93O1.97 is approximately half compared to the Fe-N-C catalysts in the study by Bonakdarpour et al.74 When compared to pure ZrO2 catalysts which produce mainly peroxide, it is hypothesized that Fe0.07Zr0.93O1.97 has two sites for the ORR:21 ZrO2 producing mainly H2O2, while Fe and/or oxygen vacancies convert the generated H2O2 to H2O. This hypothesis is underpinned by the fact that the H2O2 yield decreases with increasing catalyst layer thickness, i.e., as the residence time of generated H2O2 within the catalyst layer increases, providing more time for H2O2 decomposition inside the layer.
Another interesting point to discuss here is that when the ORR mass activities of Fe0.07Zr0.93O1.97 are compared for different loadings (30–576 μg/cm2), an increase in mass activity (≈2.3 times at 0.65 VRHE) for thick films (576 μg/cm2) is observed (Fig. 7). When a similar analysis is being performed on the data for the Fe-N-C catalyst by Bonakdarpour et al., a mass activity increase of ≈2.4 times at 0.65 VRHE can be noted when the loading is increased from 80 and 400 μg/cm2.74 It is worthwhile to mention that we performed the above analysis at a potential greater than half-wave potential (0.65 VRHE) to avoid the use of high measured currents, which would introduce significant artefacts. The origin of these artefacts is the possible total consumption of oxygen in part of the catalyst layer at high currents, since, due to its tortuosity and porosity, the oxygen diffusion in the catalyst layer is much slower than in solution.
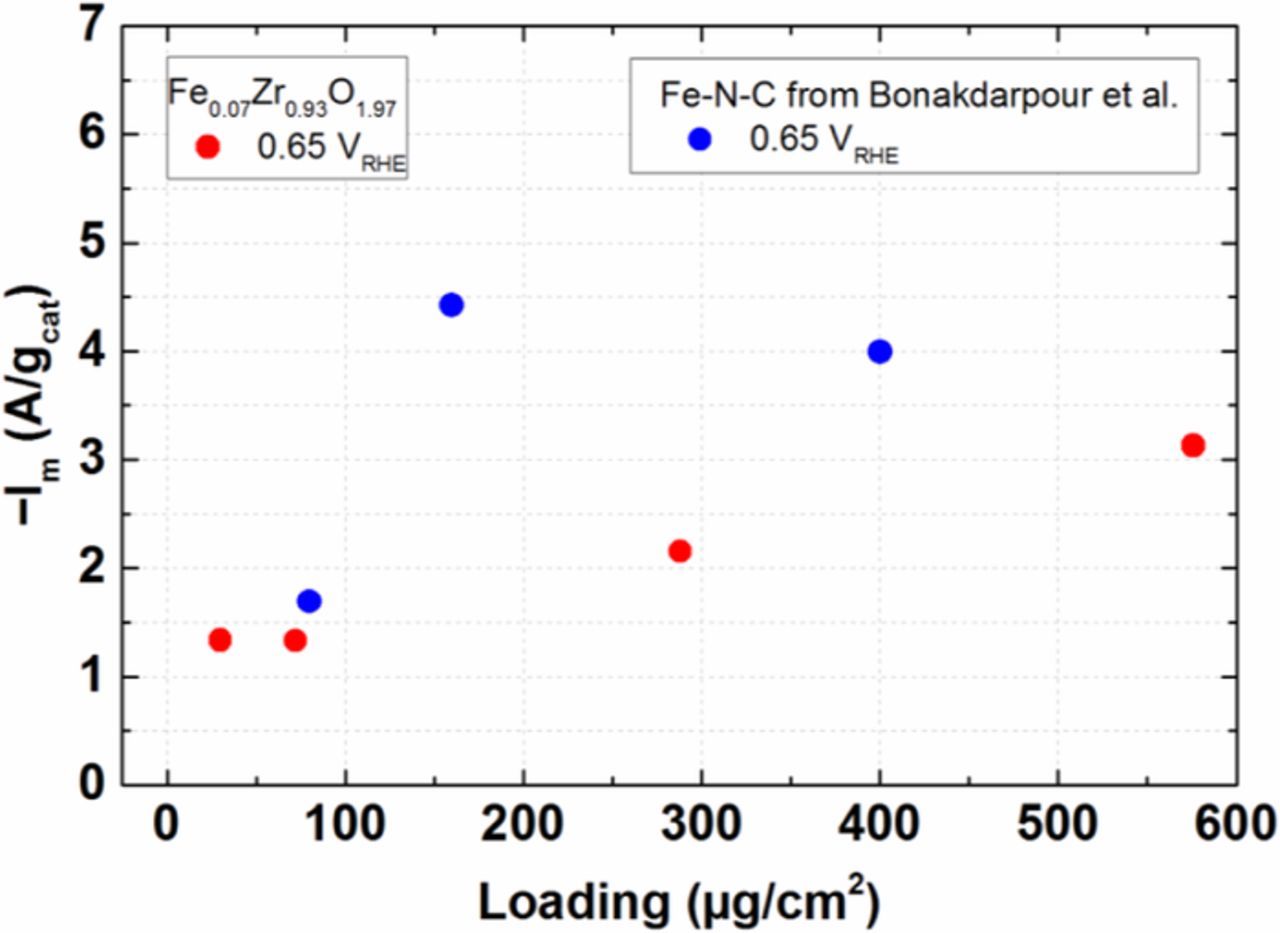
Figure 7. Comparison of the RDE-derived ORR mass activity of Fe-N-C (blue symbol, extracted from Ref. 74) and Fe0.07Zr0.93O1.97 (red symbol) catalysts at 0.65 VRHE as a function of catalyst loadings on the disk electrode. Im for Fe-N-C74 and Fe0.07Zr0.93O1.97 catalyst; Im is extracted by mass-transport correcting the measured current calculated as described in the experimental section.
This increase of the mass activity of PGM-free catalysts with film thickness is counter-intuitive if compared to Pt-based catalysts, where the mass activity would decrease with increasing catalyst layer thickness due to mass transport limitations.76,77 Together with the lower hydrogen peroxide yield observed at higher electrode loadings (equivalent to a higher number of electrons utilized per O2 molecule), this behavior may be characteristic for ORR catalysts which primarily reduce oxygen to hydrogen peroxide, but at the same time catalyze the chemical decomposition of hydrogen peroxide to O2 and H2O.21,74
Nature of active sites from DFT study
In order to elucidate the origin of the different products obtained with pure ZrO2 and Fe-substituted ZrO2 (defective and non-defective), we have considered adsorption of O2 on all possible catalytic active sites for both materials. In non-defective ZrO2, we consider only Zr sites due to the very low concentration of VO expected from the high ΔEform value (see Table S1 (SI)). In Fe-substituted ZrO2, we have considered Fe and Zr and non-equivalent Fe-VO-Zr and Zr-VO-Zr, which present a very low ΔEform and are likely to occur under operating conditions. As shown in Table S2 (SI), O2 adsorbs weakly on top of Zr atoms both in non-defective pure and Fe-substituted ZrO2 with a negligible associated surface-molecule charge transfer. Without oxygen vacancies, O2 is not expected to be adsorbed on top of Fe atoms in non-defective Fe-substituted ZrO2. Regarding defective Fe-ZrO2, O2 adsorption is favored on either Fe-VO-Zr or Zr-VO-Zr, due to a direct charge transfer from the reduced surface to O2 antibonding orbitals, which results in stable bridge-like peroxide/superoxide species (Fig. S4b, c, and d in the SI). We must note that only for molecular oxygen adsorption on the Fe-VO-Zr we obtain an overall favorable energy balance (i.e., negative enthalpy) for the two subsequent processes of oxygen vacancy formation and O2 adsorption (data listed in Table S2 in the SI). Such low affinity of ZrO2 for O2 and, on the other hand, the convenient adsorption of O2 on the easily-formed oxygen vacancies in Fe:ZrO2 represent the first step and a necessary condition for a much higher ORR activity of Fe-doped zirconia.
On these stable species, we have considered the two proton-coupled electron transfer (PCET) steps of the ORR, leading to the formation of H2O2 or H2O via a first *OOH intermediate. In pristine zirconia, where VO are difficult to form, our calculations predict a stable Zr-bound *OOH species (Fig. 8a). On the other hand, by considering the active sites made by the formation of different oxygen vacancies created around a Fe cation, our results show the formation of both a stable *OOH species (Fig. 8b) and a dissociated intermediate made of *OH and *O species (Fig. 8c). This dissociation does not occur for Zr-VO-Zr sites in Fe-substituted ZrO2 (Fig. 8d).
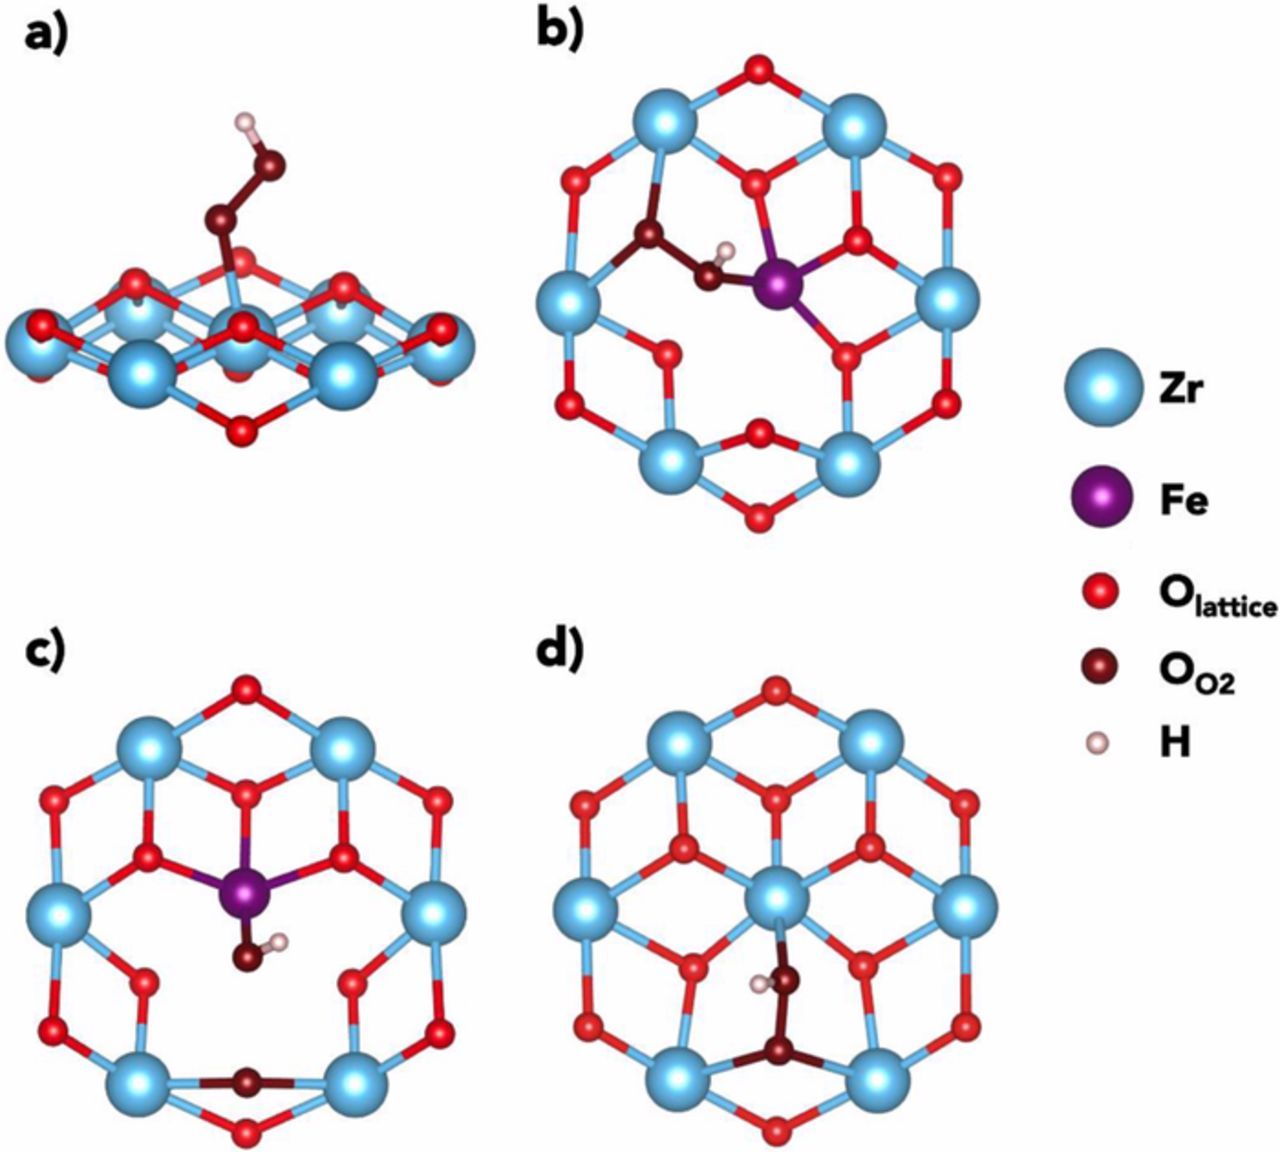
Figure 8. a) Lateral view of *OOH species on Zr sites in pure non-defective ZrO2. Surface sites in Fe-substituted ZrO2: b) top view of *OOH species on Fe-VO-Zr vacancies; c) top view of *OOH species, dissociated as *OH + *O on Fe-VO-Zr vacancies; d) top view of *OOH species on Zr-VO-Zr vacancies. Only neighbors and next-neighboring atoms to the active sites are shown for the ease of viewing.
The species in Fig. 8c can conveniently form only water after the second PCET step, because the oxygen-oxygen bond has already been dissociated in the first PCET. When the *OOH species is stable, the second protonation step can lead to H2O2, if the second proton goes to the un-protonated oxygen atom, or to H2O via the dissociation of the oxygen-oxygen bond and the formation of a surface bound *O species. We computed the total energy variations related to the reactions R1 and R2 for each catalytic site (CS) surveyed:
![Equation ([R1])](https://content.cld.iop.org/journals/1945-7111/166/7/F3032/revision1/d0002.gif)
![Equation ([R2])](https://content.cld.iop.org/journals/1945-7111/166/7/F3032/revision1/d0003.gif)
considering the equivalence, at zero applied bias, between the energy of the proton-electron couple and half the energy of molecular hydrogen (H+ + e− ⇆ ½ H2) as in the theoretical standard hydrogen approach.78 Thus, in the calculation of energy variations for the R1 and R2 reactions the term E(H+ + e−) has been substituted by ½ E(H2). The aim of these energy variations is to assess the intrinsic thermodynamic balance between R1 and R2 for the catalysts under study at the different CS conditions. The computed energy landscape is shown in Fig. 9.
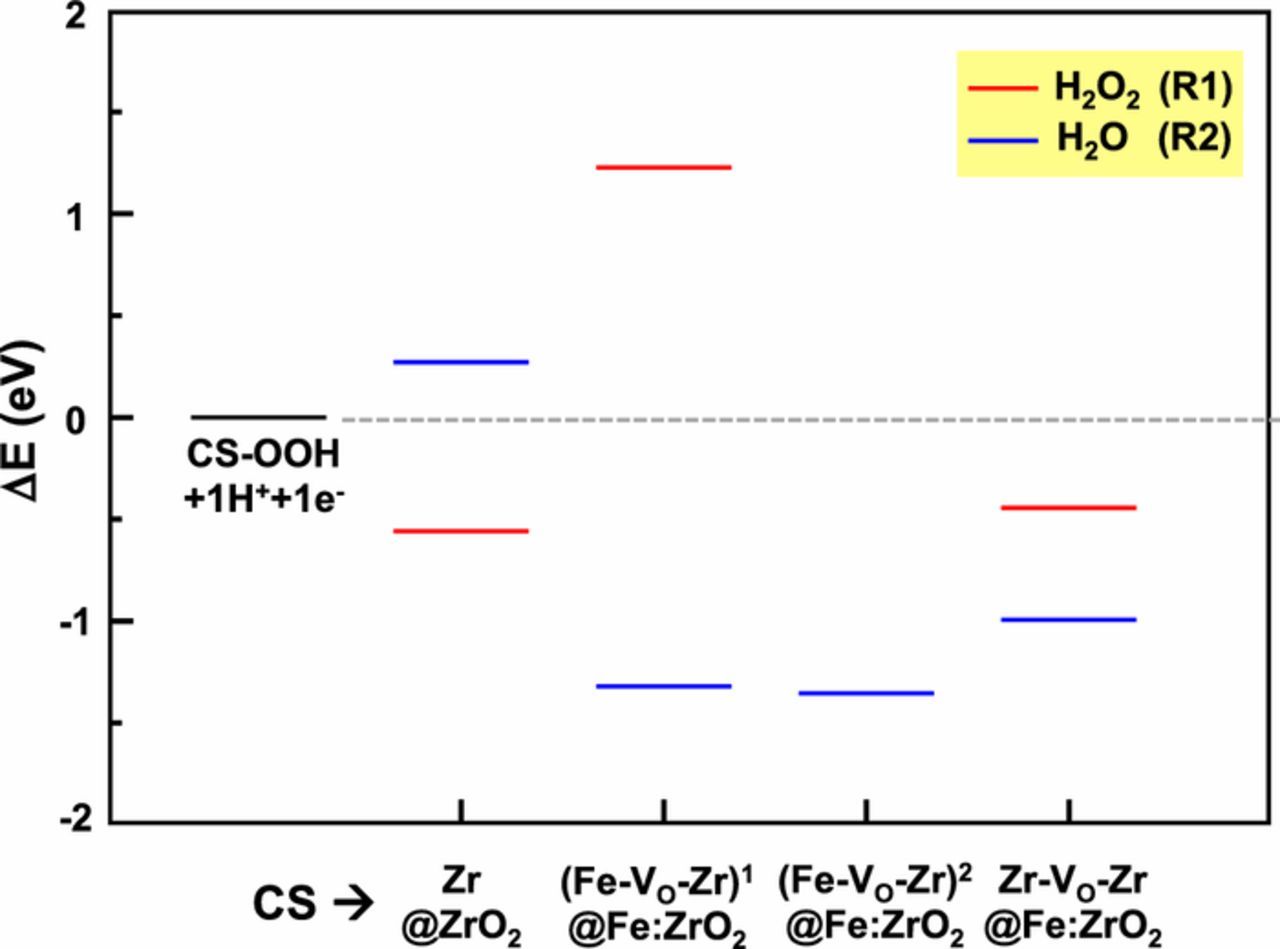
Figure 9. Total energy variation (in eV) for reactions R1 and R2 (second PCET step of the oxygen reduction reaction) considering the two possible products, i.e., H2O2 (red lines) and H2O (blue lines) for each catalytic site (CS). The reactions are computed in water via the PCM-like implicit solvation scheme; the energy of the proton-electron couple is considered to be equal to half the energy of H2. Negative values correspond to thermodynamically favorable process.
From these energies, we can discern whether the formation of H2O2 (R1, red lines in Fig. 9) or H2O (R2, blue lines in Fig. 9) is preferred on each catalytic site. Negative/positive energy variations (below/above the reference gray line in Fig. 9) correspond to thermodynamically favorable/unfavorable processes. We must note here that these energy variations can only assess the selectivity toward the final products at a given CS, but they are not sufficient to quantitatively assess the overall different activities of the two catalysts.
According to these results, pure defective ZrO2 leads mainly to H2O2 production, which is in agreement with our previous findings with Fe-free ZrO2/C catalysts.21 On the other hand, in Fe-substituted ZrO2 all oxygen vacancies around Fe will lead to a strong preference for the formation of H2O, while at these active sites the formation of H2O2 is unfavorable. A lower amount of H2O2 production in Fe-substituted ZrO2 is to be ascribed to oxygen vacancy active sites in the proximity of Zr atoms. This is in agreement with the experimental selectivity data from RRDE (see Fig. 6), where we observe higher production of H2O even at the lowest loading in Fe-substituted ZrO2 compared to pure ZrO2, but still together with H2O2.
PEMFC measurements
Fig. 10a depicts the measured geometric currents (Igeo) recorded in anodic scans (at 10 mV/s) in H2/O2 configuration in a 5 cm2 active area single-cell PEMFC for the Fe0.07Zr0.93O1.97 catalyst (solid lines) vs. HFR-corrected potential (EiR-free). These data are not corrected for the capacitive contribution (measured in N2), since it is very small over the relevant potential window between 0.1–0.7 V (see black solid line in Fig. 10a). Furthermore, a closer inspection of the H2/N2 data shows that Fe0.07Zr0.93O1.97 does not seem to catalyze the hydrogen oxidation in this potential range, as is evident from the absence of oxidative currents for cross-over H2 (i.e., H2 permeating from the anode to the cathode compartment). The oxidative currents are <0.5 mA/cm2, while typical Pt/C cathode catalysts would show an oxidative current in the range of a few mA/cm2 depending on the pressure, temperature, and relative humidity.79 After comparison of Igeo and Im (capacitively corrected, dotted lines in Figs. 10a, 10b taken from Ref. 21), we can conclude that the Fe0.07Zr0.93O1.97 is clearly more active than the Fe-free ZrO2 catalyst from our past study,21 as one would have already expected from the published RDE data.21
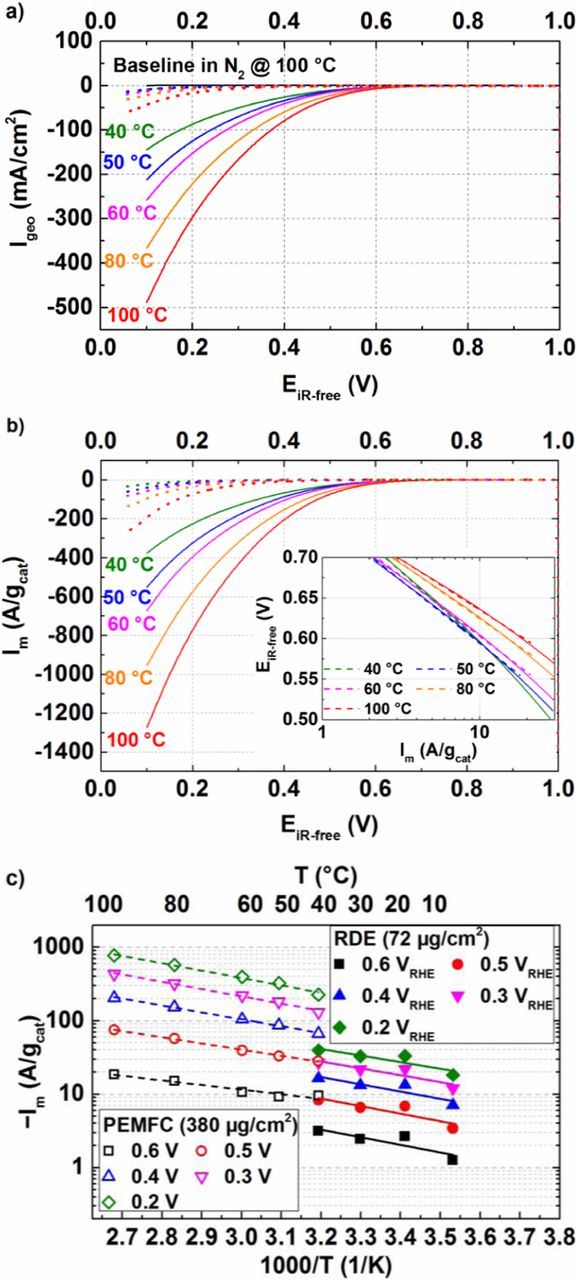
Figure 10. a) H2/O2 (400/400 nccm) polarization curves for the carbon-supported Fe0.07Zr0.93O1.97 (solid lines) and the Fe-free ZrO2 catalysts (dotted lines, taken from Ref. 21) in 5 cm2 active area single-cell PEMFCs at various temperatures (color coded), 90% RH, and 100 kPa gas partial pressure (absolute pressure varying with temperature due to the changing water partial pressure). The cathode and anode loadings were 380 μgcat/cm² and 100 μgPt/cm2, respectively; b) Capacitively corrected and mass normalized polarization curve vs. the HFR-corrected cell voltage (EiR-free) for the Fe0.07Zr0.93O1.97 (solid lines) and the Fe-free ZrO2 catalysts (dotted lines, taken from Ref. 21) at 40, 50, 60, 80, and 100°C (Inset: Tafel analysis); c) Arrhenius representation for the Fe0.07Zr0.93O1.97 catalyst at various iR-free electrode potentials from RDE and PEMFC data.
Fig. 10b inset depicts the Tafel analysis for mass-specific ORR currents from Fe0.07Zr0.93O1.97 between 40–100°C determined between ca. 2–20 A/gcat. The Tafel analysis yields TS values of 170–130 mV/decade, which are slightly lower than those determined by TF-RDE measurements. From this data, the mass activity at any given iR-free potential is extracted and compared in Fig. 10c for PEMFC and RDE measurements in an Arrhenius type representation. At first glance, it is easily observed that the mass activities determined from PEMFC measurements are higher compared to the ones obtained from RDE measurements. When compared at same temperature of 40°C, Im from the PEMFC measurement is ≈3-fold higher compared to the RDE results at a potential of 0.6 ViR-free (black symbols); this factor increases to ≈5-fold as the potential decreases to 0.2 ViR-free (green symbols). From Fig. 7, an estimate of the difference in mass activity with respect to the catalyst loading, i.e., between 72 μg/cm2 (in RDE) and 380 μg/cm2 (in PEMFC) can be obtained and would be around 1.8 times at 0.65 ViR-free. However, the RRDE analysis reported in Fig. 7 was performed at 20°C, while the above PEMFC and RDE data are compared at 40°C. Thus to confirm whether there is any additional increase in mass activity at higher temperature for a thicker film, a further RDE measurement was performed at 40°C with a higher catalyst layer loading of 576 μg/cm2. Fig. 11 compares the mass activity at 40°C for the thin- and thick-film RDE with the results obtained from PEMFC measurements. It becomes evident that Im from a thick-film RDE measurement closely matches the Im from PEMFC measurement with a similar loading at 0.65 ViR-free.
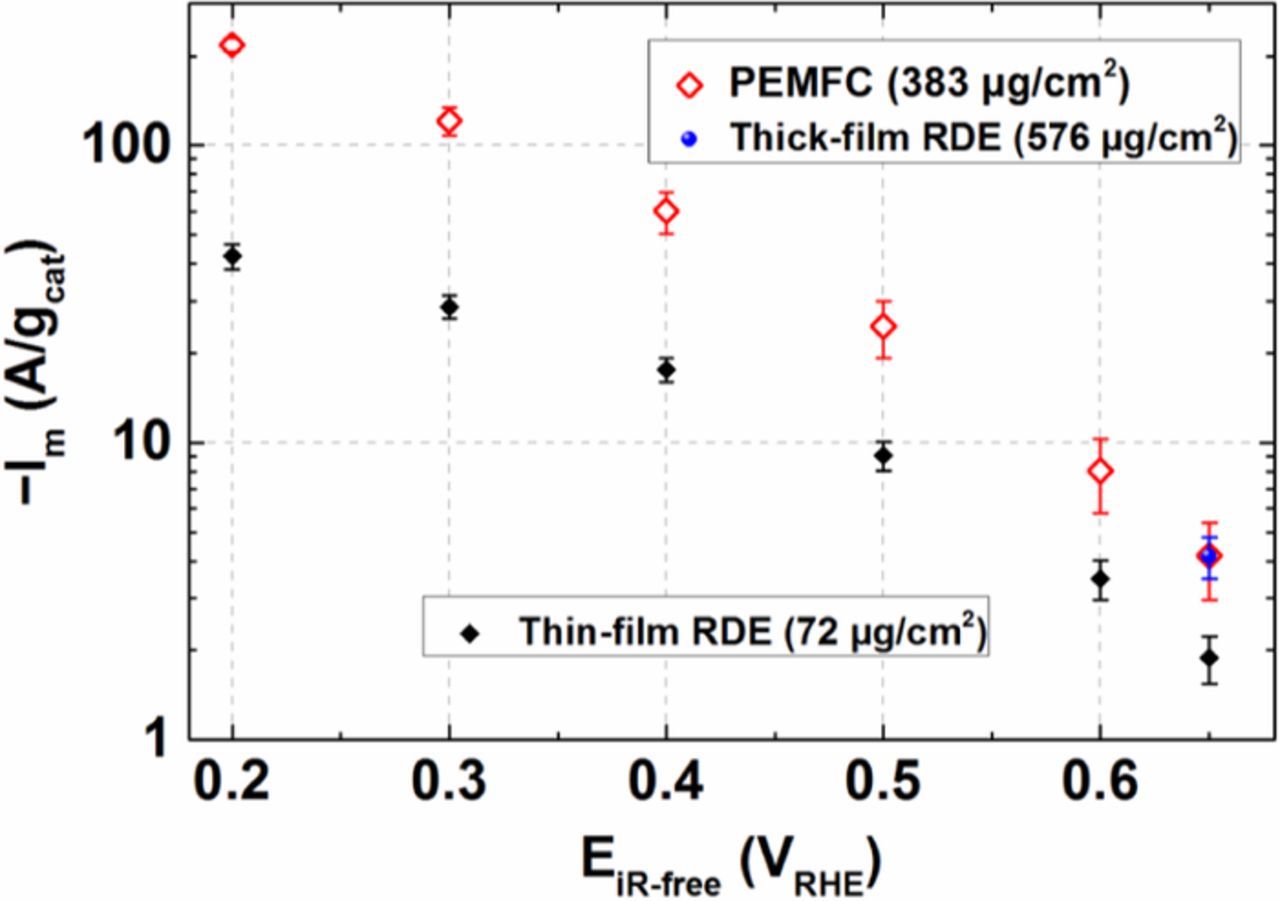
Figure 11. Comparison of ORR mass activities (Im) at 40°C vs. the HFR-corrected cathode potentials (EiR-free) obtained from thin-film (72 μg/cm2) and thick-film (576 μg/cm2) RDE, and PEMFC (380 μg/cm2) measurements.
This demonstrates that the increase in apparent mass activity of the Fe0.07Zr0.93O1.97 catalyst correlates with the increase in catalyst loading. We cannot find any reason for a change in pure electrochemical ORR mechanism only due to a loading increase. But we know from RRDE that the Fe0.07Zr0.93O1.97 catalyst generates a significant amount H2O2 (Fig. 6) and we have experimentally observed (Fig. S5) that Fe0.07Zr0.93O1.97 is a good catalyst for H2O2 chemical decomposition. Combining these observations, it is likely that a change in the catalyst loading can affect the residence time of produced H2O2 (Fig. 6) within a catalyst film, which relates to the local H2O2 concentration. Thus, we can hypothesize that the increase of the mass activity with loading is due to the shift of  to higher potentials because of the depletion of produced H2O2 via chemical decomposition (in thicker-films), leading to an increase in the rate of electroreduction of O2 to H2O2. The origin of this phenomenon is the same as reported by Mittermeier et al.;21 however, in that case the activity of Fe-free ZrO2 catalysts in PEMFC was lower than in thin-film RDE due to the opposite reason, namely higher local H2O2 concentration in PEMFC.
The activation energy (Eact) of the Fe0.07Zr0.93O1.97 catalyst at different cathode potentials (EiR-free), was determined using the Arrhenius representation from PEMFC and thin-film RDE measurements (Fig. 10c). It is observed that Eact of Fe0.07Zr0.93O1.97 from RDE and PEMFC measurements lie in a similar range (12–20 kJ/mol), which are comparable to the Eact of Fe-free ZrO2 from RDE (15–25 kJ/mol) and lower from PEMFC measurements (20–30 kJ/mol).21
Conclusions
While we had already reported on the high ORR activity of carbon-supported nanometric Fe-substituted ZrO2 in a previous communication,27 it remained unclear what the nature of the active site(s) would be, how Fe is coordinated in this catalyst, and how it would perform in a single-cell PEMFC. In this contribution we have successfully unveiled the nature of Fe and its coordination in the Fe-substituted ZrO2 catalyst, together with the possible active sites. NEXAFS and 57Fe Mössbauer spectroscopy analysis revealed that Fe exists as high-spin, isolated Fe3+ in the structure of ZrO2, a finding which was also supported by DFT calculations. In addition, we collected RDE data to determine the ORR mass activity of Fe-substituted ZrO2 catalysts, which is much improved in comparison to Fe-free ZrO2. DFT has shed light on the structural origin of this increased ORR activity of FexZr1−xO2−δ catalysts, showing that Zr4+-substitution with Fe3+ highly favors the formation of oxygen vacancies both along Fe-O-Zr and Zr-O-Zr bonds, which are the active sites in these catalysts. The oxygen reduction selectivity (H2O vs. H2O2) of the carbon supported Fe0.07Zr0.93O1.97 catalyst observed from RRDE measurements are in agreement with the most likely reaction paths emerging from DFT calculations. Also PEMFC measurements on Fe0.07Zr0.93O1.97 show a much higher activity vs. the Fe-free ZrO2 catalyst. From these data, Tafel-slopes and activation energies of Fe0.07Zr0.93O1.97 span between 170–130 mV/decade and 12–20 kJ/mol, respectively. We also evaluated the variation of mass activity of the best catalyst as a function of loading in R(R)DE measurements and compared the results with PEMFC data. From this comparison, we observed a significant increase in mass activity with catalyst loading in both electrochemical techniques.
Acknowledgments
This work was supported by the Bayerische Forschungsstiftung (Project ForOxiE², AZ 1143-14). We thank the Karlsruhe Nano Micro Facility (KNMF) and KARA for the provision of beamtime. The efforts of Dr. Carsten Peters to acquire TEM images is greatly appreciated. We also thank Johannes Sicklinger for his guidance and help in the H2O2 decomposition experiment.
ORCID
Pankaj Madkikar 0000-0001-7631-6683
Gregor S. Harzer 0000-0002-1830-1931
Thomas Mittermeier 0000-0002-3286-4095
Armin Siebel 0000-0001-5773-3342
Michele Piana 0000-0002-3310-6587