
Abstract
This work shows how to design and build positive/positive (+/+) and negative/negative (−/−) symmetric cells with electrodes operating in the same potential ranges (vs Li/Li+) as those in a full Li-ion cell. When this is achieved, better understanding of full cell degradation can be obtained. This method uses only coin cells that are ubiquitous in lithium-ion cell research instead of novel electrochemical devices that are more or less unique to specific research groups and are difficult to access. Using this method, the capacity retention and impedance growth of single crystal LiNi0.5Mn0.3Co0.2O2 (SC532)/artificial graphite full coin cells were shown to lie between those of the +/+ and −/− symmetric cells, regardless of electrolyte additive and surface coating. Among all the cells, the +/+ cells have the worst capacity retention and highest impedance growth. Simultaneously cycled full coin cells and symmetric cells demonstrate the beneficial effect of "cross-talk" between the SC532 and the graphite electrodes to lower full cell impedance growth. Additionally, symmetric cell results show that 2% of vinylene carbonate (VC) increases the negative impedance more than 1% of lithium diflurophosphate (LFO), and that 1%LFO is also a better additive than VC to inhibit positive electrode impedance growth with coating.
Export citation and abstract BibTeX RIS

This is an open access article distributed under the terms of the Creative Commons Attribution 4.0 License (CC BY, http://creativecommons.org/licenses/by/4.0/), which permits unrestricted reuse of the work in any medium, provided the original work is properly cited.
Further improving the energy density and the longevity of lithium-ion cells requires thorough understanding of the underlying cell degradation mechanisms. Various degradation mechanisms have been associated with almost all components of a lithium-ion cell, 1–8 which makes unraveling the reasons for degradation difficult. Additionally, electrode/electrode interactions are believed to have a strong influence on full cell performance, such as the increase of negative electrode impedance due to the "cross-over" of the dissolved transition metals from the positive electrode, 9–11 and the dramatic increase in positive electrode impedance in the absence of "cross-talk" provided by the graphite negative electrode. 12–15 These electrode/electrode interactions further contribute to the complexity of lithium-ion cell degradation studies.
Special electrochemical cells such as those with an embedded reference electrode, to monitor individual electrode voltage and impedance, 11,16,17 and novel electrochemical devices that physically separate each electrode have been used to study electrode/electrode interactions and products, etc. 18–21 However, these approaches are not without drawbacks. Although many are sufficiently reversible and relatively easy to produce, reference electrodes are hard to implement in various cell formats and are highly dependant on their location inside a cell. 22,23 Though novel electrochemical devices are helpful for gaining insights into degradation mechanisms, the major drawback is the limited accessibility for many other researchers and scientists. Therefore, a method with excellent accessibility that simultaneously allows the separate study of individual electrodes and the interactions between them can be highly useful for lithium-ion cell research.
Chen et al. 24 introduced a symmetric cell approach to distinguish the effects of the negative electrode and the positive electrode on the full cell impedance rise. Since a symmetric cell consists of electrolyte and only one type of electrode, one can learn more by doing charge-discharge cycling of symmetric cells. Symmetric cell cycling performance is dictated by the type of electrode used and its interaction with the selected electrolyte. Many reports have utilized this feature to study various combinations of electrodes and electrolyte, 14,25–28 but the one difficulty of utilizing symmetric cells for cycling lies in the determination of the electrode voltage range vs Li/Li+ in a symmetric cell. Unlike in a lithium-ion full cell where the voltage ranges of the positive and negative electrodes are familiar to researchers, each electrode voltage vs Li/Li+ in a symmetric cell is not easy to determine and is also closely related to how symmetric cells are constructed. The dV/dQ method 29 can be used to determine the potentials of each electrode vs Li/Li+ without introducing a reference electrode. This opens the door for utilizing the symmetric cell method with common coin-cell configurations.
In some previous symmetric cell studies, the voltage of each electrode vs Li/Li+ was not even revealed which makes it potentially difficult to compare symmetric cell experimental results with full cell studies. 25,27 In other studies, the operating voltage of symmetric cells was more or less arbitrarily chosen, 14,28 that is, the operating voltage of each electrode vs Li/Li+ in a symmetric cell (referred to as the electrode voltage hereafter) was not purposely determined, but instead, was determined using dV/dQ methods after symmetric cells were made and cycled. This could be problematic as failing to know the exact electrode voltage before cell building might lead to unnecessarily repeated experiments.
It is preferred to know the range of electrode voltage to be accessed before a symmetric cell is made. In other words, if one knows the electrode voltage of interest, the symmetric cell voltage shall be determined before cells are made and cycled. Determining the electrode voltage before assembly allows better control of experiments and avoids time-consuming and wasteful trial-and-error experiments. More importantly, carefully-designed symmetric cells with electrode voltages of interest facilitate the study of full cell degradation by "deconvolution" of full cell performance into positive/positive (+/+) and negative/negative (−/−) symmetric cells with appropriate voltage ranges, allowing cell degradation to be studied separately and electrodes interactions to be probed.
In this work, an explanation of how to design symmetric cells with desired electrode voltage vs Li/Li+ is given. Coated and uncoated single crystal LiNi0.5Mn0.3Co0.2O2 (SC532)/artificial graphite (AG) full cells (+/− cell) were cycled together with the corresponding +/+ symmetric cells and −/− symmetric cells to illustrate this method. Electrolytes of either 2 wt% vinylene carbonate (VC) or 1 wt% lithium difluorophosphate (LFO) with 1 molar LiPF6 in ethylene carbonate (EC)/diethyl carbonate (DEC) (v/v 1:2) solvent were chosen for study in the full and symmetric cells. The normalized capacity, impedance increase and post-cycling dV/dQ analysis of +/+, +/− and −/− cells were compared and discussed.
Experimental
Electrode preparation
Coated and uncoated single crystal LiNi0.5Mn0.3Co0.2O2 (SC532) electrodes were obtained from dry (no electrolyte) 402035-size machine-made pouch cells sealed from LiFun Technology (Xinma Industry Zone, Golden Dragon Road, Tianyuan District, Zhuzhou City, Hunan Province, PRC, 412000). The as-received pouch cells were cut open and the jelly roll was removed from the pouch. The jelly roll was unwound and the single-side-coated region of the positive electrode was punched into 12 mm diameter discs. The SC532 used in this study was uncoated SC532 as described by Li et al. 30 and Ti-based coated SC532 as described by Ma et al. 31 The SC532 loading was 21.1 mg cm−2 with 94% active material by weight. The punched positive electrode discs were used to make full coin cells and +/+ symmetric cells. Machine-made single-side-coated artificial graphite (AG) electrodes have a ca. 14 mg cm−2 loading with 95.4 wt% of active material obtained from a reputable supplier. The graphite electrodes were further punched into 12 mm diameter discs to make full coin cells and −/− symmetric cells. All electrodes for full coin cell, half cell and symmetric cells were baked at 110 °C overnight before proceeding to cell building.
Full coin cell, half cells and symmetric cell design/building
Figure 1a shows the full coin cell built using a typical coin-cell configuration. The full coin cell uses a blown microfiber (BMF) separator instead of Celgard separators, which is believed to benefit the full coin cell cycling according to Murray et al. 32 About 0.1–0.2 ml of electrolyte was added to the full coin cell. Figure 1b shows the C/20 2nd charge of the full coin cell curve (3 to 4.3 V) along with the relative positions and capacities of the SC532 and graphite curves determined by the dV/dQ method. This determines the exact operating voltage ranges of the positive and negative electrodes in a full cell so that symmetric cells can be built where their electrode voltages match these voltages. The dV/dQ method matches the differential voltage curve of the measured full cell (or symmetric cells) to that calculated using half cell data of reference electrodes. In the full cell case, the reference electrodes are SC532 and AG. The voltage vs Li/Li+ of each electrode at a full cell voltage of 4.3 V is read directly from Fig. 1b and labeled. The electrode voltages when the full cell voltage equals 3.0 V (not labeled) are 3.4 V for SC532 and 0.4 V for AG vs Li/Li+. Figure 1c shows an excellent match between the calculated differential voltage curve and the measured differential full cell charging curve. Note that the N/P ratio of this full cell is not optimized, and a large portion of the graphite Stage 1–2 plateau is unused, however the efficacy of the symmetric cell approach will not be affected by this.

Figure 1. (a) Full coin cell configuration with LiNi0.5Mn0.3Co0.2O2 (SC532) positive, artificial graphite (AG) negative and blown microfiber separator (BMF). (b) Full coin cell 2nd C/20 charging curve from 3 to 4.3 V at 40 oC. Relative positions of positive and negative electrodes are given by the dV/dQ method. (c) The goodness-of-fit of the dV/dQ method. Corresponding differential voltage curves of SC532 positive and AG negative in (b) are shown.
Download figure:
Standard image High-resolution imageFigure 2 shows the schematics for building +/+ (a) and −/− (b) symmetric cells from half cells. The half cell components are exactly the same as those in the full coin cell shown in Fig. 1a, except for the use of an extra piece of Celgard separator. Each positive half cell was run for 1.5 cycles from 3.0 V to 4.5 V at 40 °C followed by a voltage hold at 4.5 V for 20 h. Each negative half cell was run for 1.5 cycles from 2.0 V to 5.0 mV at 40 °C followed by a voltage hold at 5.0 mV for 3 h. These half cells were then dissembled using a home-made coin cell opener in the glove box. 14 The Li foil and Celgard separator were peeled off together and the charged electrodes (#2) were removed from the half cells along with the BMF separators for symmetric cell building. This is important as peeling off the BMF directly from the charged electrode (#2) will most likely damage the electrode coating integrity. For +/+ symmetric cells the charged electrode (#2) and the BMF separator were then positioned at the center of an aluminum-coated coin cell can and paired with a fresh electrode (#1) that has identical mass. A few drops of electrolyte were added between the BMF and the fresh electrode (#1). The aluminum coating was ca. 4 μm thick prepared by sputtering on typical stainless steel coin cell parts. The 2325-size coin cell hardware was supplied by Kaga Steel (USA). The assembly of a +/+ symmetric cell is identical to that of a half cell except that a +/+ symmetric cell uses all aluminum parts in place of the conventional stainless steel parts that can be easily oxidized during symmetric cell cycling. The use of two aluminum spacers provides enough stack height so electrodes are under some stack pressure after crimping. The −/− symmetric cell components are exactly the same as the full coin cell in Fig. 1a. The assembled symmetric cells were torr-sealed after crimping to prevent any electrolyte evaporation during testing at elevated temperature.

Figure 2. Schematics of +/+ (a) and −/− (b) symmetric cell construction from half cells. The +/+ symmetric cell uses aluminum or aluminum coated parts. #1 refers to an initially fresh electrode and #2 refers to an initially charged electrode in a symmetric cell build.
Download figure:
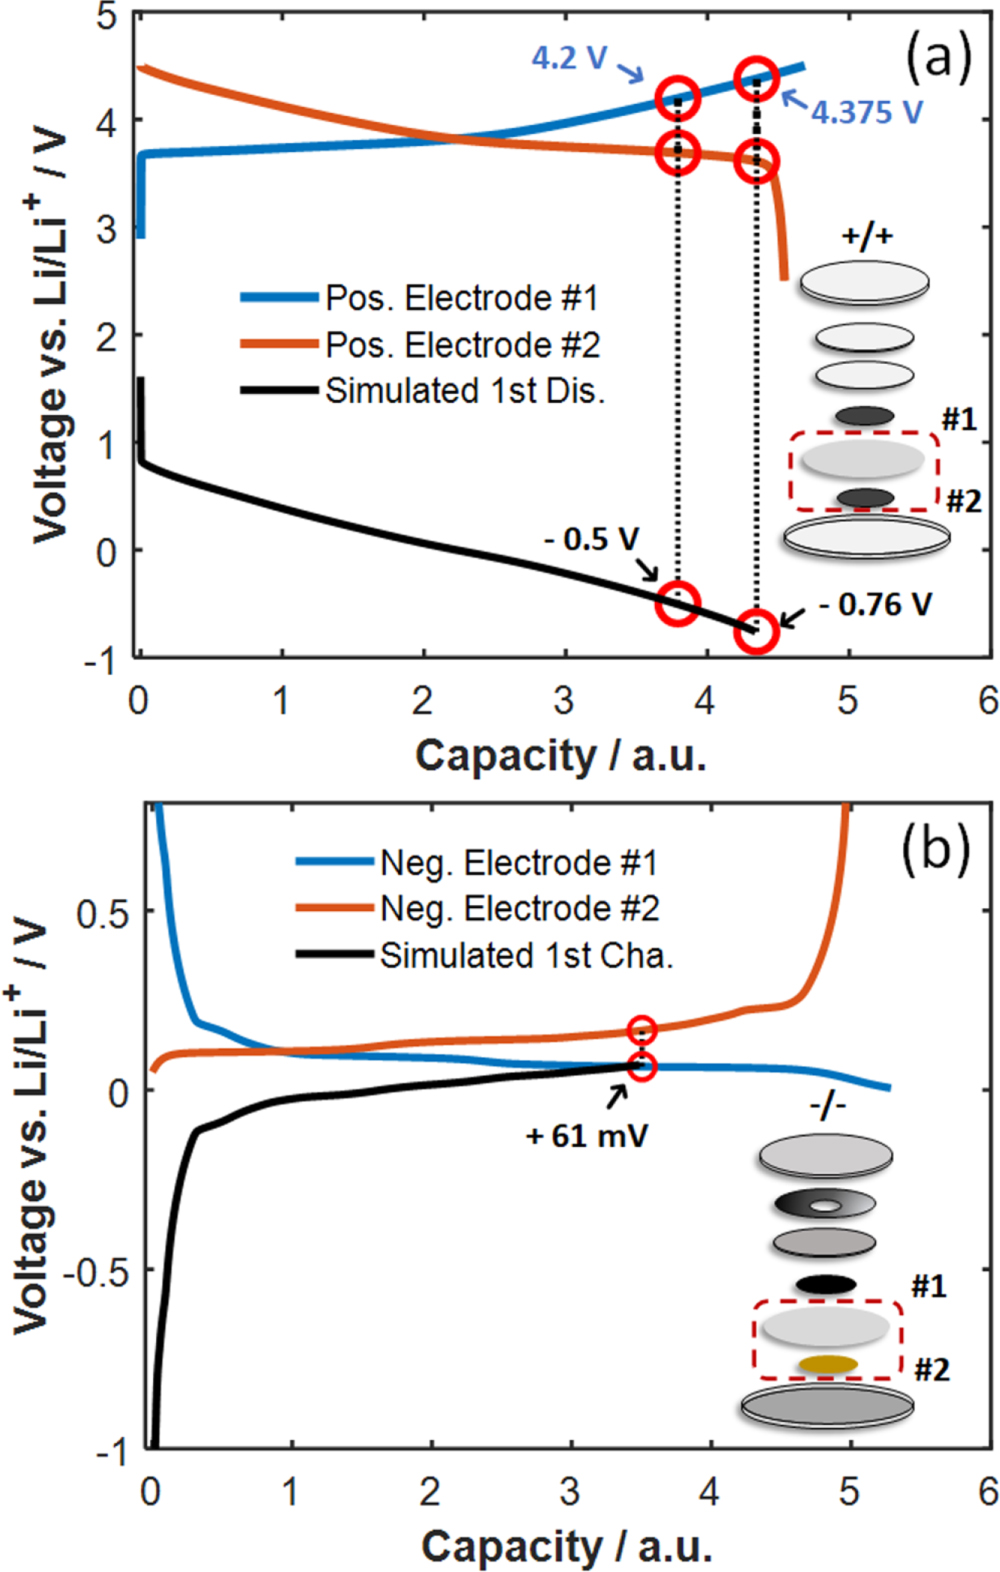
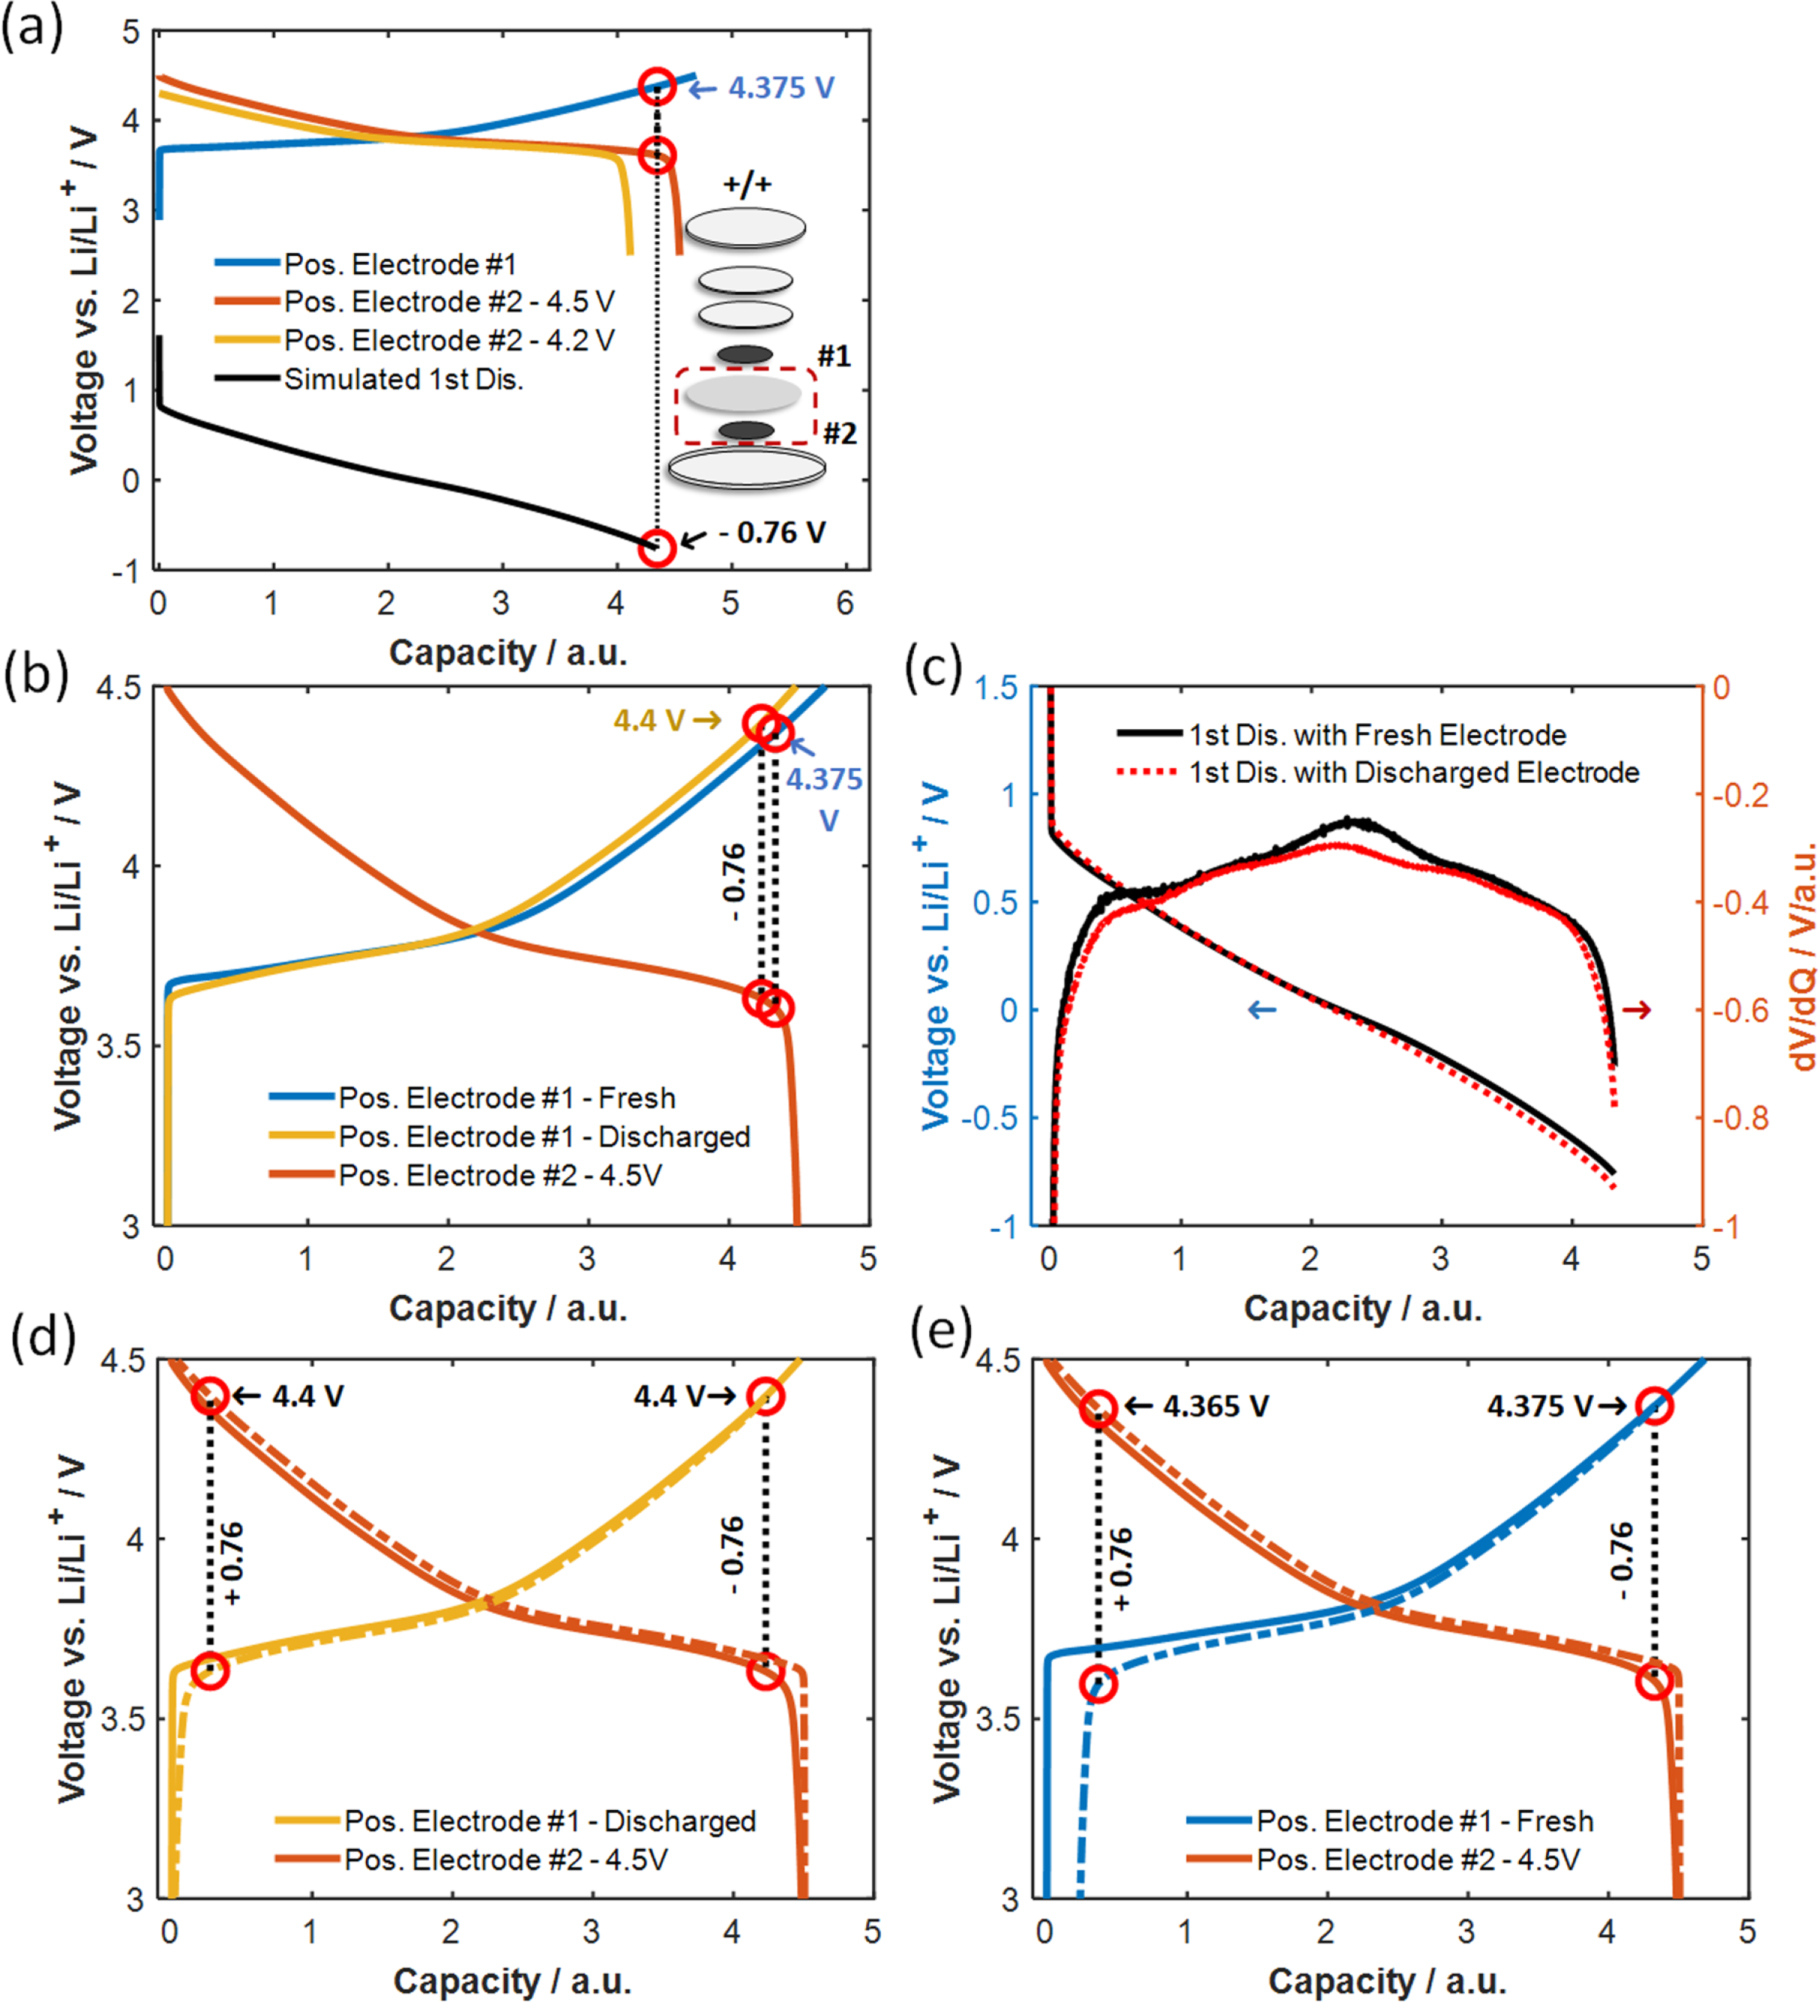
Standard image High-resolution imageFigure 3a shows the process of designing the +/+ symmetric cell cut-off voltages graphically where the symmetric cell is built with a fresh electrode (#1) and a charged electrode (#2) at 4.5 V vs Li/Li+. The location of each electrode in a coin-cell configuration is indicated in the inset schematic. This "imagined" symmetric cell will have a positive initial open-circuit voltage as determined by the initial voltage difference of these two electrodes. The as-assembled +/+ cell requires an initial discharge so that lithium deintercalated from the fresh electrode (#1) can be inserted into the charged electrode (#2). As a result, during the 1st symmetric cell discharge, the behavior of each electrode in a symmetric cell can be exactly known and plotted, as shown in Fig. 3a. The symmetric cell voltage equals the voltage difference between electrodes #1 and #2. To obtain the same positive electrode voltages vs Li/Li+ in a symmetric cell to match that in the full coin cell (between ca. 4.375 and 3.4 V), one has to go through a trial-and-error process graphically. If the +/+ symmetric cell is discharged to—0.5 V for example, the two positive electrodes are at 4.2 and 3.7 V vs Li/Li+ which do not match the desired positive electrode voltage vs Li/Li+, so the symmetric cell has to be discharged to a lower voltage. When discharging to—0.76 V, electrode #1 will be at 4.375 V and electrode #2 will be at ca. 3.60 V, which reaches our goal. Though the voltage of electrode #2 did not perfectly match 3.4 V, it is not expected that this voltage difference of 0.2 V at low states of charge will have any significant impact on cell degradation during cycling. Therefore by symmetry, the upper cut-off voltage of the +/+ cell needs to be + 0.76 V, which means, during symmetric cell charging, electrode #1 will be discharging and electrode #2 will undergo a charging process, until the voltage difference of electrode #1 and #2 reaches 0.76 V. Please note that the symmetric cell introduced here has a fresh electrode (#1), which will have an irreversible capacity during the first charge of symmetric cell. The impact of having a fresh electrode vs a lithiated electrode #1 on symmetric cell capacity and the electrode voltage is discussed in detail in the next section.

Figure 3. (a) Simulated +/+ symmetric cell 1st discharge to −0.5 V and—0.76 V. The symmetric cell was constructed with a fresh electrode (#1) and a delithiated electrode to 4.5 V vs Li/Li+ (#2). Half cell curves were measured at 40 oC with C/20. The inset schematic shows the coin cell configuration of such a symmetric cell identical to Liu et al. 14 (b) Simulated −/− symmetric cell 1st charge to + 0.061 V. Symmetric cell was constructed with a fresh electrode (#1) and a lithiated electrode to 5 mV vs Li/Li+ (#2). Half cell curves were measured at 40 oC with C/20. The inset schematic shows the coin-cell configuration of such a symmetric cell identical to Fig. 1a. Enclosed regions in both schematics indicate that the separator and electrode were prepared in and transferred from half cells.
Download figure:
Standard image High-resolution imageThe steps of determining the cut-off voltages of +/+ symmetric cells are also similarly applied for a −/− symmetric cell shown in 3(b) where each electrode needs to match the full coin cell AG electrode voltage vs Li/Li+ of 0.4 and 0.075 V. Due to the electrode placements and our conventions, a −/− symmetric cell will require an initial charging from a negative voltage, then by the same graphical trial-and-error process, the upper cut-off voltage is determined to be + 61 mV where electrode voltage #1 is at 0.075 V and electrode voltage #2 is at ca. 0.14 V vs Li/Li+. By symmetry, the lower cut-off voltage is—61 mV. Similar to the design of a +/+ symmetric cell, the fresh electrode (#1) in the −/− symmetric cell will also have an irreversible capacity during the first discharge of a symmetric cell. Note that for a full cell with optimized N/P ratio, the voltage range of its negative electrode will be much wider than in this case, and the corresponding −/− symmetric cell cut-off voltages will be much wider than ± 61 mV. In general, this "graphical method" allows the design and determination of symmetric cell cut-off voltages without any making any real cells.
Figure 4a considers building a +/+ symmetric cell with electrode #2 initially at 4.2 V instead of 4.5 V vs Li/Li+. The determination +/+ symmetric cell voltage cut-offs with electrode #2 at 4.5 V vs Li/Li+ has been discussed in a previous section. With positive electrode #2 initially at 4.2 V, regardless of the symmetric cell discharge (or charge) cut-off, it can be seen graphically that the electrode voltage can never reach 4.375 V vs Li/Li+. This scenario indicates that one has to consider the voltage of electrode #2 carefully before symmetric cell building so that the desired electrode voltage (vs Li/Li+) can be reached. To obtain a high electrode voltage, a sufficiently high electrode #2 voltage will be required.

Figure 4. (a) The +/+ symmetric cell built using electrode #2 initially at 4.2 V instead of 4.5 V vs Li/Li+ (b) The +/+ symmetric cell built using a discharged electrode #1 instead of a fresh electrode, and (c) the resulting 1st discharge and its differential voltage discharge curves. (d), (e) Electrode curves for a symmetric cell built with initially discharged electrode or a fresh electrode #1, respectively. Electrode curves for symmetric cell undergoing 1st discharging (solid) or 1st charging (dash). The symmetric cell cut-offs are shown as vertical dash lines.
Download figure:
Standard image High-resolution imageFigure 4b shows the effect of using an initially discharged positive electrode #1 instead of a fresh electrode for a +/+ symmetric cell build that also discharges to −0.76 V. Researchers may want to construct cells like this to eliminate the effect of positive electrode irreversible capacity. In this scenario, though discharging to an identical lower cut-off, the symmetric cell with an initially discharged positive electrode #1 reaches a slightly higher electrode voltage (4.4 V and 3.64 vs Li/Li+). This is due to its steeper slope during charging than a fresh electrode when both electrodes are charging from the discharged state. Figure 4c simulates the 1st symmetric cell discharge (V vs Q) and the differential voltage (dV/dQ vs Q) curve of the two scenarios depicted in Fig. 4b. Simulated V vs Q curves are plotted by subtracting the electrode #1 curve from that of electrode #2. Both the V vs Q and dV/dQ vs Q curves indicate the symmetric cell curve shapes are dependent on the states of the electrodes that made the cell. As a result, when applying the dV/dQ method, the corresponding half cell curve must be used to achieve a good fitting.
Figures 4d and 4e examine the 1st charging of +/+ symmetric cells made with electrode #2 at 4.5 V vs Li/Li+ but with either an initially discharged or an initially fresh electrode #1, respectively. The solid and dashed lines are the corresponding electrode curves when a +/+ symmetric cell undergoes 1st discharging and the following 1st charging, respectively, that are bounded by the vertical dashed lines. Figure 4d shows a perfectly symmetric behavior in terms of voltage of the two electrodes in a symmetric cell built with an initially discharged electrode #1. On the other hand, Fig. 4e shows a +/+ symmetric cell built with a fresh electrode #1 is slightly less symmetric and has smaller capacity. This is because during the 1st charging process of the symmetric cell, electrode #1 undergoes its 1st discharge which has less capacity than its 1st charge due to irreversible capacity. The set electrodes used here have a 1st cycle inefficiency about 5%. The 1st cycle efficiency and the shape of the half cell curve influence the determination of electrode voltage. It is necessary to go through all the above processes for materials other than SC532 to obtain an accurate symmetric cell design. It is also necessary to consider each aspect in Fig. 4 for −/− symmetric cell building. Similar to a +/+ symmetric cell, the use of a delithiated electrode #1 instead of a fresh electrode in a −/− symmetric cell will also have more capacity due to the lack of the 1st cycle irreversible process. In such a case, the lower cut-off voltage of electrode #1 is expected to be very close to 0.075 V vs Li/Li+ that also falls on the long stage 1–2 plateau.
Figure 5 shows the 1st cycle of the +/+ and −/− symmetric cells built by the method described in Fig. 2. The electrode voltages of these symmetric cells were designed to match the SC532/AG full coin cell voltages by following the method described in Fig. 3 and were further verified using the dV/dQ method with the goodness-of-fit plots shown in Fig. S1 (available online at stacks.iop.org/JES/168/080537/mmedia). Note that the shape of the differential voltage curve simulated in Fig. 4c with a fresh electrode #1 is identical to the measured +/+ symmetric cell 1st discharge differential voltage curve in Fig. S1. After this step, the construction of symmetric cells is completed. Using a fresh positive and a fresh negative electrode #1 is advantageous for symmetric cell building because only one half cell needs to be built/dissembled per symmetric cell. Table I summaries each electrode voltage in full coin cell, +/+ and −/− symmetric cells.
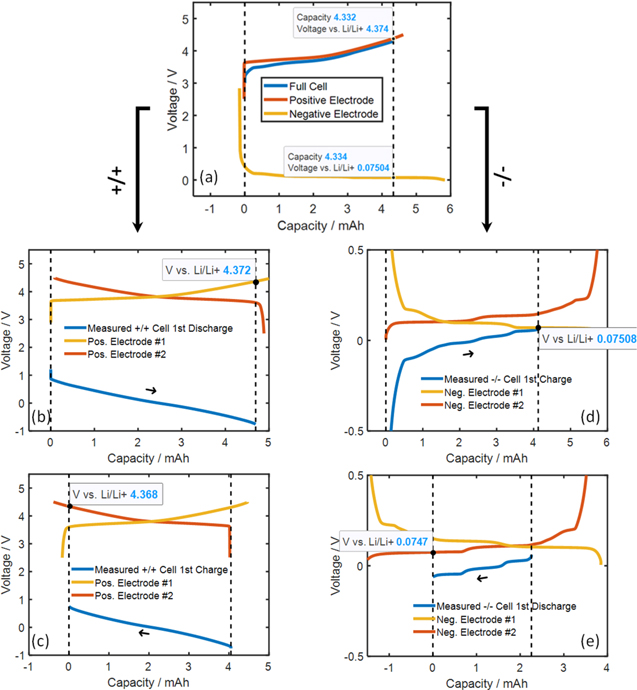
Figure 5. Separating a full coin cell into +/+ and −/− symmetric cells. (a) Full coin cell operates between 3 and 4.3 V. (b), (c) The +/+symmetric cell 1st discharge and 1st charge, respectively, cycled between ± 0.76 V. (d), (e) The −/−symmetric cell 1st charge and 1st discharge, respectively, cycled between ± 0.61 mV. Tests were done at 40 oC. The goodness-of-fits are shown in Fig. S1.
Download figure:
Standard image High-resolution imageTable I. Electrode voltages in full coin cell and symmetric cells.
| +/− Full cell (3–4.3 V) | +/+ Symmetric cell (−0.76–+0.76 V) | −/− Symmetric cell (−61–+61 mV) | ||||
|---|---|---|---|---|---|---|
| Cut-off voltage/V vs Li/Li+ | Positive | Negative | Positive #1 | Positive #2 | Negative #1 | Negative #2 |
| Upper | 4.375 | 0.075 | 4.372 | 3.61 | 0.075 | 0.136 |
| Lower | 3.4 | 0.4 | 3.61 | 4.368 | 0.136 | 0.075 |
Electrochemical impedance spectroscopy (EIS)
EIS measurements were conducted on the symmetric cells at 0 V for convenience using a Biologic VMP-3 instrument. The positive and negative electrodes in their corresponding symmetric cells at 0 V are at ca. 3.8 V and ca. 0.1 V vs Li/Li+, respectively. Correspondingly, the impedance of a full cell made of a positive and a negative electrode with these voltages shall be measured at 3.7 V for a fair comparison to the symmetric cell impedances. Before impedance measurements, all cells were allowed to thermally equilibrate for 1 h at 10 °C. Impedance spectra were collected with ten points per decade from 100 kHz to 10 mHz with a perturbation amplitude of 10 mV. For simplicity of discussion, the charge-transfer resistance is defined herein as the span of the "semicircle" from high to low frequency.
Full coin cell and symmetric cell testing
Full cell and symmetric cell cut-off voltages are listed in Table I. The full coin cells were cycled for at C/20 for 1.5 cycles first at 40 °C on an ultra-high precision charger to obtain an accurate cell capacity. The 2nd charging curve was used for the dV/dQ method to obtain the voltages of each electrode vs Li/Li+. The full coin cells then continued to cycle once at C/20 at 55 °C and were taken out of the temperature box for the EIS measurement. After the EIS measurement, cells were stored at room temperature for 6 d before a 2nd EIS measurement. After the 2nd EIS measurement, the full coin cells were put back to the temperature box at 55 °C for 25 cycles at C/5. The cells were again taken out of the temperature box for EIS measurement as described above. The cycling-EIS steps were repeated for two more times until a total of 75 cycles were reached and three EIS measurements were made. The symmetric cell cycling was conducted the same way only after the full coin cell dV/dQ analysis was performed. The 1.5 C/20 symmetric cell cycle at 40 °C was used to verify the symmetric cell design. Ideally, to eliminate cell overvoltage, full coin cells and symmetric cells should undergo constant voltage process at both the upper and lower voltage cut-offs such as the protocol used by Liu et al. 14 with a few hours of constant voltage hold. The C/5 rate used here assumed a low impact of cell overvoltage meanwhile allowing the cycling to finish within a relatively short period of time.
All electrolyte components are battery grade and used as received. 2 wt% vinylene carbonate (VC, supplied by BASF, purity > 99.8%, water content < 100 ppm) or 1 wt%. lithium difluorphosphate (LiPO2F2, supplied by both Shenzhen Capchem and Guangzhou Tinci New Materials Technology) were dissolved in EC/DEC (v/v 1:2) with 1 molar LiPF6 (supplied by BASF, purity 99.94%, water content 14 ppm). The chemical structure of LiPO2F2 (LFO) can be found in Harlow et al. 33
Pouch cell testing
402035-size machine-made coated SC532/AG pouch cells balanced to 4.4 V were formed with 0.85 ml of electrolyte according to the procedures detailed by Li et al. 30 The pouch cell SC532 positive electrode was exactly the same as those used in the full coin cell and +/+ symmetric cell build (21.1 mg cm−2 with 94 wt% active material). The pouch cell AG negative electrode has a 12.2 mg/cm2 loading with 95.4 wt% of active material. Electrolyte blends used in pouch cells were 1 molar LiPF6 in either 30 vol% EC/70 vol% ethyl methyl carbonate + 2 wt% VC or 25 vol% EC/5 vol% ethyl methyl carbonate/70 vol% dimethyl carbonate + 1 wt% LFO.
All pouch cells were tested for long term cycling at 55 °C with a C/3 charge-discharge rate. Pouch cells with VC were tested between 3 to 4.3 V for the first 300 cycles and then switched to 3 to 4.4 V for the rest of cycling. Pouch cells with LFO were tested between 3 to 4.3 V throughout the entire testing. All cells were held at upper cut-off voltage during each cycle until the current reached C/20.
Results and Discussion
Figure 6a shows the 1st charge dQ/dV vs V of SC532/AG full coin cells which are useful to explore the electrolyte reduction potential during cell formation. The full coin cells with 2%VC show a peak at ca. 2.85 V and those with 1%LFO show a peak at ca. 2.93 V. The dQ/dV peak during formation of an EC-based electrolyte with or without 1%LFO was reported to occur at ca. 2.9 V in pouch cells, 10 which is approximately the same as observed in these full coin cells. Figures 6b and 6c show the dV/dQ method performed on the full coin cell 1st charge with 2%VC and 1%LFO, respectively, focusing on the low capacity region. This is to estimate the electrolyte reduction potential vs Li/Li+ on the graphite negative by finding the voltage gap between the positive and negative electrodes that matches the voltage at the dQ/dV peak. The goodness-of-fits are shown in Fig. S2. The electrolyte with 2%VC or 1%LFO is therefore estimated to be reduced at ca. 0.82 V and 0.76 V vs Li/Li+, respectively, during cell formation. These reduction potentials fall within the electrode voltage range of −/− symmetric cells. Inaba et al. 34 studied the reduction of 1 M LiClO4 in EC-DEC on graphite via cyclic voltammetry and observed that the first reduction occurred at 0.733 V followed by reductions at 0.558 and 0.427 V vs Li/Li+. These reduction processes were believed to be closely related to solvent decomposition and surface film formation. Unlike VC which is well-known to be reduced and form a surface film on graphite prior to EC reduction, approximately the same LFO reduction voltage as in the control EC-based electrolyte suggests EC decomposition and surface film formation, rather than LFO, during the initial part of the 1st charge when 1%LFO is used in full coin cell.
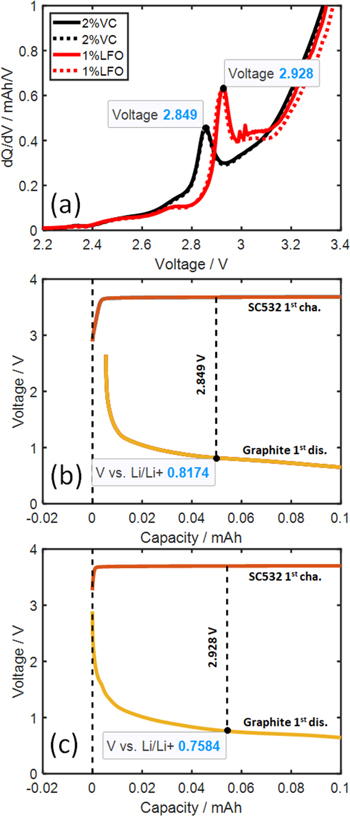
Figure 6. (a) dQ/dV vs V of the 1st full coin cell charge with electrolytes containing 2%VC or 1%LFO. Dashed lines represent data from duplicate cells. (b), (c) dV/dQ analysis performed on the 1st charge of full cells with 2%VC or 1%LFO, respectively, to estimate electrolyte reduction potential on the graphite negative. The goodness-of-fits are shown in Fig. S2.
Download figure:
Standard image High-resolution imageFigure 7 shows the capacity, normalized capacity, and voltage hysteresis (∆V) as a function of cycle number for the full coin cells, +/+ and −/− symmetric cells at 55 °C with electrolytes containing 2%VC or 1%LFO. The full coin cell cycling shows a drop of capacity at 25th and 50th cycles presumably due to the temperature excursion from the 55 °C box to the 10 °C EIS box and the room temperature storage before the 2nd EIS. Exactly how this happened was unknown to the authors, however this was not uncommon as mentioned by other papers. 35,36 If one extrapolates from the first 25 cycles to the end of the test, the full coin cells with either coated or uncoated SC532 show similar performance. This might because the effect of coating was not apparent for only 75 cycles under the testing conditions in this study. However, the impact of electrolyte additives can be more obviously seen at 55 °C. The full coin cells with 1%LFO showed better capacity retention than those with 2%VC.

Figure 7. The capacity, normalized capacity, and voltage polarization (∆V) of full coin cells and symmetric cells vs cycle number for 2%VC (left column) and 1%LFO (right column) measured at 55 oC with C/5 rate. Pair cells were plotted. The cut-off voltages are listed in Table I.
Download figure:
Standard image High-resolution imageThe capacities of the symmetric cells are lower than those of the full coin cell with either additive due to a narrower voltage range. However, this "narrow voltage range" shall not affect symmetric cell cycling as it only due to the low (for +/+ cell) and high (for −/− cell) electrode voltage where the side reactions are minimum. For the +/+ cells with 2%VC, regardless of the coating, all SC532 symmetric cells showed very rapid capacity fade which makes it difficult to determine the effect of the coating on cycling. For the +/+ symmetric cells with 1%LFO, coated SC532 outperformed the uncoated SC532. In fact, coated SC532 with 1%LFO has the best cycling retention among all +/+ cells. This suggests a careful selection of electrolyte additive and coatings is significant to improve the performance of +/+ cells by minimizing parasitic reactions. 1% LFO is a better additive than 2% VC for SC532 to achieve a better cycling. Though the majority of the +/+ symmetric cells showed inferior capacity retention, their corresponding full coin cells cycled much better suggesting the necessity of having "cross-talk" between the SC532 positive and graphite negative.
The normalized capacity of −/− cells with 2%VC dropped significantly after the 1st C/20 cycle and remained stable at C/5. In contrast, −/− cells with 1%LFO show a gradual decrease till the end of cycling. Since a −/− cell has only graphite electrodes, the cause of this is most likely related to the decomposition of electrolyte to form a thicker solid electrolyte interface (SEI) and further causes electrode slippage. The SEI of the −/− cells with VC additive could be quite stable with little capacity loss observed right after formation. This could be due to the preferentially reduction of VC over EC according to Fig. 6 and another report. 37 On the other hand, the gradual capacity decrease of −/− cells with 1%LFO might be a sign of SEI thickening as a result of gradual EC decomposition.
The voltage polarization (∆V) increase of +/+ cells are much more significant than those of the +/− and −/− cells. In fact, except for the coated SC532 +/+ cell with 1%LFO, the voltage polarization of the rest of +/+ cells are so large that they have to be clipped for clarity of presentation. In contrast, the polarization of −/− cells all stay very stable throughout testing. The polarization increase as well as capacity retention of +/− cells are in-between those of the positive and negative symmetric cells which again demonstrates the beneficial effect of "cross-talk" in a full cell.
Figure 8 shows the impact of 2%VC and 1%LFO on the capacity, normalized capacity, and voltage polarization (∆V) of coated SC532/AG pouch cells at 55 °C. The normalized capacity was very close for these two additives for 300 cycles. However, the impedance of cells with 2%VC was much higher than that of the cells with 1%LFO from the beginning of cycling. From symmetric cell cycling in Fig. 7, the higher impedance of the pouch cell with 2%VC compared to the cell with 1%LFO was due to the fact than 2%VC is not as effective as 1%LFO to inhibit impedance growth at both the positive and negative electrodes. Beyond 300 cycles, it is not surprising to see that pouch cells cycled up to 4.4 V with 2%VC showed higher capacity, decreasing capacity retention and higher impedance growth than those with 1%LFO. In comparison to the hand-built full coin cells, the commercial-grade pouch cells cycled up to 4.3 V showed significantly better performance. The thick BMF separator used in full coin cell is expected to introduce much more IR drop than the commercial microporous separators in pouch cells.
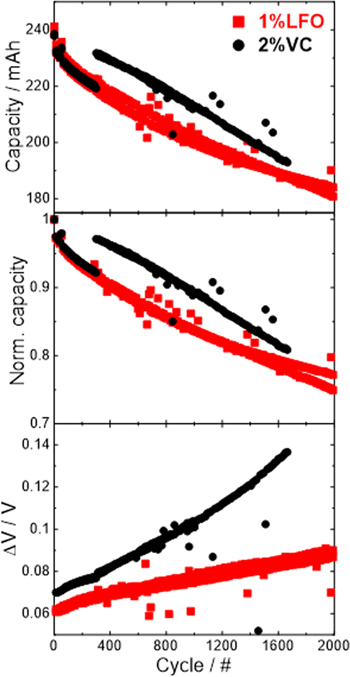
Figure 8. The capacity, normalized capacity, and voltage polarization (∆V) of coated SC532 pouch cells vs cycle number for cells with 2%VC or 1%LFO measured at 55 oC using a C/3 rate. Pouch cells with VC were tested between 3 and 4.3 V for the first 300 cycles and then switched to 3 to 4.4 V for the rest of cycling. Pouch cells with LFO were tested between 3 to 4.3 V throughout the entire testing. All cells were held at upper cut-off voltage during each cycle until the current reached C/20. Pair cells are plotted.
Download figure:
Standard image High-resolution imageFigure 9 compares the impedance spectra of full coin cells after cycling for 75 cycles to the those of symmetric cells made from dissembling those full coin cells. The impedance of coated SC532 +/+ cells is significantly lower than that of the uncoated SC532 regardless of the additive. In addition, the impedance increase of uncoated SC532 cells as a function of time is also larger than those of coated SC532 cells. To inhibit the large impedance of SC532 +/+ cells, the choice of electrolyte additives is as important as a coating which agrees with Fig. 7. The impedance increase of +/+ cells with time has been first proposed by Xiong et al. 12 who speculated the presence of CO2 was responsible for the impedance rise. Recently, Liu et al. 14 suggested that the presence of HF, from trace amounts of water, which is not consumed consumed by the graphite negative could also cause this increase of impedance due to the self-catalytic nature of this side reaction. On the other hand, the full coin cell impedance does not vary as a function of time. It is also apparent that a combination of coating and a good choice of electrolyte additive (1%LFO in this study) is effective to lower the full cell impedance. This combination also provides the lowest +/+ cell impedance in this study. The −/− cells with 1%LFO have lower impedance than those with 2%VC, which can be closely related to the SEI formation with different additives on graphite. The impedance of −/− cells also does not vary as a function of time.

Figure 9. Impedance spectra of full coin cells and symmetric cells built from them with 2%VC (a) and 1%LFO (c) right after cycling at 55 °C. The impedance spectra measured after room temperature storage for 6 d with 2%VC (b) and 1%LFO (d). The charge-transfer resistance of +/+ and −/− cells directly built for cycling is shown in Fig. S3.
Download figure:
Standard image High-resolution imageThe charge-transfer resistance of +/+ and −/− cells directly built for cycling is reported in Fig. S3. The impedance of the ++ cell used for cycling shows a significantly higher impedance and stronger dependence on time than those made from dissembling cycled full cells. On the other hand, the impedance of −/− cells used for cycling also does not show a significant difference from those made from dissembling cycled full coin cells. The impedance results agree with Xiong et al. 12 who proposed that the presence of a graphite negative is important to lower the positive impedance.
Figure 10 shows the dV/dQ method performed on the 1st C/5 (top panels) and 75th C/5 cycle (bottom panels) on the coated SC5/32/graphite full coin cell, coated SC532 +/+ and −/− symmetric cells with 1%LFO to get some insight on the degradation mechanisms. Symmetric cells with uncoated SC532 that did not finish 75 cycles were not analyzed with the dV/dQ method at this point. The quality of all fits is shown in Fig. S4. The coated SC532/graphite full coin cell with 1%LFO shows a significant shift of the graphite negative electrode relative to the positive which indicates that lithium inventory loss due to SEI formation is the main cause of cell degradation. The SC532 shows no loss of active mass and a slight negative mass loss as suggested by the length of the half cell curve before and after cycling. This observation is consistent with Liu et al. 6 on single crystal pouch cell degradation analysis.

Figure 10. Dv/dQ method on the 1st C/5 (top panels) and the 75th C/5 (bot panels) coated SC532/AG full coin cell charge (a), (b), and corresponding +/+ symmetric cell discharge (c), (d) and −/− symmetric cell charge (e), (f) with 1% LFO. The goodness-of-fits are shown in Fig. S4.
Download figure:
Standard image High-resolution image
For +/+ cells, it is quite surprising to observe a significant active material loss since single crystal materials do not suffer from microcracking that leads to active material loss at least up to 4.3 V vs Li/Li+. The active material loss in a +/+ symmetric cell using commercial positive electrodes is therefore unrelated to particle microcracking. Considering the huge impedance rise during cycling at 55 °C, the mass loss observed in the +/+ symmetric cell is presumably related to the formation of an inactive rock-salt layer at the surface. Other reports such as Liu et al. 14 suggest that the presence of HF, from trace amounts of water, that is not consumed by the graphite negative could also be a source of material loss. Recently Hamam et al. 38 proposed a reaction regime suggesting that the formation of HF in a lithium-ion cell can cause proton attack on the positive electrode material. In comparison to the full cell degradation, the observation of +/+ cell highlights the presence and importance of electrode interactions and suggests a different degradation route when only a positive electrode is present.
For the −/− cells, a significant electrode slippage occurred between the two negative electrodes causing a decrease in capacity, presumably a result of lithium inventory consumption due to the thickening of the SEI, causing a change in symmetric cell voltage-capacity curve shape. The primary cause of cell degradation of a −/− cell is therefore the same as the SC532/AG full coin cell.
Conclusions
The method of deconvoluting a full cell into +/+ and a −/− cell with matching full cell voltage was introduced in great detail. This method utilizes only coin cell parts without any sophisticated components or devices which can be readily accessible to researchers. This method was used in this study to look into the degradation of SC532/AG full coin cells and each electrode separately in corresponding symmetric cells. It was found that +/+ cells degrade faster than −/− cells and full cells regardless of electrolyte additives used and the presence of cathode coating. The capacity retention and impedance growth of full cells are in-between those of the symmetric cells. Symmetric cell results show that 2% of VC increases the negative impedance more than 1% of LFO, and 1% LFO is also a better additive than 2% VC to inhibit positive impedance growth with coating. Future work will focus on comparing electrolyte consumption and interfacial conditions between symmetric cells and full cells by applying this method.
Acknowledgments
The authors acknowledge the financial support of NSERC and Tesla Canada under the auspices of the Industrial Chairs program. Y.L. thanks Chen Li at Tesla for providing the single-side coated negative electrodes used in this study.