

Abstract
We demonstrate through a combination of in operando solvent exchange and depth-sensitive neutron reflectometry that the solid electrolyte interphase (SEI) formed after the initial lithiation of a silicon anode, using a standard LiPF6 ethylene carbonate/ethyl methyl carbonate electrolyte, is chemically homogeneous across the liquid-solid interface. The data show the SEI is accessible to solvent/salt exchange throughout the layer indicating the poorly bound nature of the SEI components. Further, the data indicates that P-F species, from the decomposition of the LiPF6 salt, are highly mobile and removed from the SEI with solvent exchange. Critically, the SEI layer is structurally homogenous, in contrast to the reports in the literature of an inorganic/organic bilayer, which is important to our understanding of SEI formation and chemistry.
Export citation and abstract BibTeX RIS
The reaction between the aprotic electrolyte in a lithium ion battery and the highly reducing anode surface leads to the decomposition of the battery electrolyte and the formation of the resulting solid electrolyte interphase (SEI). 1,2 A good SEI passivates the anode's surface and prevents further electrolyte decomposition, thus enabling long cycle life. For a silicon anode the SEI that forms is unstable. 3,4 The SEI is continuously broken down and reformed with electrochemical cycling leading to rapid capacity fade, increases in interfacial resistance, and cell failure. 5,6 To mitigate these deleterious reactions, it is imperative to understand the structure and dynamics of the SEI layer in situ. Typically, studies of the SEI are performed ex situ, after cycling and washing to remove residual salt and solvent species. These washing steps remove chemical constituents and inevitably change the SEI chemistry by increasing the relative fraction of insoluble SEI components at the expense of other, soluble, species.
In this letter, we detail studies to explore the porosity and concentration of species within an SEI layer grown on amorphous silicon and probed, in situ, using neutron reflectometry. 7–9 Neutron reflectometry (NR) measures the specular reflection of neutrons from a thin film heterostructure as an interference of neutron waves reflected from the hidden interfaces down to the substrate as a function of the wave vector transfer, Q = 4πsin(θ)/λ, perpendicular to the sample surface. The angle of incidence θ is between the incoming neutron beam and the sample surface, and λ is the wavelength of the neutron. Analyzing the neutron reflectivity gives us information about the thickness and composition of the film layers with a depth resolution of 0.5 nm. More critically for this work, neutrons are extremely sensitive to H, Li, C, O, P, F and B, while penetrating through thick-walled vessels with little beam attenuation. It is possible, through the choice of isotopes 1H/2H, 6Li/7Li, 10B/11B, one can ascertain SEI components analogous to isotope labeling within an NMR In this work, we formed an SEI with a standard electrolyte, then exchanged this electrolyte for one with a high concentration of a neutron contrast agent (LiBF4) to measure the porosity and structure of the SEI with a high sensitivity.
Experimental
The thin film working electrode for NR studies was deposited by magnetron sputtering on a 51 mm diameter silicon substrate (Institute of Electronic Materials Technology, Warszawa, Poland). Silver epoxy (Illinois Tool Works) was placed on the edge of the Si wafer to contact the Cu, which was spilled around the wafer during deposition. A 20 nm Cu layer was deposited via magnetron sputtering at a process pressure of 7 mTorr with an argon flow of 55 sccm (99.9995%, Air Liquide) from a 99.99% pure copper target (Kurt J. Lesker). The Si films were immediately deposited in the same chamber without breaking vacuum at an applied power of 90 W, at 7.5 mtorr Ar (99.9995%, Air Liquide) Si (99.99% intrinsic silicon 2'' diameter- Kurt J. Lesker).
The electrochemical cell was constructed using film as the working electrode and the Li-coated TiZr as the counter electrode (half-cell type configuration). The components were assembled in a He filled glove box located at the neutron beamline (H2O < 1 ppm; O2 < 2 ppm) prior to the experiment. The electrodes were separated by a Teflon coated Viton O-ring with a 0.8 mm cross sectional diameter. The total cell volume is approximately 2.5 ml. The Li counter electrode was prepared using Li-foil (Alfa Aesar–0.75'' wide), which was scraped to remove surface passivation and pressed onto a machined TiZr substrate in the glove box. Initial electrolyte was 1.0 M LiPF6 EC/EMC (Ube Industries). The second electrolyte was homemade 2.0 M LiBF4 with 3:7 by weight EC/EMC. To prepare the electrolyte EC (Aldrich—99% Anhydrous) was added to a dried centrifuge tube in an argon filled glove box. A corresponding mass of EMC (Aldrich −99%) was added to the centrifuge tube along with about 3 grams of zeolite 3 A and strips of scraped Li foil to dry and prepare the solvent solution. After 6 d a fraction of the dried solvent was transferred to a dried Nalgene bottle and a corresponding amount of LiBF4 (Aldrich–99.99% ultra dry) was added. It took roughly 1 d to dissolve. This electrolyte was transferred to a polypropylene syringe (dried 110 °C for 1 d).
The electrochemistry was controlled using a Biologic VSP potentiostat. Upon completion of the first lithiation a syringe pump was used to pump the homemade electrolyte into the liquid port on the top of the cell at a rate of 4 ml h−1. Images of the exchange set up are shown in Supplemental Fig. 1 (available online at stacks.iop.org/JES/168/060523/mmedia) along with a schematic cross section of the electrochemical cell. To avoid siphoning the receiving vessel was located above the electrochemical cell. Also care should be taken by those repeating this experiment due to the generation of tritium from neutron exposure. The potentiostat was used to control the data acquisition from the reflectometer. NR measurements were carried out on the Liquids Reflectometer (LR) at the Spallation Neutron Source (SNS) at Oak Ridge National Laboratory. The LR is a horizontal geometry instrument using the time-of-flight technique with an effective single bandwidth of 3.5 Å at an accelerator pulse frequency of 60 Hz. For these measurements, neutrons of wavelength 2.5 Å to 17 Å, together with four incidence angles θ = 0.60°, 0.69° 1.19° and 2.34°, provided a wave vector transfer (Qz ) range extending from 0.008 Å−1 to 0.20 Å−1. An incidence beam slit was adjusted for each incident angle in order to maintain a constant footprint on the sample.
NR data analysis
In this work the films consist of 5 mm thick Si substrate with its native SiOx passivation layer, a copper current collector, the amorphous Si working electrode, the SEI layer in contact with the bulk electrolyte. Modeling the neutron data involves the generation of a heterostructure model of layer thickness and composition. In this study, the thickness and composition of the silicon working electrode was estimated from electrochemistry data and the linear variation in silicon thickness with lithium content to improve the validity of the starting model. The reflectivity data was obtained from the raw data using the Mantid reduction software. 10 The measured reflectivity was modeled using the Motofit program, 11 following the procedure described in previous studies. 5 An additional constraint was added to the fitting procedure described in the above reference to make use of the established relationship between the scattering length density (SLD) of the LixSi layer and its thickness. 9,12 SLD is a representation of the scattering power of the layer. The scattering length density profile corresponds to the composition and density of the layers normal to the film surface and can be represented mathematically by SLD(z) = ⅀bini(z) where bi is the coherent neutron scattering length and ni the nuclear number density of a given atomic species at depth z within the film. The SLD is measured in units of 10–6 Å−2. For simplicity we will omit the units of SLD in the discussion. For this purpose, the measured thickness of the silicon electrode is used to obtain the ratio x in LixSi (Eq. 1):

where D is the silicon thickness, D0 is the initial silicon thickness before lithiation, VSi is the volume of the Si atom, and VLi = 14.7 Å3 is the increase in volume for each Li atom added to the Si volume. 12 The SLD of the silicon electrode can then be obtained with Eq. 2:

where bSi and bLi are the coherent scattering lengths of the Si and Li, respectively.
Before measuring the film in the cell, a reflectivity measurement was done on the as-prepared film in air to determine the initial amorphous silicon thickness (D0 above) and SLD. The value of VSi in the equation above was then determined using the amorphous silicon SLD measured in air. While modeling the film for our in situ measurements, the SLD of the silicon electrode was fixed according to its thickness using the equations above, thus removing the SLD of the silicon as a fit parameter.
The fit results obtained were also validated using the Refl1D fitting software. 13 Like Motofit, Refl1D also uses the Abeles formalism 14 to model the reflectivity from a layered film. It uses a Markov Chain Monte Carlo approach to minimization and produces a probability distribution for the model parameters. 15 Uncertainties can be extracted from those probability distributions. We compared the output of Motofit and Refl1D for all our fits and found them to be in good agreement within errors.
Results and Discussion
To probe the interfacial chemistry the SEI was formed using standard 1.0 M LiPF6 ethylene carbonate/ethyl methyl carbonate (EC/EMC − 3:7 wt%) then the electrolyte was slowly exchanged with a 2.0 M LiBF4 electrolyte in the same 3:7 EC/EMC solvent. The large scattering length of boron was envisioned to provide a direct measure of porosity as a function of depth within the SEI. The silicon was lithiated in a half cell configuration with a lithium metal counter electrode mounted onto a Ti0.47Zr0.53 (TiZr) alloy plate located 1 mm above the working electrode (20 cm2). The amorphous silicon electrode was vapor deposited on a silicon wafer with a 20 nm copper interlayer which acted as a diffusion barrier, current collector, and contrast layer between the silicon substrate and silicon working electrode (see Supplemental for complete experimental details). Figure 1 shows the electrochemical voltage profile as a function of time for this exchange experiment and the corresponding neutron data collection points as indicated with the (x). The cell was charged at a rate of C/2 to 0.06 V (vs Li/Li+) at a constant current/constant voltage cycling protocol until the current dropped to a rate of C/10. NR data were always collected in an open circuit condition. OCV data were collected during the exchange reaction but no active current control was applied to the cell; at the end of the exchange NR data were collected. The cell was then cycled at a rate of C/2 and the NR data were collected in the rest state. Data collection took approximately 15 min per reflectivity data set.
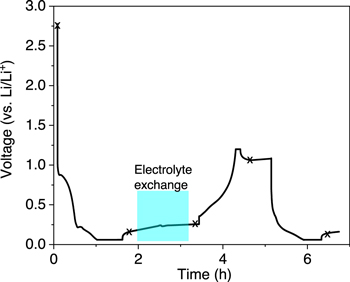
Figure 1. Voltage profile during neutron reflectivity measurements. (x) marks the point the reflectivity measurements were measured.
Download figure:
Standard image High-resolution imageFrom Fig. 1, the cell has a steady open circuit voltage (OCV) of 2.7 V consistent with a lithium free silicon anode vs lithium metal. Figure 2 shows the measured NR data along with the corresponding fits to the data measured at the various potentials marked with (x) in Fig. 1. Figure 3 shows a graphical representation of the scattering length density, obtained after the fit to the data in Fig. 2, as a function of distance from the silicon substrate to the bulk of the electrolyte. Table I summarizes the refined values during all of the fits.

Figure 2. Reflectivity of the various samples as a function of Q (open circles) along with fits to the data (black solid lines).
Download figure:
Standard image High-resolution image
Figure 3. Scattering length density (SLD) as a function of distance from the substrate.
Download figure:
Standard image High-resolution image
Table I. Summary of refined thickness and SLD's for the various layers.
| Salt and potential | aSi (Å) | aSi SLD (x10−6 Å−2) | SEI (Å) | SEI SLD (x10−6 Å−2) | Electrolyte SLD (x10−6 Å−2) | χ2 |
|---|---|---|---|---|---|---|
| In Air | 365.0 ± 0.4 | 1.66 ± 0.03 | — | — | — | 3.89 |
| LiPF6 OCV | 376.2 ± 1.4 | 1.60 ± 0.04 | 110.3 ± 2.9 | 1.03 ± 0.06 | 1.30 ± 0.08 | 3.64 |
| LiPF6 0.06 V | 976.0 ± 11.8 | −0.54 ± 0.05 | 167.6 ± 13.3 | 0.74 ± 0.37 | 1.34 ± 0.39 | 2.51 |
| Exchange to LiBF4 0.06 V | 940.1 ± 10.8 | −0.49 ± 0.05 | 115.0 ± 5.4 | 0.44 ± 0.23 | 1.39 ± 0.16 | 2.24 |
| LiBF4 1.2 V | 422.5 ± 2.1 | −0.20 ± 0.05 | 146.2 ± 3.6 | 1.92 ± 0.14 | 1.48 ± 0.21 | 8.78 |
| LiBF4 0.06 V 2nd Lithiation | 1026.3 ± 7.0 | −0.56 ± 0.04 | 206.9 ± 13.2 | 1.63 ± 0.39 | 1.40 ± 0.49 | 4.88 |
At OCV the amorphous silicon has a thickness of 365 Å. On top of the silicon layer is a 110 Å condensed layer with a reduced scattering length density. This layer forms in less than an hour during cell build, transport to the beamline and sample alignment. This condensed layer is due to the segregation of lithium ions from the electrolyte on the silicon working electrode and represent the very initial stages of SEI growth and has been reported previously. 5,6,16–19 Furthermore, these thicknesses are consistent with what was reported previously. This Li-rich layer is thicker than what would be expected for a classic condensed double layer and the physics of this condensed layer is poorly understood. Finally, there appears to be a small change in the Cu structure with application of a potential. This has been observed before and is due to motion of atoms at the interface.
Upon lithiation the voltage profile shows a feature at 0.8 V, attributed to SEI formation, and a second feature at 0.2 V associated with the lithiation of the amorphous silicon, followed by a sloping profile to 0.06 V due to further lithiation. The reflectivity data collected for this potential showed the silicon layer expanded from 376 Å to 976 Å while the SLD value decreased from 1.60 to −0.54. This expansion of the thickness and the reduction of SLD are consistent with the insertion of lithium, which has a negative value of the SLD of −1.90. From the electrochemistry we estimate a Li–Si composition of Li15Si4 which is consistent with the observed layer expansion and reduction of the SLD. The SEI thickness is consistent with previous reports using neutron reflectometry and a protiated electrolyte. 5
At this point the 1.0 M LiPF6 EC/EMC electrolyte was exchanged for 2.0 M LiBF4 EC/EMC electrolyte. 6.0 ml of the LiBF4 electrolyte was pumped through the electrochemical cell using a syringe pump at a rate of 4 ml h−1. This was 2.5 times more electrolyte than was contained in the cell. Reflectivity data was collected after this exchange. The data showed subtle, but significant changes in the SEI. The SEI thickness reduced from 168 to 115 Å indicating about 1/3 of the SEI composition was easily removed. The best fit for the SEI SLD reduced from 0.74 to 0.44 but remains statistically the same given uncertainties. Note, the thickness of the SEI is similar to the value at OCV but the SLD is significantly different indicating a totally new chemistry. A reduction in the SEI SLD is due to changes in the composition of the SEI layer or a reduction in the SEI density. There are several possibilities that could result in a change in SEI chemistry. The SEI could be gaining a large concentration of lithium ions which have a large negative neutron scattering length (−1.90). However, this is chemically implausible due to the need to have an associated counter ion (BF4 −) which has a much larger scattering length and would bring up the average scattering length of the layer. In addition, concentrating simple Li salts like LiF (SLD = 2.2), Li2CO3 (SLD = 3.5), or Li2O (SLD = 0.8) would increase the average SLD of the reaction layer due to their higher SLD value than the SEI. The cell could be losing pure C–O functionality (SLD of C and O are 6.64 and 5.80, respectively) leaving behind excess H (SL = −3.74). But again, this seems implausible as this would require a mechanism where hydrogen is selectively stripped from solvent and added to conjugated bonds in the SEI while removing CO2 or CO. Finally, the P–F salt species could be selectively removed (SLD of P and F are 5.13 and 5.6, respectively) by the washing. This selective removal of P–F is consistent with XPS studies of washed silicon electrodes where the reported values of P containing species are about 1–2 atomic percent despite accounting for a mole fraction of 7.5% in the bulk electrolyte. 5,20–28 This selective removal would indicate that the salt species in the SEI are poorly bound and easily exchanged, or removed, with time or exposure to fresh solution. Finally, while the SLD of the new LiBF4 electrolyte is slightly higher than the original LiPF6 electrolyte there does not seem to be significant infiltration of the LiBF4 into the SEI which would indicate a low level of porosity.
A thickness change in the SEI with washing was also observed. This would be consistent with the removal of P–F species along with a fraction of the soluble organic species within the SEI. Recent gradient washing experiments show that a significant fraction of the SEI on silicon can be removed with polar solvents like EC/EMC. 29 The removal of a third of the passivating layer and the P–F species degrades the passivation layer. As a result, the thickness and SLD of the amorphous silicon is reduced by about 36 Å while the SLD increased by 0.05. This is consistent with the self-discharge of the silicon anode as the reducing lithiated anode reacts with the new electrolyte causing a reduction in the total lithium content of the silicon anode. Together, these results indicate that the SEI is highly solubilized by the new electrolyte but there is little porosity. A layered SEI model was evaluated when modeling the reflectivity in order to assess the presence of structure within the SEI. Such a model was not found to improve the quality of the fit. The SEI layer is consistent with a rough or diffuse layer with no evidence for a layered structure in either the lithiated SEI or the exchanged SEI.
Further cycling of the cell after electrolyte exchange reveals the removal of most of the lithium incorporated into the amorphous silicon layer as indicated by the electrode thickness decreasing to 423 Å while the SLD increased to −0.20 which is consistent electrochemically with a ratio of LiSi. Upon delithiation the SEI thickness and SLD increased to 146 Å and 1.92 respectively. This thickness increase is consistent with the reported "breathing" of the SEI where the thickness expands upon delithiation due to decomposition of solvent molecules and condensing of the resulting products resulting in a higher SLD from the C–O species. The expansion observed for the exchanged electrolyte are roughly 20% as large as those observed for 1.2 M LiPF6 EC/DMC electrolytes (~300 Å). This would indicate that the removal of the P–F species, along with the different reactivity of BF4 − salts play a role in the extent of the organic solvent decomposition reactions. Together, this points to the salt as playing a major role in the observed instability of the SEI through its poor binding within the SEI. Upon relithiation of the silicon to Li15Si4 (based on electrochemistry and SLD/electrode thickness) the SEI expands to 207 Å along with a commensurate decrease in the SLD to 1.6 consistent with the incorporation and decomposition of salt and the incorporating of Li from the salt. Again, there is no evidence of a SEI heterostructure with lithiation indicating compositional homogeneity within the SEI. The SLD profile showing uncertainties obtained with refl1d is shown in the supplemental section (cf S2) to highlight the fact that the SLD profile of the SEI is well established even if the quality of the fit is not as good for this particular data set. Note that the SLD of the amorphous silicon layer was bound to a range compatible with the integrated current applied during delithiation, which resulted in a fit with a larger chi2 for the 1.2 V data set. As a cross-check, the refl1d fit presented in the supplemental section (Fig. S2) was obtained by letting the SLD unbounded. The two approaches yielded compatible results.
This data demonstrates the relatively ease of SEI degradation through the selective removal of salt species within the SEI and the removal of potentially soluble species within the electrolyte. As a result, this reveals that one of the keys to developing SEI stability is to prevent the removal of anion species possibly through the introduction of larger anions that would have less mobility. Second, the diffusivity of soluble species seems to be a major scientific question and an area of research beyond traditional FEC and VC additives which are hypothesized to lead to more polymerized SEI chemistries. Third, we don't see evidence for a clear heterostructure formation upon the first lithiation step for silicon electrodes. Instead, reports of the silicon SEI heterostructure may be artifacts of washing processes leaving behind insoluble chemical species.
Acknowledgments
This work (GMV, KB) was supported by the US Department of Energy's (DOE) Office of Energy Efficiency and Renewable Energy through the Vehicle Technology Office (Brian Cunningham Program Manager). A portion of this research used resources at the Spallation Neutron Source (Liquids Reflectometer), a DOE Office of Science User Facility operated by Oak Ridge National Laboratory (MD, JB). This manuscript has been authored by UT Battelle LLC under Contract DE-AC05-00OR22725 with DOE. The US government retains and the publisher, by accepting the article for publication, acknowledges that the US government retains a nonexclusive, paid-up, irrevocable, worldwide license to publish or reproduce the published form of this manuscript, or allow others to do so, for US government purposes. DOE will provide public access to these results of federally sponsored research in accordance with the DOE Public Access Plan (http://energy.gov/downloads/doepublic-access-plan).