
Abstract
Diffusion induced stress, due to repeated intercalation/deintercalation of lithium during cycling, causes mechanical degradation in graphite active particles used as an anode in lithium-ion batteries. The microcracks formed in the active particles hinder diffusion of lithium. On the other hand, flow of electrolyte through the accessible microcracks in the active particles leads to additional electrochemically active surfaces and effectively reduces the diffusion length. In this work, stochastic modeling of electrochemistry-mechanics interaction is presented which introduces the influence of electrochemically active microcracks on electrochemical reactions. Enhanced electrochemically active surface area further results in the formation of solid electrolyte interphase (SEI), which decreases the cell capacity due to the consumption of cyclable lithium. This stochastic model successfully predicts the formation of non-uniform and spanning cracks in active particles, which are typically observed in scanning electron micrographs. The impact of coupled electrochemical and mechanical interaction in graphite active particles on capacity fade is elucidated.
Export citation and abstract BibTeX RIS

This is an open access article distributed under the terms of the Creative Commons Attribution Non-Commercial No Derivatives 4.0 License (CC BY-NC-ND, http://creativecommons.org/licenses/by-nc-nd/4.0/), which permits non-commercial reuse, distribution, and reproduction in any medium, provided the original work is not changed in any way and is properly cited. For permission for commercial reuse, please email: oa@electrochem.org.
Dependence on fossil fuels to match the increasing energy demands of the industrially and technologically advancing world can have grave consequences for the future generations. The present fossil fuel focused energy production, supply and distribution practices are exerting severe pressure on the environment and hence cannot be continued indefinitely.1–4 Hence, in the past decade, a lot of emphasis has been placed on renewable energy sources and thereby on investigating and commercializing different energy storage systems.5–8 Lithium ion battery (LIB) is a result of such research efforts. Owing to its enhanced performance, longer cycle life and low self-discharge rates, LIBs have emerged as a probable solution to the energy storage problems.9,10 The present day electric vehicles (EVs) and plug-in hybrid electric vehicles (PHEVs) use batteries constructed based on the lithium ion chemistry due to its high energy and power density.11 Despite these promising features, the service life of LIB systems is considerably limited by the degradation of active electrode material upon repeated charge-discharge cycles.12–14
Electrochemical and mechanical degradations in LIB electrodes have been identified as the key factors limiting the life and performance of LIBs.15–17 The gradient in concentration profile that develops within the electrode active particles during the transport of lithium, gives rise to diffusion-induced stress (DIS).18,19 Mechanical degradation is the formation of microcracks and subsequently spanning cracks within the active particle due to the DIS.20 On the other hand, for proper stabilization of active material with respect to the electrolyte, formation of a SEI layer is essential.21 However, the total amount of SEI that forms on top of graphite cannot be controlled, and cyclable lithium gets consumed within the SEI layer effectively leading to capacity fade.22,23 In the present manuscript, this continued growth of SEI layer has been considered as the major contributor to the electrochemical degradation. However, the mechanical and electrochemical degradations within LIBs are not completely isolated from each other.24,25 The main aim of this manuscript is to elucidate the coupling between the two major forms of degradation mechanisms within lithium ion batteries, and decipher their impact on the overall capacity fade.
The microcracks can affect the cell performance in two opposing ways:
- (a)Positive effect: Microcracks spanning from the surface of the particle are exposed to electrolyte and are electrochemically active thereby reducing the diffusion length and facilitating the transport of lithium; thus improving cell performance.
- (b)Negative effect: Microcracks that are interior to the active particle are electrochemically inactive and obstruct lithium diffusion; deteriorating cell performance. Also, microcracks connected to the surface provides fresh domain for SEI formation and subsequently loss of cyclable lithium, which eventually leads to loss of capacity.
Depending on the microcrack pattern formed, either of the above effects can dominate. Upon repeated charge-discharge cycles, there also exists a possibility of the active particle breaking off into smaller particles, which may get electronically isolated from the electrode microstructure due to poor contact with conductive additives. However, in the present research particle-isolation has not been taken into consideration. Thus, disintegration of the active particle can lead to significant irreversible loss of capacity.26,27
Improving the energy and power density as well as life span of lithium-ion battery systems has been the key research emphasis lately. In that direction, fundamental understanding of the mechanisms underlying the degradation phenomena observed in the battery electrodes is of prime importance.28 Several studies to understand the chemical and mechanical degradation mechanisms have been carried out over the last few decades. To understand the capacity fade observed in LIBs over hundreds of cycles, scientists had a fair amount of idea about the formation of SEI films on top of the active materials.15 However, more detailed models to incorporate the impact of SEI film formation on the performance of the battery has been developed later.23,29–31 There also exist models that incorporate the transport of reactive species through the SEI film and subsequent impact on the performance of LIBs.32,33 Christensen and Newman conducted the pioneering work for quantifying mechanical stress generation in active particles during lithium intercalation.19,34 It was observed that smaller particle size and larger aspect ratio reduces the DIS in the particle resulting in better performance.35–37 Presence of transgranular cracks in graphite and LiCoO2 active particles was pointed out by the SEM and TEM images of cycled electrodes,38–40 which has also been demonstrated in Figure 1a. An electrochemical shock map, developed by Woodford et al., helped to predict the onset of failure based on the C-rate, particle size and the fracture toughness of the active material.41 Cheng and Verbrugge proposed a dimensionless number, which is equivalent to Biot number in heat-transfer, and demonstrated that the microcrack initiation is solely governed by this dimensionless number.18 The fracture of electrodes of LIBs operated at high currents was investigated by Zhao et al.42 Impacts of SEI growth and mechanical degradation on the electrochemical impedance spectra (EIS) have also been investigated by Chen et al.43,44
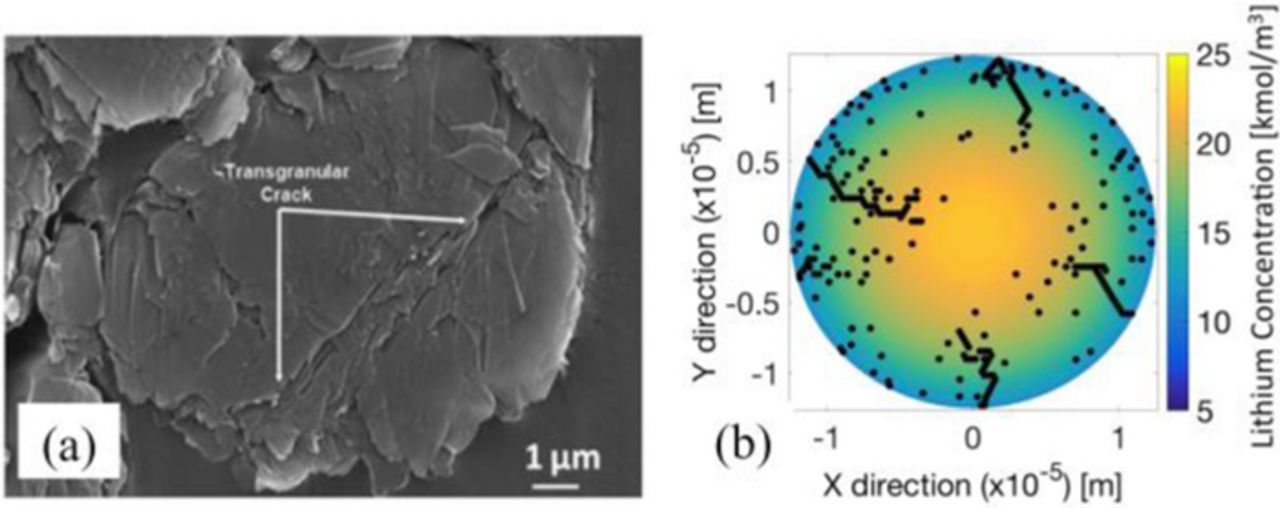
Figure 1. (a) SEM image of a spanning crack observed experimentally inside a graphite active particle (adopted from Harris et al.38). (b) Demonstration of formation of surface cracks according to the model developed by Barai and Mukherjee.37 The model developed by Barai and Mukherjee cannot capture the formation of spanning cracks that usually occur within the graphite particles. Aim of the present study is to understand the formation of spanning cracks and capacity fade experienced by graphite active particle though the appropriate coupling between electrochemistry and mechanics.
To the best of author's knowledge, most of the computational models developed to study mechanical degradation so far neglect the electrochemical reactions taking place in the newly formed microcracks linked to the particle surface. But as the SEM images of graphite and TEM images of LiCoO2 show, the microcracks give rise to large new surface areas, which if exposed to the electrolyte can significantly contribute to the lithium generating/consuming electrochemical reactions.38,40 Most of the computational models developed for analyzing the formation and growth of SEI layer does not incorporate the increase in active particle surface area due to microcrack formation. However, few computational techniques have been implemented in the recent past, that incorporates the coupled impact of mechanical degradation and SEI formation on the overall capacity fade experienced by LIBs, in a phenomenological fashion. Among them, Deshpande et al. developed a model that simulates the loss of capacity owing to the formation and growth of SEI layer over the microcrack surface.24 Xu et al. adopted the model developed by Deshpande et al. and investigated the loss of capacity due to crack propagation on the negative electrode.45 Narayanrao et al. developed a phenomenological model to capture the increase in electrochemically active surface area due to microcrack formation, and incorporated it within a porous electrode model for investigating the capacity fade over multiple cycles.46 While all the models mentioned above rudimentarily account for the increase in the solid particle – electrolyte interfacial area, they do not account for the electrochemical reactions at the microcrack surfaces that contribute to the lithium flux acting on the particle.
During lithiation-delithiation processes, transport of lithium within the solid active particle gives rise to large concentration gradients, which imparts huge diffusion induced tensile/compressive force on the particle.18,19,37 Microcracks evolve in domains of the active particle that experience tensile force.47 Coalescence of these microcracks gives rise to spanning cracks within the active particles. Nucleation of microcracks is usually not observed under compressive force. Flow of electrolyte is possible through the crack fronts that are connected to the surface of the active particle.24,48 Penetration of electrolyte inside the active particle not only leads to reduction in diffusion length for lithium transport, but also facilitates the growth of SEI at these fresh active particle surfaces.45
Quantification of stresses in electrode particles coupled with electrochemistry has been investigated, from the standpoint of single particles, by several groups.18–20 Dependence of diffusion-induced stress on particle geometry has been demonstrated by Sastry and coworkers for isolated particles.35,49 Few works have incorporated phase change, anisotropic swelling and grain boundary effects to understand its effects on the mechanics of single particles.50–52 In a functioning electrode, the particles are combined into a complex network of particles that provide significant mechanical constraint to any given particle. On swelling, these network constraints can significantly increase the stress in the particle, impacting fracture behavior. Consequently, recent works have focused on analyzing realistic electrode microstructures incorporating particle contact, binder morphology and its effects on stress.53–55 The advancement of synchrotron X-ray tomographic reconstruction techniques as well as focused ion-beam scanning electron microscopy (FIB-SEM) have enabled accurate reconstruction of electrode architectures on which coupled electrochemistry-mechanics simulations can be performed to scale up particle level stress analyses to the electrode level.56–64
For a more realistic prediction of the effect of mechanical degradation on cell performance and growth of SEI layer, it is necessary to include the electrochemical reaction within the microcracks that are connected to the surface of the particles. The stochastic computational model developed by Barai and Mukherjee37 to capture the formation and nucleation of microcracks within graphite active particles due to diffusion-induced stress[37], has been adopted here. In that article, the authors were able to capture only surface cracks during repeated delithiation-lithiation processes, which has been demonstrated in Figure 1b. On the contrary, SEM images of active particles show presence of spanning cracks after multiple cycles (see Figure 1a).38 The primary objective of this study is to extend the mathematical model developed by Barai and Mukherjee37 to understand the effect of mechanical degradation on the cell performance and capacity fade. The effects of electrochemical reaction and SEI growth on the microcracks, which are connected to the particle surface, have also been incorporated. It will be investigated whether the coupled electrochemical-mechanical model can successfully capture the formation of spanning cracks within the active particles. Competition between mechanical degradation and SEI growth on the overall capacity fade during the initial few cycles of the cell, at different operating conditions, will also be explored.
Computational Methodology
The combined impact of mechanical and electrochemical aspects on the overall capacity fade experienced by the lithium-ion cell has been investigated through computational means. The different physicochemical phenomena that has been solved to capture the lithiation-delithiation process and subsequent capacity fade within the graphite active particles are as follows:
- (a)Transport of lithium inside graphite as a single-phase diffusion process.
- (b)Mechanical expansion, diffusion-induced-stress generation and crack nucleation-propagation within the graphite active particles.
- (c)Electrochemical reduction of lithium at the active particle surface which gives rise to the reaction current.
- (d)SEI formation at the active-particle/electrolyte interface results in loss of cyclable lithium and increase in electronic resistance, which leads to effective capacity fade.
Details of the computational models developed to capture each of the physical and electrochemical phenomenon will be discussed in the following paragraphs.
Transport model
Following the assumptions justified by the Single Particle Model,65–67 each electrode has been assumed to consist of uniformly sized spherical intercalation particles.65,66,68,69 Ionic conductivity of the electrolyte has been assumed to be very high, resulting in negligible lithium ion concentration gradient in the electrolyte phase. Hence, constant galvanostatic current has been assumed to act upon the active particle from all directions.
Electrochemical reactions take place at the active particle – electrolyte interface. The rate of electrochemical reactions depends on the rate at which current is drawn from the battery (C-rate). During the discharge process, lithium from the anode active particle is consumed by the electrochemical reactions and is transported, via the electrolyte, to the cathode. During the charge process, the direction of lithium transport is opposite. Lithium generated/consumed by the electrochemical reactions must diffuse through the active particle. As the ionic conductivity of the electrolyte is assumed to be very high, diffusion of lithium inside the active particle will limit the capacity of the cell. Exact mechanism of lithium transport within graphite is considered to be a combination of single-phase and two-phase diffusion process.70 Several generalized computational models have been developed that took into consideration the effect of these individual lithiated graphite phases, and tried to capture the transport of lithium considering gradient in chemical potential as the major driving force.70,71 However, for the present purpose of determining the diffusion induced stress, and capturing the subsequent fracture within graphite active particles, majority of the research articles considered single phase diffusion of lithium, where concentration gradient acts as the driving force for lithium transport.20,72 Diffusion of lithium within the active particle has been assumed to be governed by the Fick's second law.69,73,74 It has been argued by several researchers that the impact of hydrostatic stress on the chemical potential can significantly affect the diffusion of lithium.35,75 However, in the present context, since transport of lithium in graphite anodes are being modeled that experience very low volume expansion, around 5% approximately,20,38 the impact of hydrostatic stress on the diffusion of lithium can be neglected altogether. Hence, the Li ion concentration in the active particle has been calculated using the following equation:
![Equation ([1])](https://content.cld.iop.org/journals/1945-7111/165/5/A1064/revision1/d0001.gif)
Depending on the process (charge/discharge) being simulated, the initial concentration of lithium inside the active particle, cini, is fixed.
![Equation ([2])](https://content.cld.iop.org/journals/1945-7111/165/5/A1064/revision1/d0002.gif)
Constant lithium mass flux  as a result of the constant galvanostatic current(I) from all directions provides one boundary condition. The other boundary condition is obtained by noting the symmetry of the problem that results in zero mass flux of lithium at the center.
![Equation ([3])](https://content.cld.iop.org/journals/1945-7111/165/5/A1064/revision1/d0003.gif)
![Equation ([4])](https://content.cld.iop.org/journals/1945-7111/165/5/A1064/revision1/d0004.gif)
In the Eqs. 1–4 specified above,  and ci indicates lithium concentration within the graphite active particle,
  and Di indicates the diffusivity of lithium atoms through the active particle, t indicates time, x and y denotes the two Cartesian coordinates, and finally R represents the particle radius. Initially, only the surface of the particle is electrochemically active and hence, responsible for lithium mass flux. But when coupled with a mechanics model for the electrode, microcracks emanating from the surface penetrate into the particle forming new active particle-electrolyte interface. The electrochemical reactions taking place at these interfacial regions start contributing significantly to the lithium mass flux. This lithium mass flux has been captured in our model by introducing lithium source/sink terms, called electrochemical reaction terms, in the concentration equations at the respective mechanically damaged concentration control volumes. It should be noted that lithium transport across the damaged cell is possible due to the limited thickness of the crack front. The particles are three-dimensional, and diffusion of lithium occurs around the crack pathway. The diffusion coefficient within a damaged cell decreases by a certain factor, denoted by α in the present context.37 Consistent with earlier publications, α ∼ 0.85 has been considered in the present research.37,68
Modifying the energy balance method outlined by Incropera and Dewitt76 to suit mass transfer application relevant here, the generic discretized equation for a 2D concentration control volume is as shown below in Eq. 5. Grid independence study has already been performed for this computational system, which were reported in some of the earlier publications.36,68 Striking a balance between computational accuracy and computational time, a grid size of 60 × 60 is used for simulations discussed in this paper. Same mesh resolution has been adopted for both mechanics and diffusion solve.
![Equation ([5])](https://content.cld.iop.org/journals/1945-7111/165/5/A1064/revision1/d0005.gif)
Where Di, j is the diffusion coefficient, ci, j is the lithium concentration, Ax and Ay are cross sectional areas for diffusion normal to x & y axis respectively for the control volume (i, j). japplied is the lithium flux term acting over the electrochemically active area Asurf of the control volume while jgen is the electrochemical reaction term that acts over the control volume Vcv. Depending upon the type of control volume, the above equation can be further simplified. For an undamaged boundary control volume, the electrochemical reaction term will be zero. The above equation satisfies the conservation of mass locally, thereby guaranteeing global mass balance. For an internal control volume having a microcrack passing through it, the flux terms will be zero while the electrochemical reaction term will have a finite value (see sub-section Coupling between the transport and mechanics models for details). For an internal control volume without any microcracks, both the flux and electrochemical reaction terms will be zero.
Mechanics model
In order to capture the mechanical degradation in the battery electrodes, Barai and Mukherjee developed a stochastic methodology that is based on random lattice spring model.37,77,78 In the current study, we adopt this mechanical model and couple it with the transport model described above. The model considers the active particle as a grid of lumped point masses, each connected to its immediate neighbors by springs. Each lumped mass at the node is connected to six neighbors forming a triangular grid.
The axial and shear stiffness of each of the spring elements have been determined by equating the total energy stored in a lattice spring network (ULSM) with the strain energy stored in two-dimensional continua (UContinuum).78,79 Since, the lattice spring network effectively represents the two-dimensional continuum, their strain energies should be the same. It should be noted that ULSM is a function of the axial (kn) and shear (ks) stiffness of each spring. First derivative of this energy term with respect to local strain results in an expression of the local stress term  .78,79 Second derivative of the energy component with respect to local strain provides mathematical expressions for the elastic stiffness
  .79 Exact magnitudes of the axial and shear stiffness (kn, ks) of each spring have been determined by equating the second derivatives of energy (Cijkl) with the elastic stiffness obtained from the continuum elastic moduli (such as, Young's modulus, Poisson's ratio etc.).78,79 The elastic stiffness of the two dimensional continuum have been estimated using the plane-stress considerations. Hence, the axial and shear stiffness values used in the lattice spring model correspond to that of plane stress conditions. The assumption of plane stress can be justified by keeping in mind that lithiation/delithiation of the circular computational domain happens from all the directions in the two dimensional plane. There is no constraint preventing its deformation in the third (out-of-plane) direction, which leads to stress free deformation along the thickness direction. Existence of zero stress along the third direction leads to the plane stress assumption.
The non-uniform volume expansion due to intercalation/de-intercalation of lithium into the active particle gives rise to deformation in the springs.20,37 The loading on each spring is assumed to be directly proportional to the local lithium concentration gradient and partial molar volume of the diffusing species.36,37,68,80 By assuming quasistatic physical process, the equilibrium force distribution can be calculated. The force distribution is then used to obtain the strain energy within the active particle. The range of threshold energy for the springs is decided based on theory of elasticity considerations. The threshold energy for the springs is then randomly distributed within that range. If the strain energy for a spring exceeds the threshold value, the spring is considered to be irreversibly broken. During this irreversible rupture of the lattice springs, they are completely removed from the network. For subsequent load steps, the network behaves as if there were no springs to begin with. This may have some issues during the compression process due to overlapping springs. We assume that the problems associated with overlapping of springs will be minimal because of the small deformation experienced by the graphite anodes being studied here.20 Detailed mathematical expressions pertaining to the mechanics solve have been provided in an earlier publication by the authors.37 Since, no modifications to the earlier computational model for microcrack formation have been conducted, the detailed mathematical expressions have been omitted in the present manuscript.
Once generated, the microcracks are then classified as electrochemically active or inactive depending on its location. If a microcrack emanates from the surface of the particle and forms a new active particle-electrolyte interface, the microcrack is called electrochemically active. On the other hand, if the microcrack is in the interior of the active particle and isolated from the electrolyte, the microcrack is termed as electrochemically inactive (more details will be provided in the Results and discussion section). It should be noted that the lattice spring model adopted in the present study for capturing evolution of crack is a simplified version of the conventionally used finite element method.81 Also several researchers have used this technique for understanding the propagation of microcracks within polycrystalline and disordered materials.77–79 But, due to its inherent simplicity, the adopted lattice spring model is not capable of capturing the exact crack pathway that would occur within realistic materials. However, the main purpose of our present research is not to predict the exact crack pathway, but to elucidate the impact of chemical and electrochemical reaction that can occur at the particle-electrolyte interface of the surface connected cracks.24,25 These reactions at the crack surface can enhance the transport of lithium by decreasing the effective diffusion length that may result in performance improvement, as well as consume cyclable lithium due to the formation of SEI resulting in capacity fade. The crack path generated by the lattice spring network is sufficient for realizing these chemo-mechano-electrochemical coupling phenomena that occurs inside graphite active particles during cell operation. The lattice spring technique also consumes significantly less computational resources as compared to full-blown finite element based schemes. Hence, the simplified fixed-grid lattice spring methodology has been adopted in the present study.
Coupling between the transport and mechanics models
Mechanics and electrochemistry are intricately coupled in the active particle. On one hand, the electrochemical reactions lead to concentration gradients that result in formation of microcracks. On the other hand, the microcracks aid or hinder diffusion of lithium thereby affecting the concentration gradient within the particle. To explain this coupling, we first consider the mapping between the transport and mechanics meshes. Once all the nodes have been categorized, the increase in the electrochemical area of the active particle and the magnitude of the electrochemical reaction terms, to be used in the transport model, can be calculated.
In order to simulate the coupling between mechanical degradation and electrochemical behavior of the active particles, it is important to locate the control volumes in the transport mesh that correspond to the broken spring elements in the mechanics mesh. For this purpose, a mapping function has been developed. For example, consider the schematic diagram shown in Figure 2. To the left, is shown the active particle with a single microcrack propagating from the surface. Each segment in the coarse triangular grid represents a spring element. The red segments, in particular, represent the spring elements that are broken. As the spring elements break, they provide a path for the electrolyte (represented by gray color) to enter into the particle. This electrolyte path is mapped into the transport mesh, represented by blue color, in the inset Figure - "Detail A." For this purpose, the coordinates of the center of the broken springs are calculated. These points are mapped to four nodal points having their x & y coordinates as the floor-ceiling combinations of the parent point. The bold blue nodes in detail A are the transport mesh images of the microcracks.
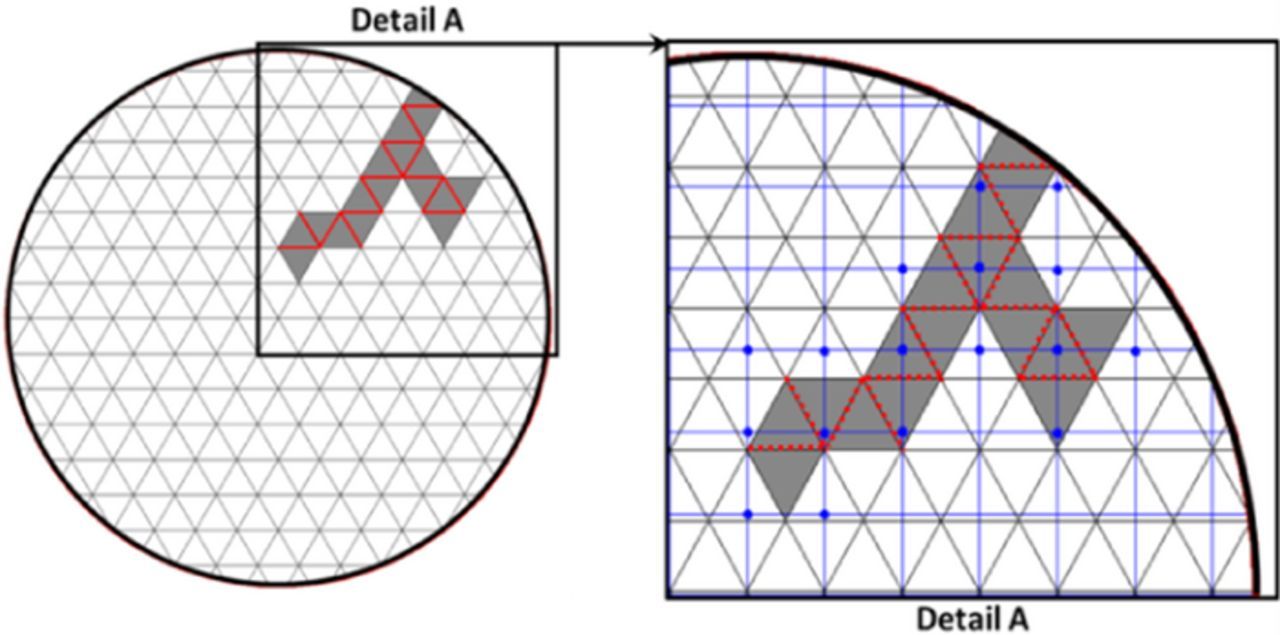
Figure 2. Triangular mesh has been used to solve for mechanics in the single particle while a square mesh (shown using blue colored mesh in "detail A") has been used to solve for transport of lithium. The correlation between the transport and mechanics meshes is shown in "detail A". A broken bond, if connected to the surface of the particle (as represented by red dotted lines in "detail A") allows the electrolyte to penetrate into the bulk of the particle (gray shaded area). The corresponding mapped nodes in the transport mesh (shown by blue dots in "detail A") are then assigned with appropriate lithium source/sink terms to simulate the flow of electrolyte and the resulting electrochemical reactions.
Next, we classify the nodes in the transport mesh based on the mechanical degradation in the control volume. In the following section, we use superscript 'e' to denote nodes that are exposed to the electrolyte. Let Nesurf be the total number of nodes that lie on the particle boundary and Nbulk be the (internal) nodes that lie within the particle boundary. Let subscript 'damaged' indicate that a node has a microcrack passing through its control volume and 'intact' indicate that its control volume is mechanically undamaged. Thus, Nbulk, damaged represents the number of internal nodes with microcracks passing through the control volume. Now if the microcracks passing through the control volume are connected to the particle boundary then despite being internal, these nodes are exposed to the electrolyte. Following our convention, they can be represented as Nebulk, damaged.
Next, we formulate the increase in electrochemical area due to microcrack formation. Initially (when time t = 0), only the surface area of the particle (Aeparticle − boundary) is electrochemically active. The total surface area of the particle (Ae) can be considered to be proportional to the number of control volumes that lie on the boundary of the particle.
![Equation ([6])](https://content.cld.iop.org/journals/1945-7111/165/5/A1064/revision1/d0006.gif)
After time t (t > 0), microcracks start propagating inside the particle. Now, along with the surface area of the particle, the surface connected microcrack-electrolyte interface also contributes to the electrochemically active area. Thus, the electrochemical area can now be considered to be proportional to the sum of control volumes that lie on the particle boundary and the control volumes with electrochemically active microcracks. Hence,
![Equation ([7])](https://content.cld.iop.org/journals/1945-7111/165/5/A1064/revision1/d0007.gif)
Applying unitary method gives,
![Equation ([8])](https://content.cld.iop.org/journals/1945-7111/165/5/A1064/revision1/d0008.gif)
This gives us a relation between the electrochemical area at time t and the surface area of the particle.
![Equation ([9])](https://content.cld.iop.org/journals/1945-7111/165/5/A1064/revision1/d0009.gif)
Hence, knowing the surface area of the particle, the electrochemical area at any time t can be calculated using Eq. 9.
For a constant current discharge, lithium mass flux, that is constant in all directions, must scale inversely with respect to the electrochemical area. As the electrochemical area increases, lithium mass flux must decrease to maintain constant current.
![Equation ([10])](https://content.cld.iop.org/journals/1945-7111/165/5/A1064/revision1/d0010.gif)
Hence, dynamic value of lithium flux can be calculated using the following equation.
![Equation ([11])](https://content.cld.iop.org/journals/1945-7111/165/5/A1064/revision1/d0011.gif)
Constant current is maintained within the single particle system in this process.
The magnitude of electrochemical reaction terms (japplied(t)) is determined by maintaining the mass balance. Total lithium that enters the particle per second at time t is represented by Eq. 12, where the total electrochemical area at time t (Ae(t)), is split into its components:
- Electrochemical area due to internal control volumes that are mechanically damaged and electrochemically active (Aemicrocracks∝Nbulk, damagede(t))
- Electrochemical area due to particle boundary control volumes (Aeparticle − boundary∝Nsurfe). These can further be classified based on the manifestation of microcracks as follows:
– Electrochemical area due to particle boundary control volumes that are intact (∝Nesurf, intact)
– Electrochemical area due to particle boundary control volumes that are mechanically damaged (Nesurf, damaged)
![Equation ([12])](data:image/png;base64,iVBORw0KGgoAAAANSUhEUgAAAAEAAAABCAQAAAC1HAwCAAAAC0lEQVR42mNkYAAAAAYAAjCB0C8AAAAASUVORK5CYII=)
![Equation ([12])](https://content.cld.iop.org/journals/1945-7111/165/5/A1064/revision1/d0012.gif)
In this model, we apply the electrochemical reaction terms at the electrochemically active damaged node to simulate the electrochemical reactions taking place. Thus, for mass conservation to be satisfied, the amount of lithium entering through the flux acting on the microcrack-electrolyte interface must be equal to the net amount of lithium generated/consumed by the volumetric electrochemical reaction terms.
![Equation ([13])](https://content.cld.iop.org/journals/1945-7111/165/5/A1064/revision1/d0013.gif)
Where,  is the summation of all the control volumes with electrochemically active microcracks. Thus, the magnitude of the electrochemical reaction terms (jgen(t)) is given by Eq. 14.
![Equation ([14])](https://content.cld.iop.org/journals/1945-7111/165/5/A1064/revision1/d0014.gif)
However, not all microcracks formed are exposed to the electrolyte and have electrochemical reactions taking place. The internal microcracks formed, on the contrary, hinder diffusion of lithium as the lithium atoms now have to take a tortuous path around the microcracks. This obstruction to lithium transport caused by the microcracks was accounted by Barai & Mukherjee, by introducing a damage parameter - crack effect (α).37,68 Crack effect is the fraction by which a microcrack reduces the diffusivity of the active material in its vicinity.
Solid-electrolyte-interphase model
Over the entire lifecycle of lithium-ion batteries, the reversible intercalation of lithium into the active particle constantly competes with other irreversible reactions, which typically take place at the negative electrode and consume lithium to form the SEI. At the beginning of life, the SEI formation actually protects the electrode against solvent decomposition and is desired. However, over cycling the irreversible reactions continue to gradually increase the SEI layer thickness resulting in irreversible loss of cyclable lithium or capacity fade. To couple this chemical degradation with the mechano-electrochemical model developed earlier, we modify the transport model to include the irreversible SEI formation reactions. Hence, the lithium ions in the electrolyte at the active particle-electrolyte interface now have two options, to either intercalate into the particle or to react with the active particle and form the SEI layer.
![Equation ([15])](https://content.cld.iop.org/journals/1945-7111/165/5/A1064/revision1/d0015.gif)
Hence, the japplied in the transport model equations must now be changed to jI.
![Equation ([16])](https://content.cld.iop.org/journals/1945-7111/165/5/A1064/revision1/d0016.gif)
where, the intercalation over-potential (ηI) has been defined as:
![Equation ([17])](https://content.cld.iop.org/journals/1945-7111/165/5/A1064/revision1/d0017.gif)
Assuming a Tafel-like equation for the formation of SEI, we have:31
![Equation ([18])](https://content.cld.iop.org/journals/1945-7111/165/5/A1064/revision1/d0018.gif)
where, the SEI over-potential (ηSEI) has been defined as:
![Equation ([19])](https://content.cld.iop.org/journals/1945-7111/165/5/A1064/revision1/d0019.gif)
In the above equations, ϕ1 and ϕ2 are the solid phase and solution phase potentials of the electrode respectively. U1 and USEI are the open circuit potentials for intercalation and SEI formations, respectively. In the above equations, RSEI is the resistance of the SEI layer and can be calculated as follows:
![Equation ([20])](https://content.cld.iop.org/journals/1945-7111/165/5/A1064/revision1/d0020.gif)
where, κSEI is the ionic conductivity within the SEI (assumed constant) and δ(t) is the thickness of the SEI layer.
The governing equations and solution methodology has been summarized here. The application of SP model eliminates the need for solution of the potential and concentration equations in the electrolyte phase. Consequently, we are only solving for diffusion inside the solid particles for both the anode and cathode electrodes, and reaction kinetics at the particle surface to calculate the resulting overpotential at the anode and cathode. An extra Tafel equation for solid electrolyte interphase (SEI) kinetics is also solved for at the anode surface resulting in the division of total current density into intercalation current density and SEI current density at the anode surface. Once, the overpotential is computed, the cell voltage, Vcell, is calculated from the open circuit potentials, overpotential and bulk voltage drop/rise in the electrolyte phase using an averaged electrolyte resistance, Rcell value.
![Equation ([21])](https://content.cld.iop.org/journals/1945-7111/165/5/A1064/revision1/d0021.gif)
Since the mechano-electrochemical model developed here has electrochemically active area evolving over time, the lithium flux for SEI can be utilized in two ways:
- (a)Firstly, to increase the SEI thickness over the existing electrochemical area.
- (b)Secondly, to form SEI over the newly exposed area.
Thus, the active particle would have non-uniform SEI thickness over the entire electrochemical surface area. To reduce the complexity introduced by localized SEI thicknesses, in the model developed here, we choose to work with the volume of SEI layer. The SEI volume calculated by the model is then assumed to be evenly distributed across the entire electrochemical area of the particle. Thus, at every time step, the model calculates the electrochemical surface, volume of the SEI layer and then the thickness is calculated by evenly distributing the volume over the area. Thus, if MSEI is the molecular mass for the SEI products, ASEI is the electrode area available for SEI formation and ρSEI is the density of the SEI layer then the rate of formation of SEI can be calculated as follows:
![Equation ([22])](https://content.cld.iop.org/journals/1945-7111/165/5/A1064/revision1/d0022.gif)
where, VSEI is the volume of the SEI formed and VSEI(t) = δ(t) × ASEI(t). The nodal classification and computational scheme demonstrated in Figures 3 and 4 illustrates systematically the steps involved in the methodology.

Figure 3. Classification of different nodes in the active particle. This chart clearly demonstrates how the different nodes have been classified into various categories, and flux or electrochemical reactions have been applied on top of them.
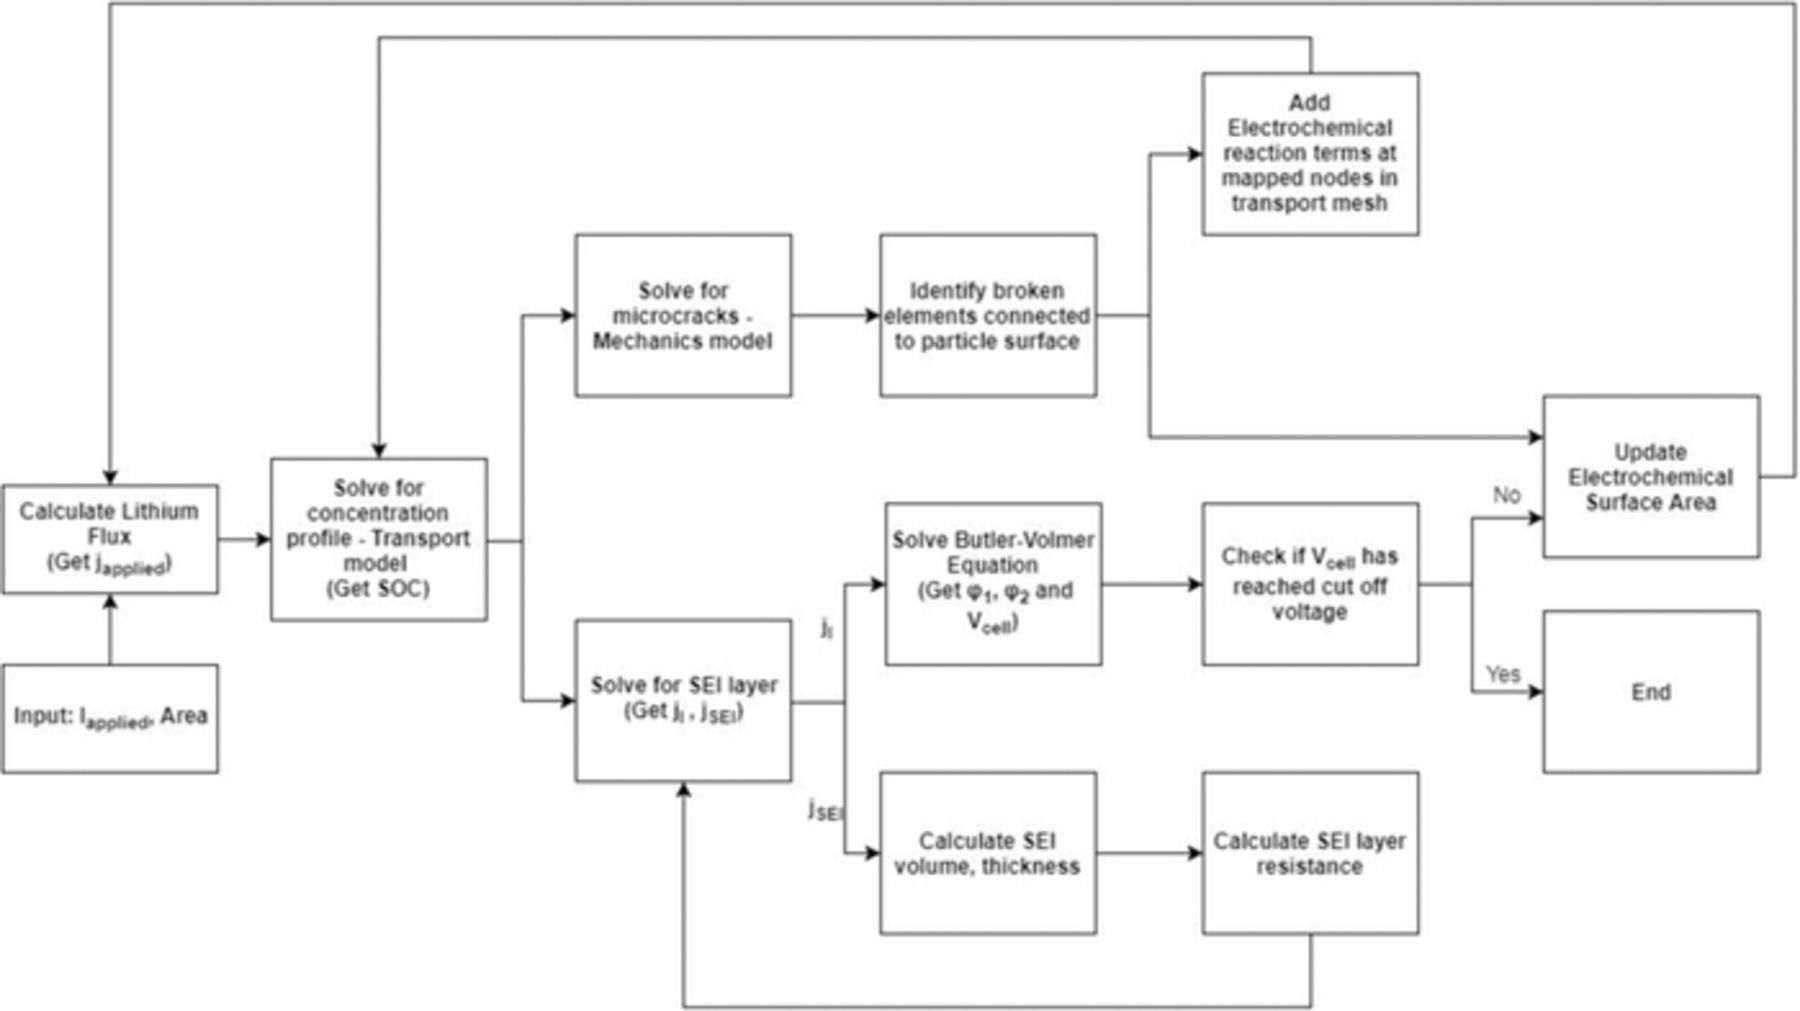
Figure 4. This model flowchart demonstrates the flow of computational algorithm implemented in the present analysis. The computational path adopted for a single "discharge" (delithiation) process has been demonstrated here. However, the same technique is applicable for a "charge" (lithiation) process as well.
Impact of ambient temperature
Variation in local temperature always affects the electrochemical and chemical reaction kinetics as well as the transport processes.65 In the present simulations, it has been assumed that isothermal condition is maintained within the cell, and the constant temperature is always in equilibrium with the ambient temperature. Hence, as we change the ambient temperature, all the reaction and transport parameters should vary according to the Arrhenius relation.65,68 The values of activation energies and reference temperature have been adopted from existing literatures.65,68 However, variation in elastic properties (such as, Young's modulus, Poisson's ratio and fracture threshold energy) with change in temperature has not been accounted for in the present analysis.
During the discharge process, graphite anode experiences delithiation at a constant rate. The simulation is stopped as soon as the lower cutoff voltage is reached. However, due to formation of microcracks and reaction within cracks, non-uniform out-flux of lithium can be expected through the particle surface along with inhomogeneous distribution of diffusion coefficients. This leads to non-uniform distribution of lithium concentration on the particle surface. As a result, it is possible that some portion of the active particle will experience excessive depletion of lithium ions, and the concentration on such surfaces will become zero much before the cutoff voltage is reached. These regions with zero lithium concentration can no longer contribute to the lithium flux required by the load, and can be termed as ineffective. In the present simulations, the "total electrochemical surface area" indicates the regions where electrochemical reactions can take place. However, some portions of this "total electrochemical surface area" experience excessive depletion of lithium due to reaction within microcracks. Lithium concentration becomes zero there, rendering the portion incapable of sustaining electrochemical reactions, which are characterized as "electrochemically ineffective surface area". Since this "electrochemically ineffective surface area" has no lithium left to contribute to the lithium flux, the flux terms are set to zero for these nodes. Electrochemical reactions, however, continue to occur in "electrochemically active surface area" of the electrode where lithium concentration is greater than zero.
Another important thing to note is the usage of single particle theory models for the analysis at higher C-rates (such as, 2C and higher), with SEI layer (approximately tens of nanometers thick) and microcracks within the particle (around 2μm to 5μm deep). In general, due to the development of higher concentration gradients within the electrolyte, single particle models are not applied for high C-rate operations and within active particles with microcracks. Extremely low diffusivity of lithium ions within the SEI layer renders the usage of single particle theory with SEI layer inappropriate. To justify the present model, evolution of concentration gradient within the electrolyte and across the SEI layer have been estimated, along with determination of the Damkohler number (Da) applicable in the electrolyte and across the SEI layer. If the estimated concentration gradient and Da are sufficiently small, application of the single particle model should be justified. For the present analysis, the Damkohler number have been defined as,  ,82 and the concentration gradient (Δc) has been estimated for the Fick's first law as,
  . Here, L indicates length or thickness of the entity under consideration, k denotes the electrochemical reaction rate constant, F indicates Faraday constant, D is the diffusivity, f indicates the species flux, j stand for "SEI layer" and the "electrolyte", whereas, i stands for "SEI layer", "electrolyte" and the "microcracks". The parameters used for calculating the relevant Damkohler number and the concentration gradients are as follows: length or thickness of the electrolyte, SEI layer and microcracks are assumed to be 100μm, 100nm and 1μm, respectively; the electrochemical reaction rate constant have been assumed to be
  for both lithium intercalation and reaction within the SEI layer;65,82 diffusion coefficient within the electrolyte and the SEI layer have been assumed to be
  and
and  , respectively;32,83 magnitude of lithium flux have been estimated as
  , during discharge at 1C, from the developed computational model. Based on the above mentioned parameters, the estimated Damkohler numbers are as follows: for electrolyte Daelectrolyte ∼ 0.001, and for SEI layer DaSEI ∼ 0.01; whereas, the concentration gradients that evolve are: for electrolyte
  , for microcracks
  , and for SEI layer
  . Based on these results, it is evident that the Damkohler number for both SEI and electrolyte are small enough and the assumption of single particle model is well justified. Assuming the concentration of lithium salt within the electrolyte is approximately
  , the concentration gradient analysis also indicates that single particle assumption is applicable for operation at 1C or 2C, and definitely justified for particles with microcracks, as long as liquid electrolyte solvent can freely flow into the surface connected cracks. If the effective lithium ion diffusion coefficient within the electrolyte decreases due to decreased porosity, or enhanced tortuosity, then the single particle model may not be applicable at higher rates. However, for the present analysis, concentration gradient across the 100nm thick SEI layer can be excessively large and render the single particle model inappropriate. It should be noted that 100nm thickness of the SEI is an upper limit, and usually SEI for graphite is only tens of nanometers thick.32 In the present framework, diffusion through SEI layer has not been modeled, and the impact of SEI layer on the ohmic overpotential term has been taken into account in the Butler-Volmer relation (see Eq. 17).
Results and Discussion
The main aim of this research is to understand the coupled impact of electrochemical and mechanical effects on the overall performance and capacity fade experienced by lithium-ion batteries. Hence, there is a competition between decreased diffusion resistance and increased capacity fade, due to SEI growth, in determining the performance of lithium-ion batteries. In the present research, several simulations have been conducted at a single particle level by combining the transport of lithium, microcrack formation, electrochemical reaction within the surface cracks and growth of SEI layer. Majority of the mechanical degradation observed in LIB electrodes occurs during the first few cycles.36,37 The incremental damage decreases significantly in the subsequent cycles. After the initial few cycles, it is observed that the mechanical degradation in electrodes completely saturates.37,43 Similar saturation in microcrack formation has also been observed in acoustic emission experiments during charge-discharge cycles.84,85 Hence, to study the evolution of microcracks in the LIB electrodes, it is crucial to pay special attention to the mechanical behavior of electrodes during the initial cycles. The list of parameters used while running the simulations have been provided in Table I. Unless otherwise specified, a graphite particle of radius 12.5μm at 25°C temperature and operating at 2C is simulated. Transport of lithium within the electrolyte has been neglected here, under the assumption that diffusion and conduction of lithium within electrolyte is fast enough and does not impact the overall cell performance.65,67
Table I. List of mechanical, chemical and transport parameters used for running the simulations to conduct the analysis.
| Parameter Name | Value | Units | Reference |
|---|---|---|---|
| Particle radius (R) | 12.5 × 10⁻⁶ | m | |
| C-rate (C) | 2 | – | |
| Initial temperature (T) | 25 | °C | |
| Diffusion coefficient (D0) | 3.9 × 10⁻¹⁴ | m2/s | 37 |
| Diffusion expansion coefficient (ω) | 1.14 × 10⁻⁶ | m3/mol | 37 |
| Young's modulus (E) | 70.57 | GPa | 37 |
| Poisson's ratio (ν) | 0.277 | - | 37 |
| Mean fracture energy threshold per unit area (Ψ) | 2 | J/m2 | 37 |
| Crack effect (α) | 0.85 | – | 37 |
| Maximum stoichiometric Li ion concentration (cmax) | 31833 | mol/m3 | 37 |
| Initial concentration of lithium ions within the electrode (cini) | 26527 | mol/m3 | Model parameter |
| Exchange current density for intercalation (divided by Faraday constant) (i0, I) | mol/m2.s | 65 | |
| Exchange current density for SEI formation (divided by Faraday constant) (i0, SEI) | 1.36 × 10⁻⁹ | mol/m2.s | 87 |
| Molecular Mass of SEI layer (MSEI) | 0.162 | kg/mol | 87 |
| Density of SEI layer (ρSEI) | 1690 | kg/m3 | 87 |
| Ionic conductivity of SEI layer (κSEI) | 5 × 10⁻⁶ | S/m | 87 |
| OCV for SEI formation (USEI) | 0.2 | V | 44 |
The results presented in this manuscript have been divided into two sub-sections. In the first sub-section, effect of electrochemical reaction within the surface connected microcracks has been investigated. Impact of SEI layer on the cell performance has not been taken into account in the first set of simulations. These results have been presented in Figures 5 to 9. It has been clearly demonstrated that electrochemical reaction within the microcracks can significantly affect the overall performance of the cell through decrease in the effective diffusion length. The next sub-section includes the formation of SEI layer on top of graphite active particles. Figures 10 to 12 demonstrate how the evolution of SEI layer and irreversible consumption of lithium can reduce the cell capacity and alter the overall performance. Formation of SEI layer has been assumed to occur on the surface of the active particle, as well as within the surface connected microcracks where electrochemical reaction may take place.
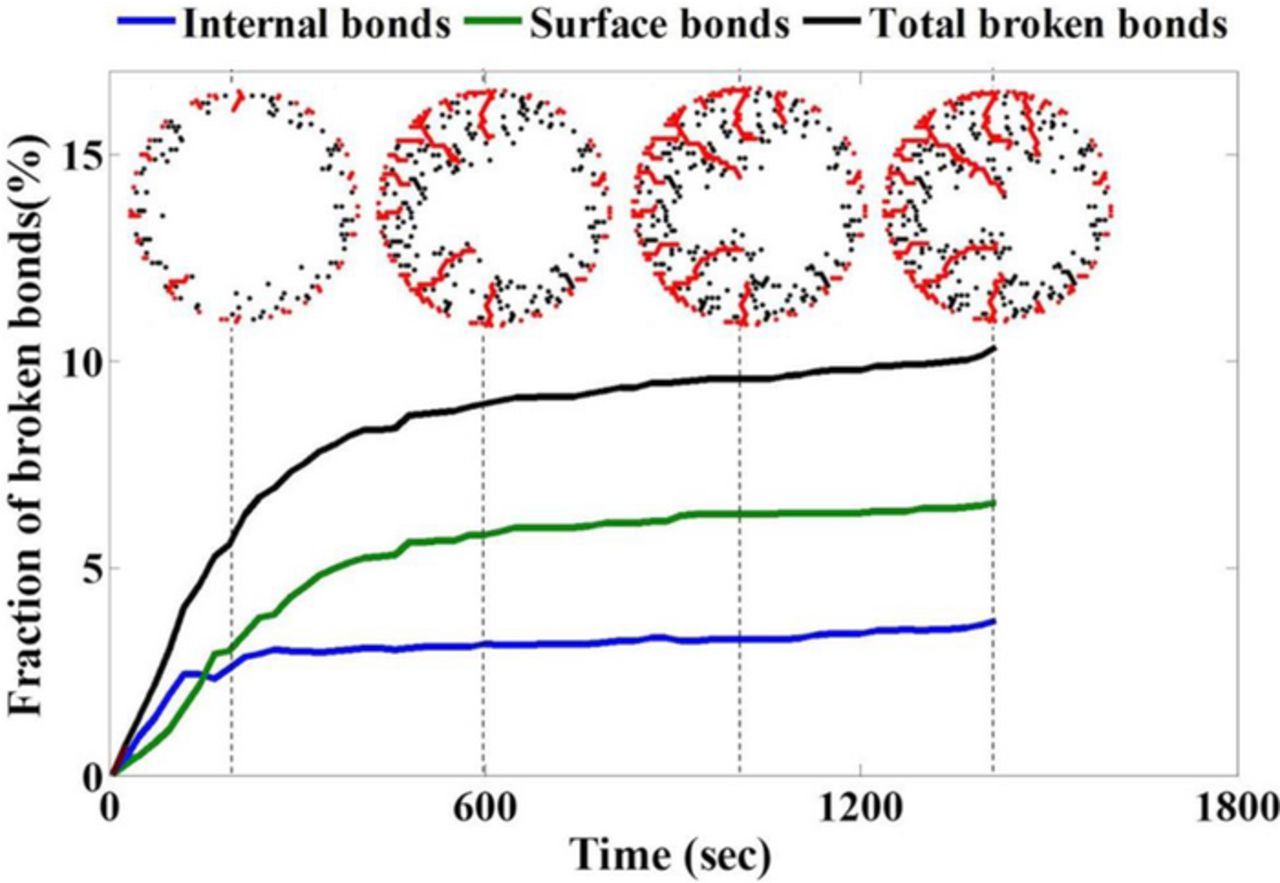
Figure 5. Any broken bond in the single particle can be either connected to the surface of the particle (called surface bonds shown by red dots) and facilitate electrolyte flow, or be disconnected from the surface (called internal bonds shown by black dots). The evolution of these broken bonds influences the electrochemical behavior of the single particle. For the case shown here, the growth of internal bonds saturates much before the growth of surface bonds. This is because the electrochemical reactions simulated by the lithium source/sink terms in the surface bonds create higher localized concentration gradient which induces greater diffusion induced stress, further enhancing the growth of surface bonds.
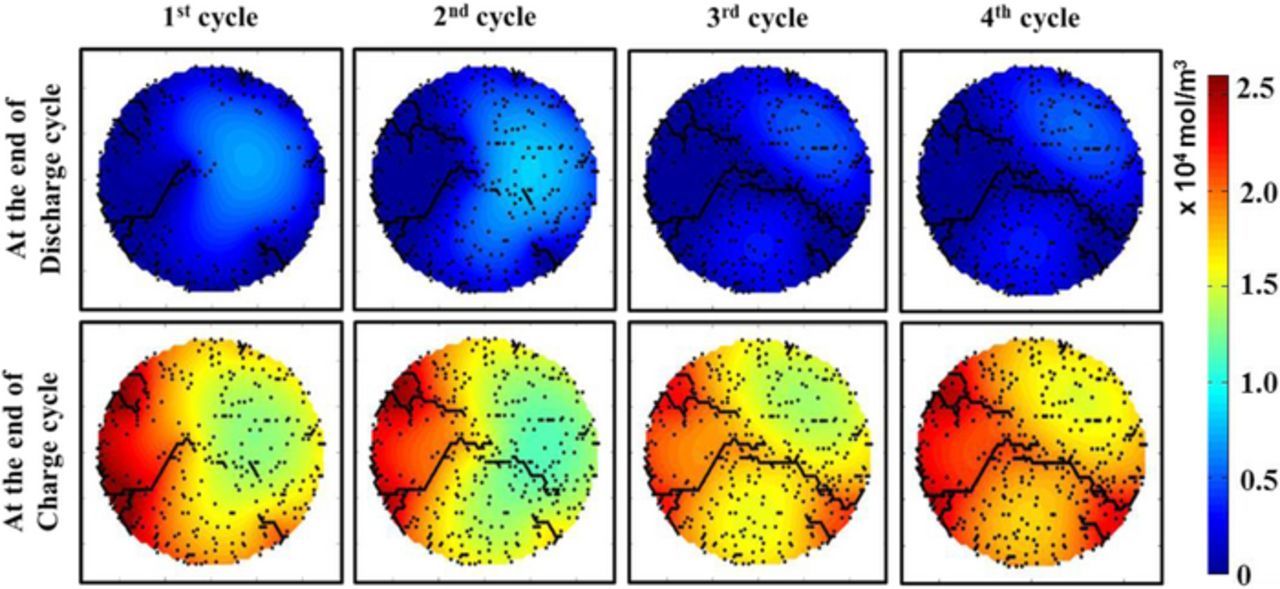
Figure 9. Effect of electrochemical reactions in the microcracks becomes much more pronounced over cycling. Discharge process primarily leads to microcrack formation near the surface of the particle. While on the other hand, the charge process leads to formation of microcracks near the center of the particle. Hence, upon cycling, the azimuthally asymmetric microcracks may coalesce forming a conjoined microcrack spanning across the entire expanse of particle. This can lead to particle disintegration and possibly particle isolation from the conductive network leading to loss of capacity.
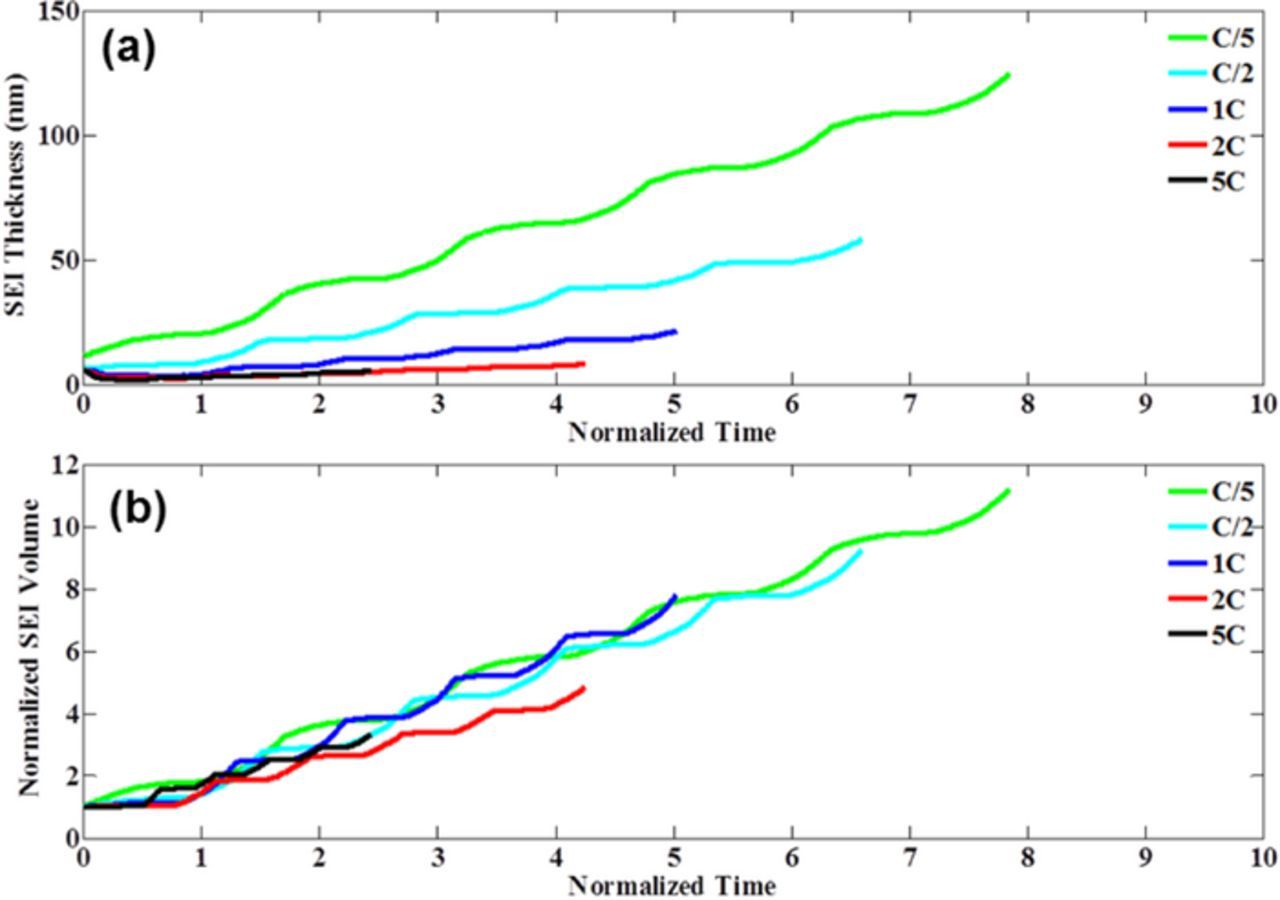
Figure 10. Formation of solid electrolyte interface (SEI) layer is inevitable as soon as the liquid electrolyte comes in contact with the fresh electrode active particle, which further leads to deterioration of capacity. A single-particle based SEI growth model has been developed which captures the increase in SEI volume over time. (a) Change in SEI thickness over time observed at different C-rates for a particle of radius 12.5 micrometer and operating temperature of 25°C. SEI thickness has been determined by dividing the SEI volume by the total surface area. During operation at higher rates, increase in SEI thickness is relatively less. (b) Increase in SEI volume with time observed at different C-rates for a particle of radius 12.5 micrometer and operating temperature of 25°C. Initial volume of the SEI layer has been used to normalize the total SEI volume. Total amount of SEI formation is almost similar with respect to normalized time at different C-rates. At higher rates, due to enhanced fracture formation, total surface area is more than that observed at lower C-rates. Hence, the SEI thickness is less during high C-rate operation. Significant increase in SEI thickness is observed during the charge process. During discharge relatively less amount of SEI evolves.

Figure 12. Discharge capacity over multiple cycles incorporating the effects of crack formation, reaction in cracks and SEI formation has been investigated here. (a) Discharge capacity from 2nd to 7th cycle, which has been normalized by the capacity at the end of the 2nd cycle. (b) Rate of capacity fade between the 2nd and 4th cycle where crack formation is dominant. (c) Rate of capacity fade between 4th and 7th cycle where SEI growth plays a major role.
Incorporate electrochemical reaction within microcracks
In the developed computational model, the evolution of voltage has been estimated using the approximations of single particle model.65–67 However, the electrochemical reactions influence the mechanics of the electrode active particle; while, the microcracks formed directly affect the electrochemistry by providing more area for the electrochemical reactions to take place thereby reducing the lithium flux. Hence, there exists an intimate two-way coupling between the mechanics and electrochemistry in the electrode. Formation of microcracks within the solid active particles impact the transport of lithium in two different ways:
- (a)Crack fronts connected to the surface increases the electrochemically active area. For a constant current cycle, this implies a proportionate decrease in lithium flux.
- (b)Interior microcracks reduce the local diffusivity of an active particle.
Figure 5 demonstrates the evolution of total broken bonds (black line), broken bonds connected to the surface (green line) and interior broken bonds (blue line) during delithiation in a graphite active particle. It is evident that the evolution of interior broken bonds (blue line) saturate much before the microcracks connected to the surface (green line). Contour plots demonstrating the location of interior broken bonds (by black dots) and surface connected broken bonds (by red dots) have been shown in Figure 5 at times 200sec, 600sec, 1000sec and end of discharge (which is around 1500sec, due to the presence of overpotentials associated with activation and mass transport limitations). In order to implement the reaction within surface connected crack fronts, source/sink terms have been added for the broken bonds denoted by red dots. Since reaction within the microcracks has also been taken into account, this induces higher localized lithium concentration gradients, and subsequently enhanced diffusion-induced stress around the propagating crack fronts. Hence, the surface connected cracks tend to grow for a longer amount of time, and eventually demonstrate a larger length as compared to those without reaction within cracks.37
As time progresses, "electrochemically ineffective surface area" evolves due to localized depletion of Lithium. This increases the flux density over the "electrochemically effective surface area" as the same lithium flux is now distributed over a smaller area. Figure 6 demonstrates the evolution of "total electrochemical surface area" (by black line), "electrochemically effective surface area" (by blue dashed line) and "electrochemically ineffective surface area" (by red line) for the graphite active particle. It is evident that during the first half of the discharge process, all the electrochemical surface area is effective. However, in the second half of the delithiation process, electrochemically ineffective area starts to evolve. Towards the end of the discharge, majority of the surface area becomes electrochemically ineffective. In Figure 6, contour maps of concentration profile, electrochemically effective and ineffective surface areas and total crack area have been provided at different stages of the discharge process. As shown in Figures 6a1 and 6a2, at the beginning of the discharge process the electrochemically active surface area is almost same as the total area. Figures 6b1 and 6b2 indicate the increase in total and effective surface area due to crack propagation from the particle surface. Figures 6c1 and 6c2 show increase in total area but decrease in effective area due to rise of the ineffective portion, which has been shown using "white" color in the concentration contour plots. Finally, Figures 6d1 and 6d2 demonstrates that very small portions of the cracks are electrochemically effective at the end of the discharge process. Majority of the ineffective area exists within the active particle where significant amount of microcrack evolution has occurred because of reaction within the microcracks connected to the particle surface.
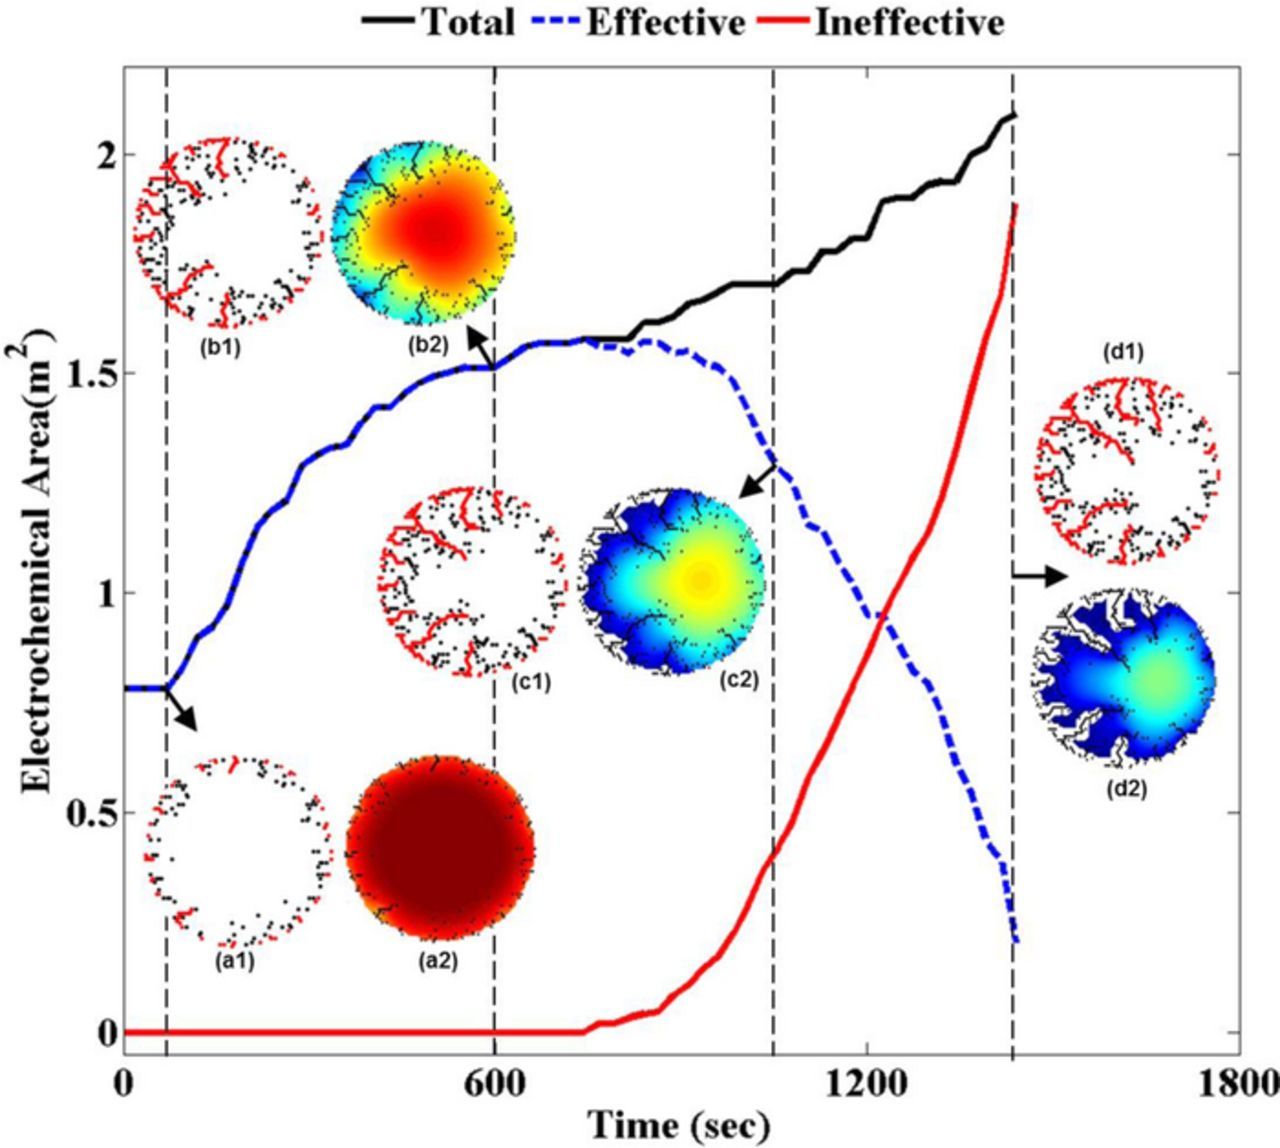
Figure 6. The electrochemical reactions simulated in the surface bonds create a greater localized concentration gradient. Towards the end of discharge of the particle some regions on the surface of the particle are bound to experience depletion of lithium. Such regions, once depleted, can no longer contribute to the lithium flux required by the load and can be termed as ineffective. Now, to maintain constant current, lithium flux is evenly distributed amongst the remainder of the active area of the particle (called effective area). This figure shows the evolution of effective and ineffective area in the particle. Initially, at the start of discharge cycle, all the regions on the surface of the particle have high lithium concentration to support the lithium flux. Hence, the total electrochemical area of the particle is the effective electrochemical area (see (a2) and (b2)). But at the end of the discharge cycle, when majority of the lithium has been extracted out of the particle, the effective area is considerably reduced as seen in (d2).
To understand the impact of electrochemical reaction within the surface cracks, the fracture density and concentration contour obtained from the present simulations will be compared to that reported by Barai and Mukherjee.37 In their previous study, Barai and Mukherjee37 analyzed the evolution of concentration and microcracks within the graphite active particles, by incorporating the resistance to lithium diffusion due to presence of microcracks within the active particles.37 However, they did not add the electrochemical reaction within the surface connected crack fronts. In the present manuscript, the model developed by Barai and Mukherjee37 will be referred to as the "mechanics (M)" model. In the present analysis, their computational methodology has been extended to incorporate the effect of electrochemical reaction within the cracks, which will be characterized as "mechano-electrochemical (MEC)" model. The difference in lithium concentration and microcrack distribution within a graphite active particle as predicted by these two methodologies has been demonstrated in Figure 7. As demonstrated in Figure 7a, the M model predicts a higher fracture density at a given time compared to the MEC model. This can be justified as the M model has a constant surface area it experiences a constant lithium flux throughout the discharge process. Whereas, the MEC model experience increase in electrochemically active surface area due to evolution of surface connected microcracks. Hence, lithium flux decreases during the discharge process in the MEC model. The decreased flux implies lower concentration gradients and lower mechanical degradation. Also, since the electrolyte does not percolate into the active particle through cracks in the M model, the lithium within the active particle is not fully utilized and the discharge process for mechanics model stops before that for the MEC model. However, for the additional time that the MEC model takes to completely discharge, it may surpass the fracture density observed in the M model.

Figure 7. Significance of the electrochemical reactions taking place in the surface cracks within the particle can be highlighted by comparing this model to the Barai & Mukherjee model. Unlike the model developed here, the Barai & Mukherjee model does not allow for electrochemical reactions to take place inside the particle. The concentration gradient, is therefore, more uniform throughout the surface of the particle resulting in no preferential propagation of microcracks (as seen in (b1)). Normalized angular mechanical damage and normalized angular concentration is very uniform throughout the azimuthal direction (d1). On the other hand, for the model developed here, allowing localized electrochemical reactions in the microcracks leads to a high variation of these two parameters along the azimuthal direction (d2). Another important difference can be seen by observing that despite the fracture density predicted by the two models being similar, there is significant difference in the distribution along the radial length. The model developed here has microcracks penetrating deep into the particle while the microcracks predicted by Barai & Mukherjee model are distributed closer to the surface (graph (c)).
One unique difference between the M and the MEC model is the coupling between mechanical damage and electrochemical reactions. In M model, the microcracks affect the concentration distribution only by reducing the local diffusivity of active material. This has a subtle effect on the lithium concentration distribution in the vicinity of the microcracks. In the MEC model, however, this coupling is more pronounced, as other than reducing the local diffusivity of active material, microcracks also result in new surfaces that participate in electrochemical reactions. This significantly changes lithium concentration in the vicinity of the microcracks. This difference is highlighted by Figures 7b1 and 7b2 that shows the concentration contour plots for the two models at the end of discharge. Microcracks are superimposed upon the contour plots to give an idea of the extent of mechanical degradation. For the M model, the microcracks are more uniformly distributed along the azimuthal direction (see Figure 7b1). Whereas, for the MEC model, the microcracks are directional and thus not uniformly distributed along the azimuthal direction (see Figure 7b2). The directionality of microcrack propagation is due to the electrochemical reactions taking place at the surface connected crack fronts that lead to preferential propagation of the microcracks further. Thus, as observed in Figure 7, microcracks grow radially very close to the center of the particle. In the M model, however, the microcracks are unable to propagate that close to the center of the particle and are relatively shorter. This is reflected from the cumulative distribution of fracture density in the radial direction demonstrated in Figure 7c. For the M model, microcracks are formed only beyond a radial distance of 6.5 μm from the center of the particle. Thus, the region in the center of the particle, up to radius of 6.5 μm, is microcrack free. For the MEC model, microcracks can be observed beyond a radial distance of 1 μm from the center of the particle. Thus, the microcracks in the MEC model extend until very close to the center of the particle.
This distinction can also be highlighted by plotting the angular distribution of lithium concentration and normalized fracture density. In Figures 7d1 and 7d2, the above-mentioned angular distributions are plotted on a polar plot for the two models (M and MEC) at the end of discharge. It can be inferred from this plot that at the end of discharge, the concentration distribution and microcrack distribution is almost uniform along the azimuthal direction for the M model (see Figure 7d1). This is not the case for the MEC model. The fracture density is significantly higher in the 2nd and 3rd quadrant, however, lithium concentration is higher for the 1st and 4th quadrant (see Figure 7d2). This non-uniform angular distribution of lithium concentration and fracture density is a result of the intimate two-way coupling between mechanics and electrochemistry. Maximum fracture density in the 2nd and 3rd quadrant implies that these regions have largest electrochemical area for reactions. Thus, more lithium is extracted by the electrochemical reactions, eventually reducing the lithium concentration in these quadrants.
To study the effect of electrochemical reactions in the microcracks on the electrochemically active area and performance of the cell, comparisons have been made between the following models in Figure 8:
- (a)Electrochemical (EC) model: Only transport of lithium within the active particle is considered, without any mechanical deformation or fracture.
- (b)Mechanics (M) model: Mechanical stress within the active particle gives rise to formation of microcracks, which merely reduce the diffusivity. No reactions within the microcracks have been taken into consideration.
- (c)Mechano-electrochemical (MEC) model: Along with formation of microcracks, electrochemical reactions within the surface connected cracks have been taken into account due to flow of electrolyte.
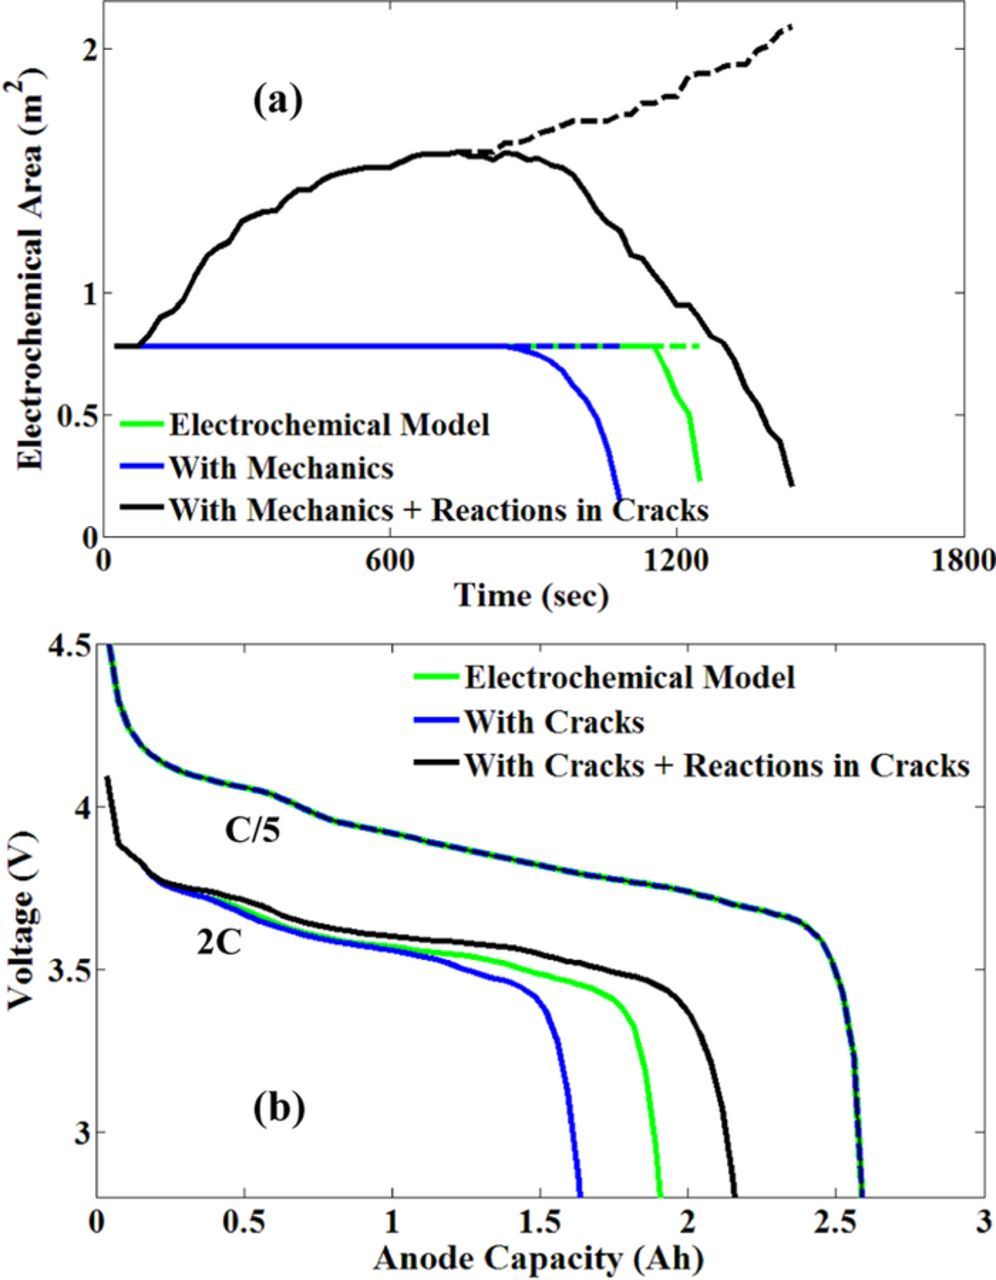
Figure 8. (a) The key difference between the "mechano-electrochemical" model developed here, mechanics model (Barai and Mukherjee37) and the fundamental "electrochemical" model, is the variation of electrochemically active area. Total electrochemically effective area for the latter two models remains constant throughout the discharge cycle. For the "mechano-electrochemical" model, on the other hand, total electrochemically effective area increases with the growth of surface microcracks. At the end of discharge cycle, total electrochemically active area has grown to 4 times the initial value. Although the total electro-active area monotonically increases, lithium depletion toward the end of discharge leads to decrease in effective electrochemical area for all the three models. (b) Comparison between the performance curves during discharge obtained by the three different mechanisms at 0.2C and 2C. Since negligible microcracks evolve at lower rates, performance curve estimated by all the three models superimpose on top of each other. The impact of mechano-electrochemical coupling becomes evident during discharge at 2C.
As demonstrated in Figure 8a, for the EC and M models, the electrochemically active area is not affected by fracture growth and hence is constant. In Figure 8a, the dashed lines indicate total surface area, and the solid ones represent the electrochemically effective area. For the MEC model, as discussed earlier (see Figure 6), the area initially increases due to fracture growth. For all the models, once regions within the particle start getting depleted of lithium, the effective electrochemical area plunges significantly toward the end of discharge process (see Figure 8a).
In the lithium-ion battery literature, the EC model (also known as the single-particle (SP) model) is considered the ideal case where the performance is only electrochemically limited. Until now, all the computational models developed to investigate the mechanical degradation behavior of the electrodes accounted only for the negative effect of microcrack formation, such as, decreasing the diffusivity in the proximity of the microcracks.37,80 Thus, the performance predicted by all of the M models are lower than that predicted by the EC model, which is also reflected in Figure 8b (compare between the green and blue lines). But if electrochemical reactions in the microcracks are accounted for while modeling mechanical degradation, then this may not be necessarily true. The performance curves for the EC, M and MEC models are demonstrated in Figure 8b. As expected, at 2C discharge, capacity predicted by the M model is lower than that predicted by the EC model. However, the MEC model predicts maximum capacity, even higher than the ideal case of EC model. This might not be obvious at first, but upon further scrutiny, this can be justified by comparing the effective diffusion lengths for lithium transport experienced in different models. Since the EC and M models have the electrochemical reactions taking place only at the surface of the active particle, the lithium at the core of the active particle must diffuse radially outward to the surface of the particle. Hence, the diffusion length is constant for these models and is proportional to the radius of the particle. For the MEC model, however, the electrochemical reactions take place not only at the surface of the particle but also at electrochemically active microcracks. This reduces the diffusion length for the MEC model, as the lithium at the core of the particle now need not diffuse all the way to the surface of the particle. The long radial cracks observed in the particle (shown in Figure 7b) indicate that the diffusion lengths are significantly reduced as microcracks form and propagate. This is termed as the positive effect of mechanical degradation. The long radial electrochemically active microcracks help in extracting enhanced amount of lithium from the particle. This is reflected in the higher capacity predicted by the MEC model in Figure 8b (see the black line). Hence, factors that favor mechanical degradation experience a more pronounced positive effect due to it and thereby exhibit higher particle utilization compared to other models. On the other hand, at very low C-rates, there is enough time for diffusion to take place, minimizing the concentration gradients that are responsible for mechanical degradation. Hence, at low rate of discharge, we expect that the performance predicted by the EC, M and MEC model are identical. The performance curves for all the three models operating at C/5 rate of discharge overlap completely (see Figure 8b, the dashed lines) and thus validate our hypothesis.
Until now, all the analysis considered only the first delithiation process from the graphite active particle. However, subsequent lithiation-delithiation cycles can significantly alter the microcrack pattern that develops within the active particles during the first discharge process. Figure 9 demonstrates the formation of microcracks, along with the concentration contours, for four subsequent cycles as predicted by the MEC model. The microcrack and concentration contours after the delithiation process is provided on the top, and the contour plots after the lithiation process is given in the bottom. Generation of tensile stress close to particle surface create surface cracks during the delithiation process,36,37 which may propagate to the center due to reaction within the microcracks. Whereas, during the lithiation process, tensile stress is expected far away from the surface and surface connected crack fronts.37 During the first lithiation, tensile stress acts relatively close to the center of the active particle, and microcracks evolve in that region (see Figure 9 bottom left figure). Coalescence of these microcracks generated during lithiation along with that evolved at the time of delithiation, can eventually lead to spanning cracks from one end of the active particle to the other end (see the bottom right contour plot in Figure 9). This can induce disintegration of active particles, and possibly particle isolation from the conductive network leading to loss of capacity. Several experimentally obtained SEM and TEM images of cycled active particles clearly demonstrate the presence of crack fronts that propagate from one end to the other.38,40 Formation of spanning cracks after multiple delithiation-lithiation cycles within graphite active particles (demonstrated in Figure 9) are consistent with those experimental observations. Due to the presence of enhanced electrochemically active surface area right after the first delithiation process, the magnitude of lithium flux experienced during the subsequent lithiation-delithiation processes decrease significantly. All the lithium concentration contour plots indicate exaggerated lithiation (Figure 9 bottom plots) as well as delithiation (Figure 9 top plots) around the electrochemically active crack fronts.
Impact of SEI formation on cell performance
All the simulation results analyzed till Figure 9 did not consider the presence of any SEI layer. During battery operation, as soon as the electrolyte comes in contact with the active particle, it forms a passivating SEI layer at the surface of the particles. At the beginning, this layer helps to stabilize the anode surface. However, formation and growth of SEI consumes cyclable lithium, and acts as a major source of capacity fade experienced by lithium-ion batteries. Evolution of microcracks from the particle surface opens-up fresh layers of graphite, where further SEI formation occurs leading to subsequent capacity fade. To understand the proper mechano-electrochemical coupling that exists within the lithium-ion-cells, it is necessary to simulate the formation of SEI layer on top of not only the particle surface, but also on the cracked surface where electrochemical reaction can occur. Hence, in the present analysis, a mathematical scheme has been implemented that captures the growth of the SEI layer on the "electrochemically active surface area" in an averaged fashion. Details of the computational scheme have been described within the Methodology section. The extra parameters used for modeling the SEI growth have also been included in Table I.
Evolution of the thickness of SEI layer with time has been demonstrated in Figure 10a during operation at different C-rates. Since the formation of SEI layer is a reduction process, only the cathodic component of the current has been modeled here (see Eq. 18). Hence, majority of the SEI growth occurs during the charge process (lithiation into graphite). During the discharge process (delithiation from graphite), change in SEI thickness is relatively less. This unequal growth of the electrode-electrolyte interface during charge and discharge process generates the wiggles observed in Figure 10a. Evolution of the thickness of the SEI layer depends on the rate of operation in two different ways:
- (a)At lower C-rates, both charge and discharge (lithiation and delithiation) occurs for a longer time. Since, the total SEI thickness increases with time, it gets the opportunity to grow thicker during operation at lower rates (also observed in Figure 10a).
- (b)It should be pointed out that the thickness has been obtained by dividing the SEI volume by the total surface area where SEI can form (see Eq. 22 and subsequent texts). Similar assumption has also been adopted while analyzing the impact of SEI layer on top of lithium metal anodes.86 SEI can form not only on the particle surface, but also on the surface connected cracks. The amount of surface connected cracks rises as the mechanical degradation increases. Enhanced mechanical degradation has been observed at higher rates. Hence, higher surface area should be available for the growth of the SEI layer during operation at higher rates. Because of this larger amount of SEI surface area, the SEI thickness is also less at higher rates of operation.
Enhanced thickness of the SEI layer at lower rates applies higher resistance to the transport of ions and electrons, which eventually contributes to the fade of observable capacity. The spurious reduction in SEI thickness observed in Figure 10a can be attributed as an artifact of the computational methodology. The SEI thickness has been estimated by dividing the SEI volume by the total electrochemical surface area (see Eq. 22 and following texts). In the present set of simulations, discharge has been modeled first, where insignificant amount of SEI evolves.87 On the other hand, majority of the mechanical degradation occurs during the first few discharge processes. Microcrack formation leads to increase in electrochemical surface area of the active particles. A combination of negligible SEI growth and significant rise in SEI area leads to the reduction in SEI thickness at the first discharge only. However, this decrease in SEI thickness does not impact the overall capacity fade. Overall capacity fade due to SEI growth is determined from the total volume of SEI, which keeps on increasing even during the first discharge process.
As mentioned earlier, contribution of the SEI layer on the overall capacity fade is determined from its volume (see Eq. 22). Hence, it is worthwhile to investigate the evolution of SEI volume with time during operation at different C-rates. This has been successfully depicted in Figure 10b. It is apparent that the rate of increase in SEI volume is independent of the rate of operation. However, the total volume of SEI is larger at lower C-rates, since it gets more time to grow. Presence of the wiggles can be attributed to the unequal growth during the charge and discharge processes. Also, no spurious drop in SEI volume has been observed during the first discharge. During operation at higher C-rates, enhanced microcrack evolution from the particle surface leads to:
- (a)An increase in the SEI surface area, ASEI, which tries to increase the SEI volume.
- (b)A decrease in the SEI current density (jSEI), since the overall current density drops due to an increase in electrochemical surface area. This contributes in reducing the SEI volume.
These two competing mechanisms negate each other at most of the C-rates, resulting in a relatively uniform rate of growth for the SEI volume. However, the decrease in SEI current seems to be dominant at 2C that leads to slightly smaller volume for the SEI layer. At this point, it is worthwhile to note that the volume of SEI layer indicates the contribution to capacity fade, whereas, thickness of the SEI layer dictates its impact on cell performance.
In order to elucidate the coupled impact of mechanical degradation and electrochemical reaction on the performance and capacity fade experienced by the lithium-ion cells at the beginning of its life cycle, performance curves and corresponding capacities obtained from four different mechanisms, EC, M, MEC and "chemo-mechano-electrochemical" (CMEC), have been compared in Figures 11a and 11b, respectively. EC, M and MEC models have been defined previously. Simulations with CMEC model (denoted by black curve), which takes into account crack formation, electrochemical reaction within the surface connected microcracks and evolution of SEI on both particle surface as well as surface connected microcracks, are also performed and the results are compared with the previous models.
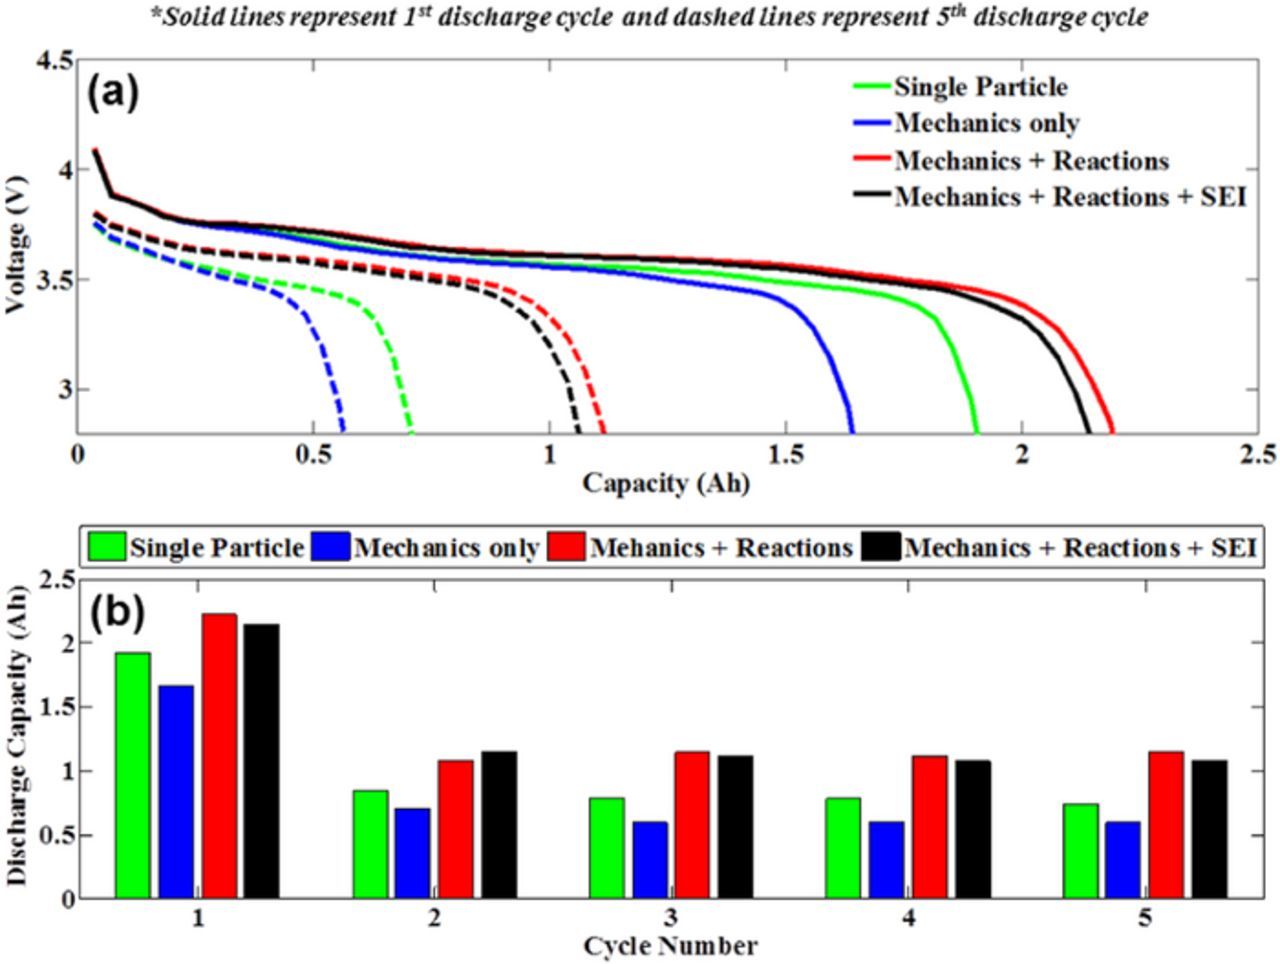
Figure 11. Comparison between four different models: i) Single-particle model (green bar), ii) Mechanical fracture model (blue bar), iii) Mechanical fracture combined with reaction within the cracks connected to the surface (red bar), and iv) Combined mechanical fracture, reaction within cracks and SEI growth model (black bar). (a) Comparing the discharge capacity for first and fifth cycles, fifth cycle has lower capacity for all the models. This can be attributed to the inability of constant current charge process to charge the active particle completely. However, the "chemo-mechano-electrochemical" model (black) consistently predicts lower capacity than the "mechano-electrochemical" model indicating that some lithium is irreversibly lost to the SEI layer. (b) Comparison between the discharge capacity obtained over five consecutive cycles for all the four models. SEI growth consumes cyclable lithium, which leads to enhanced capacity fade over multiple cycles. Hence, the black bar is mostly smaller than the red one. Since, reaction within the cracks lead to enhanced usage of the electrode active particles, both the red and the black curves are larger in length than the green and blue ones.
Figure 11a compares the performance curves obtained by these mechanisms during the first and fifth discharge processes. Each discharge processes have been accompanied by a constant current (CC) charge process at the same rate. In the M model, since the mechanical degradation hinders the transport of lithium, it demonstrates a smaller discharge capacity than the EC model during both the first and the fifth discharge process. In the MEC model, electrochemical reaction within the surface connected microcracks decreases the effective diffusion length experienced during transport of lithium. Hence, lithium stored at regions far away from the particle surface can participate in the electrochemical reactions, and the effective capacity increases. As a result, maximum cell capacity is observed in the MEC model during both the first and fifth discharge process. Formation of SEI layer on the particle surface and surface connected microcracks consumes cyclable lithium. Hence, incorporation of the SEI layer in the CMEC model leads to decrease in capacity as compared to the MEC model. However, the capacity experienced by the CMEC model is still larger than the EC and M models, due to the electrochemical reactions experienced within the surface connected microcracks. The rapid capacity decay experienced between the first and the fifth cycle can be attributed to the constant current (CC) charge protocol (at 2C) adopted in the present simulation, and does not have any physical significance.
The discharge capacity experienced by the EC, M, MEC and CMEC models have been plotted for the first five discharge processes in Figure 11b. As explained in the previous paragraph, the M model experiences the lowest capacity because of decreased diffusivity of lithium ions. The MEC model experiences highest capacity due to electrochemical reaction within the microcracks and effective reduction in lithium diffusion length. Consumption of cyclable lithium due to the formation of SEI layer leads to decrease in discharge capacity for the CMEC model. This trend is followed in almost all the discharge processes from the first to the fifth cycle. However, during the second discharge process, the higher capacity observed in the CMEC model than the MEC model can be attributed to the complex interplay between constant current charge process and the resistance exerted by the SEI layer. From the third discharge process onwards, the usual trend of enhanced capacity fade due to formation of SEI is restored. The sudden capacity fade between the first and the second discharge process is attributed to the constant current (CC) charge protocol adopted in the present simulation. In CC, the charging process is stopped as soon as the upper cutoff voltage is reached. Since the CC charging is conducted at 2C, the high activation overpotential brings the cell voltage to the upper cutoff limit much faster than that observed at lower rates. Hence, the charging process is stopped much before all the lithium gets transported back from cathode to anode. As a result, from the second discharge processes, the observable capacity is significantly smaller than the first discharge process. The capacity fade between the second and the fifth discharge process is relatively less for the present simulation conditions.
Finally, it is worth investigating how the capacity of the lithium-ion cell evolves over the first few cycles under different design (such as, particle size) and operating conditions (for example, C-rate and ambient temperature). The impact of mechanical and chemical degradation mechanisms is different under various operational and design conditions. For this analysis, we ran multiple charge-discharge cycles for three different particle sizes (7.5μm, 12.5μm and 17.5μm), three different ambient temperatures (0°C, 25°C and 50°C) and five different C-rates (0.2C, 0.5C, 1C, 2C and 5C). Figure 12a demonstrates the discharge capacity of lithium-ion cell obtained during the first seven cycles operating under five different combinations of particle-size, temperature and C-rates. The capacity after the first discharge process has been omitted because of the capacity fade experienced by the cell after the first cycle due to constant current charge protocol (see Figure 11a). In Figure 12a, all the discharge capacity values have been normalized with respect to that experienced during the second discharge process. It is clear from Figure 12a that during operation at low temperatures and very high C-rates (blue and green curves), the capacity decreases very fast over the first two cycles, and then stabilizes. Whereas, capacity decreases uniformly over all the cycles during operation at higher temperature (denoted by the red curves). Since enhanced mechanical degradation is observed at higher rates and lower temperatures,37,68 the rapid decay in capacity experienced by the blue and green curves can be attributed to the SEI formation on top of the crack fronts connected to the particle surface. Mechanical degradation saturates after the first few cycles.36,37,80 Since the SEI formation is relatively slow during operation at lower temperatures,29,31 the capacity fade at low temperatures and high rates (blue and green curves) almost stabilize after the first three or four cycles. However, at high temperatures even though the mechanical degradation is negligible, continuous SEI growth on top of the particle surface consumes cyclable lithium, resulting in continuous capacity fade (represented by the red curves). To differentiate between the impact of mechanical degradation and chemical reaction on the rate of capacity fade, two different regimes have been selected:
- (a)Region 1: Between 2nd and 4th cycle, where mechanical degradation and SEI growth on fresh surface is dominant.
- (b)Region 2: Between 4th and 7th cycle, where SEI growth on top of the existing layer is more dominant.
The green vertical line in Figures 12a has differentiated between these two regimes. Investigations of the rate of capacity fade in the above-mentioned regimes can provide proper guidance for improved design of active particles to minimize the overall capacity fade.
The rates of capacity fade with respect to C-rate at Region 1 and Region 2 have been demonstrated in Figures 12a and 12b, respectively. The different symbols indicate various particle sizes; "plus" indicate 7.5μm, "circle" indicate 12.5μm and "cross" indicate 17.5μm. Similarly, different colors represent various ambient temperatures; "blue" indicate 0°C, "green" indicate 25°C and "red" indicate 50°C. The green horizontal line in both Figures 12a and 12b indicates the line of zero capacity fade. Any data point that lies above the green line indicates appreciable capacity fade. Data points that lie on top of the green line indicate negligible capacity fade. Data points lying below the green line represents gain in capacity. Gain in capacity is observed because of the electrochemical reaction in the microcracks connected to the surface of the particle. It has already been demonstrated in Figure 8b and Figure 11a that surface connected crack fronts help to decrease the diffusion length associated with the transport of lithium within the active particles. Hence, presence of surface cracks can help to access the lithium ions stored far away from the particle surface, eventually increasing the effective capacity of the cell. If the gain in capacity from reaction within the surface cracks, is equal in magnitude as the capacity fade due to growth of SEI layer on top of the pristine active particle, the overall capacity fade experienced by the cell will be zero. From Figure 12b it is evident that in the first two – three cycles, the highest rate of capacity fade is dominated by mechanical degradation and subsequent SEI formation on top of the pristine active particles. Since, larger amount of microcracks evolve at low temperatures and higher C-rates, enhanced capacity fade has been experienced during operation at "0°C + 1C" and "25°C + 5C". Mechanical degradation usually saturates after the first two – three cycles. Hence, the capacity fade experienced between 4th – 7th cycles mostly consists of the growth of the SEI layer, which is more dominant at higher temperatures. As a result, Figure 12c portrays the maximum amount of capacity fade during operation at "50°C + 0.5C" and "50°C + 2C". In Figures 12c, very little capacity fade has been experienced by active particles operating at low temperatures. The coupling between electrochemical and mechanical means in determining the overall capacity of the cell has been successfully elucidated in Figures 12b and 12c.
The results obtained thus far have utilized the spherical particle assumption and traction free boundary conditions on the particle surface. However, in a functioning anode, the particle morphology can show wide variation as well as the particles are combined into a complex network that provide significant mechanical constraint to any given particle. To ascertain the impact of varying particle morphology and boundary effects on fracture characteristics, we have performed mechano-electrochemical simulations for ellipsoidal (oval in 2D) and spherical particles (circle in 2D) and contrasted the obtained results. Further, the network effect is incorporated by considering fixed displacement boundary conditions on the spherical particle surface and the results are juxtaposed alongside the traction free boundary condition simulation results to delineate its impact.
Impact of particle morphology on fracture
Coupled electrochemical-mechanical charge-discharge simulations are performed for spherical particle with radius R = 12.5 μm and an oval particle with major and minor dimensions A = 15μm, B = 10.4167 μm respectively for C-rate 2C and ambient temperature 25°C. The operating conditions as well as the area of the spherical and oval particles are kept the same so as to ensure homologous geometric (πR2 = πAB) and operating conditions for delineating the impact of aspect ratio. Figure 13 shows the obtained damage profile superimposed on the concentration contour plots for the anode (a) spherical particle and (b) oval particle (A = 15 μm, B = 10.4167 μm) at the end of first cycle discharge and charge. Damage is predominantly observed along the major axes in the oval particles (along x axis for oval particle) while the damage shows no preferred directional dependence for the spherical particle. Larger diffusional transport length for the Li atoms along the major axes for the oval particles leads to higher concentration gradients along that direction. Consequently, increased magnitude of diffusion induced stresses along this direction leads to higher propensity for fracture as is evident from the damage contour plots.
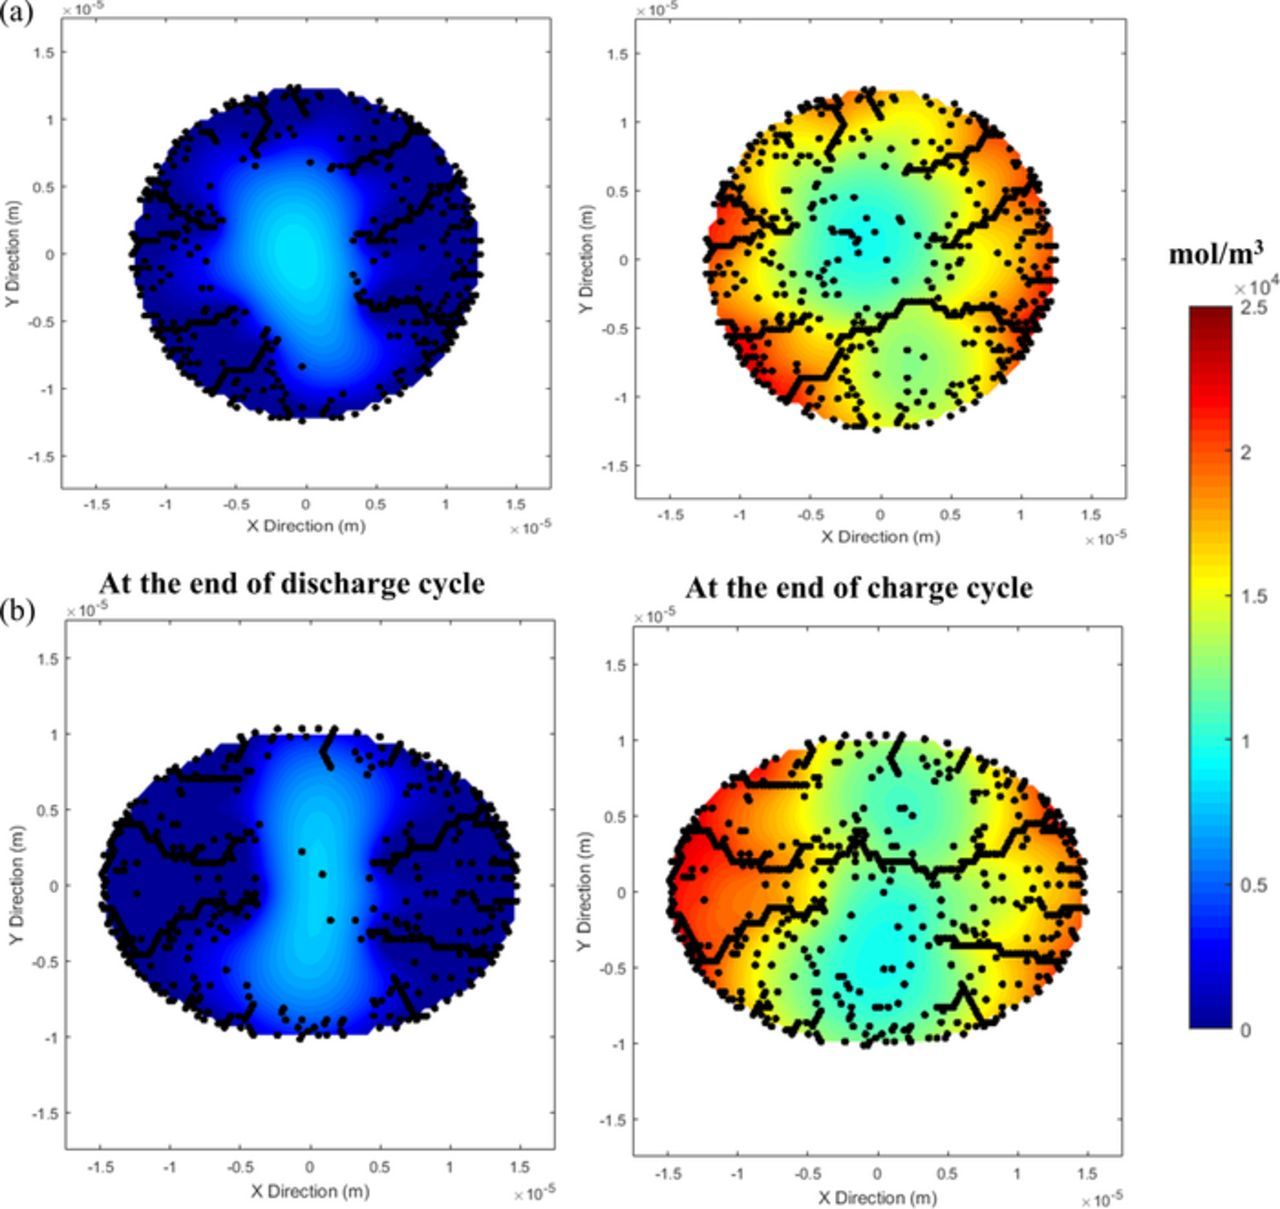
Figure 13. Demonstration of coupled electrochemical-mechanical charge discharge simulations performed on: (a) spherical particle of radius R = 12.5 μm, and (b) An oval shaped particle with A = 15μm and B = 10.4167 μm as the major and minor axes, respectively. Discharge and charge steps have been conducted at 2C rate and ambient temperature of 25°C. The oval particle demonstrates higher microcrack density along the major axis due to larger magnitudes of concentration gradient and diffusion induced stress.
Impact of particle surface boundary condition on fracture
Figure 14 compares the damage contours superimposed on the concentration profiles for spherical particle with traction free boundary condition prescribed at the surface versus spherical particle with zero displacement boundary condition imposed at the particle surface. The particle radii as well as the operating conditions are the same for both simulations differing only in the implementation of the boundary conditions. With traction free boundary condition, lesser damage is observed in the electrode particle as is evident by the smaller damage density (black dots) inside the electrode particle at the end of the discharge-charge step. Constrained particles develop larger stresses because of additional contact stress in conjunction with the diffusion induced stresses inside the particle.
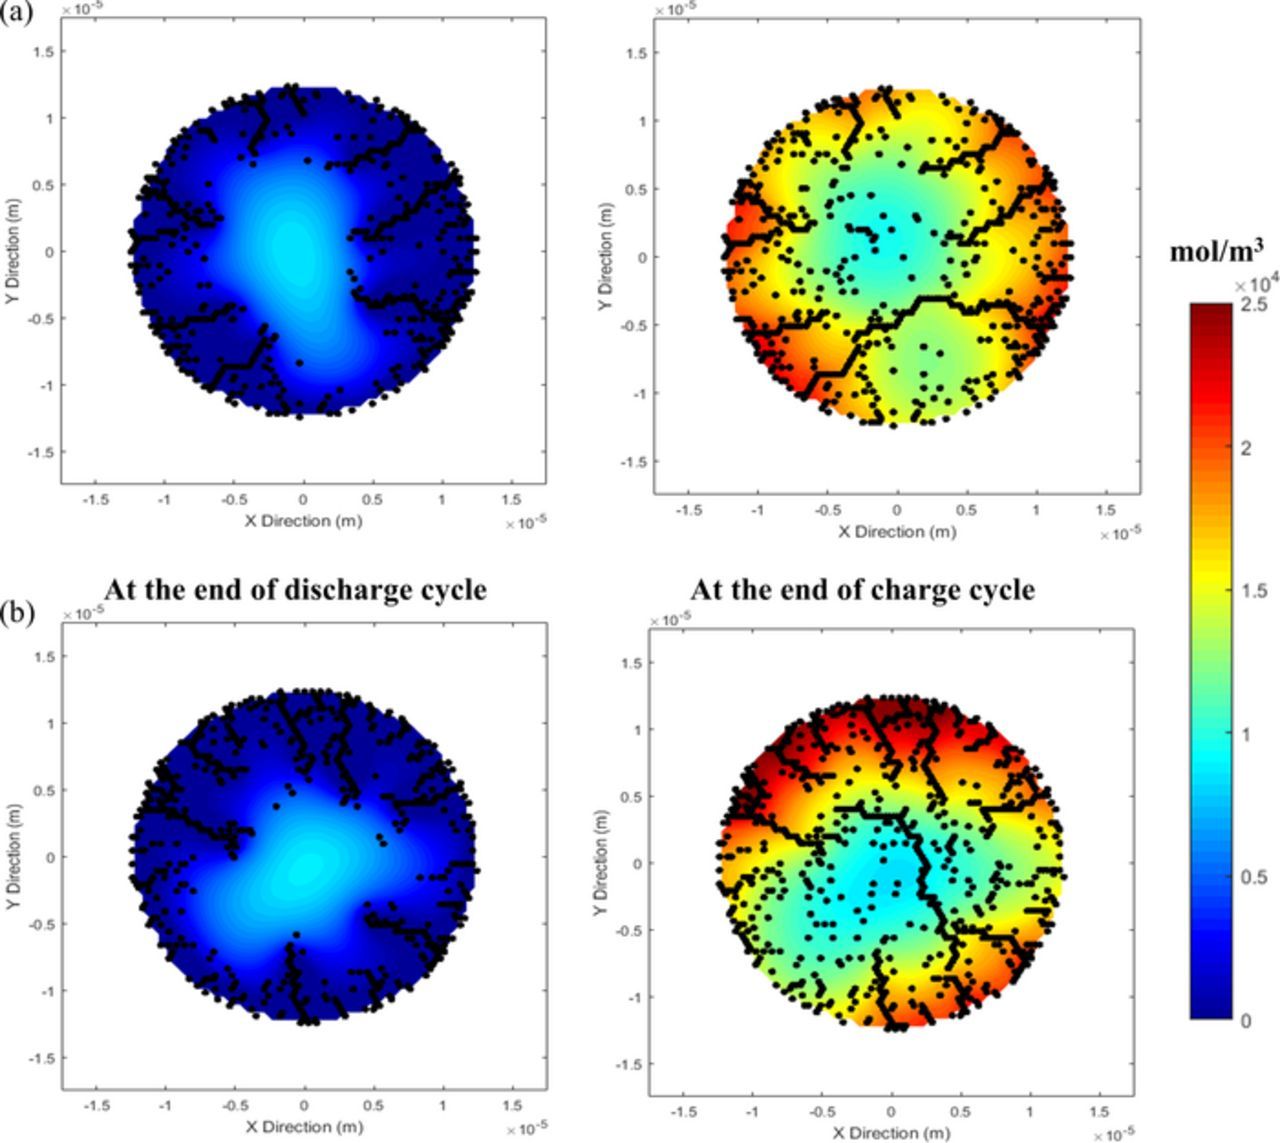
Figure 14. Comparison between evolution of concentration and microcracks for: (a) Free boundary, and (b) Fixed boundary case. Two particles of radius 12.5μm have been delithiated and lithiated successively at 2C with the two different free and fixed boundary conditions. Due to the presence of extra boundary constraints, the particle shown in (b) is incapable of releasing its strain energy, which led to enhanced microcrack formation within the active particle.
Conclusions
In the present research effort, a computational model has been developed that not only captures the formation of microcracks within electrode active particles due to diffusion-induced stress, but also simulates the electrochemical reaction within the crack fronts connected to the particle surface. Electrochemical reactions at regions other than the particle surface (such as, microcracks connected to surface) have been modeled by distributing source/sink terms within the interior control volumes. Formation of a passivating SEI layer has also been modeled in an equivalent fashion, which consumes cyclable lithium and results in capacity fade. The impact of coupled chemical and mechanical degradation on the overall capacity fade experienced by the lithium-ion cell have been investigated in details under different design (active particle size) and operating (C-rate and ambient temperature) conditions.
Allowing for electrochemical reactions in the microcracks leads to preferential propagation of electrochemically active microcracks. Thus, mechanical degradation is not uniformly distributed along the azimuthal direction of the particle (see Figure 7). The microcrack patterns thus predicted by the model resemble the patterns observed in the SEM images of actual electrode active particles (see the formation of long spanning cracks in Figure 9). Allowing for electrochemical reactions in the microcracks directly affects the lithium concentration distribution within the active particle. Just like microcracks, lithium concentration within the active particle also varies in the azimuthal direction. The performance predicted by the MEC model is better than that predicted by the SP model (see Figure 8b and Figure 11). This is because the MEC model not only accounts for the hindrance to lithium diffusion though mechanical degradation, but also incorporates the lithium transport enhancing effect of surface connected microcracks. That is, the electrochemically active microcracks increase the electrode surface area and reduce the effective diffusion length as they allow reactions to take place in the interior of the particle. The SP model however, does not consider mechanics. Thus the diffusion length for the SP model is equivalent to the radius of the particle and is thus fixed.
From the perspective of experimental analysis, it is not possible to isolate the effect of mechanical degradation on the cell performance. In all the practical cases, mechanical degradation is often coupled with chemical degradation (SEI formation). Incorporation of the formation of SEI layer, along with electrochemical reaction within the crack fronts, gives a computational estimate about the coupled impact of chemical and mechanical degradation on overall cell performance. Formation of the SEI layer leads to capacity fade because of the consumption of cyclable lithium as well as the increase in electronic resistance at the active-particle electrolyte interface. Impact of this extremely thin SEI layer on the diffusion of lithium ions as well as change in electrochemical area of the active particle has been neglected in the present analysis. Enhanced mechanical degradation at lower ambient temperatures and higher C-rates enables the formation of SEI layer on the newly formed pristine electrode surface, which again increases the rate of capacity fade (see Figure 11). Under certain conditions, it is possible to have zero capacity fade, or sometime even gain in capacity (with respect to the first or second cycle), because of the complex interplay between the mechanical degradation, electrochemical reaction within the surface connected crack fronts, and SEI formation on top of electrochemically active area (demonstrated in Figure 12). In general, it has been observed that higher ambient temperature, lower operating current and smaller particle size lead to minimum mechanical degradation and better capacity retention.
Acknowledgment
Financial support from NSF, grant no. 1438431/1759651, is gratefully acknowledged. NK and PB contributed equally to this work.
ORCID
Aashutosh Mistry 0000-0002-4359-4975
Partha P. Mukherjee 0000-0001-7900-7261