

Abstract
Many solid-state devices, especially those requiring anion conduction, often add a supporting electrolyte to enable efficient operation. The prototypical case is that of anion-exchange-membrane water electrolyzers (AEMWEs), where addition of an alkali metal solution improves performance. However, the specific mechanism of this performance improvement is currently unknown. This work investigates the functionality of the alkali metal solution in AEMWEs using experiments and mathematical models. The results show that additional hydroxide plays a key role not only in ohmic resistance of the membrane and catalyst layer but also in the reaction kinetics. The modeling suggests that the added liquid electrolyte creates an additional electrochemical interface with the electrocatalyst that provides ion-transport pathways and distributes product gas bubbles; the total effective electrochemical active surface area in the cell with 1 M KOH is 5 times higher than that of the cell with DI water. In the cell with 1 M KOH, more than 80% of the reaction current is associate with the liquid electrolyte. These results indicate the importance of high pH of electrolyte and catalyst/electrolyte interface in AEMWEs. The understanding of the functionality of the alkali metal solution presented in this study should help guide the design and optimization of AEMWEs.
Export citation and abstract BibTeX RIS

This is an open access article distributed under the terms of the Creative Commons Attribution Non-Commercial No Derivatives 4.0 License (CC BY-NC-ND, http://creativecommons.org/licenses/by-nc-nd/4.0/), which permits non-commercial reuse, distribution, and reproduction in any medium, provided the original work is not changed in any way and is properly cited. For permission for commercial reuse, please email: permissions@ioppublishing.org.
List of Symbols

| ECSA (m2) |

| Specific ECSA (1/m) |

| Water activity |

| The concentration of the fixed positive charge in the ionomer (mol/m3) |

| Concentration of species  (mol/m3) (mol/m3) |

| Specific heat (J/(m3
 )) )) |

| Diffusion coefficient (m2/s) |

| Coefficient to relate  with with  (1/m) (1/m) |

| Faraday's constant (C/mol) |

| Exchange current density (A/m2) |

| Cell current density (A/m2) |

| Volumetric reaction current (A/m3) |

| Ionic conductivity (S/m) |

| Thermal conductivity (W  ) ) |

| Ion-exchange coefficient (1/s) |

| The order of exchange current density dependence on 
|

| Magnitude of flux (mol/(m2 ·s)) |

| Pressure (Pa) |

| Heat source (W/m3) |

| universal gas constant ( ) ) |

| Mass source term from reactions (kg/(m3 ·s)) |

| Mass source term from phase change (kg/(m3 ·s)) |

| Ion-exchange source term (mol/(m3 ·s)) |

| Temperature (K) |

| Equilibrium potential (V) |

| Velocity (m/s) |

| Molar fraction of gas species |

| Molar fraction of ion species |

| Charge number |
| Greek Symbols | |

| Symmetry coefficient |

| Effective transport coefficient 
|

| Permeability (m2) |

| Overpotential (V) |

| Electronic conductivity (S/m) |

| Porosity |

| Volume fraction of phase 
|

| Electroosmosis coefficient |

| Dynamic viscosity of phase  ( ( ) ) |

| Water chemical potential |

| Density (kg/m3) |

| Tortuosity factor |

| Electronic potential (V) |

| Ionic potential in ionomer (V) |

| Ionic potential in liquid electrolyte (V) |

| Mass fraction |
Hydrogen is a key energy carrier that can be used for various industrial applications. While steam methane reforming is the major source of hydrogen currently, cleaner, more efficient and sustainable pathways toward hydrogen production are necessary to meet the ever-increasing energy demand and more stringent environmental standards. 1–4 Low-temperature water electrolysis is a promising technique to generate high-purity hydrogen, especially when utilizing renewable or nuclear energy sources that generate little emission and pollution. 5 There are three major types of low-temperature water electrolyzers: conventional alkaline electrolyzers, proton-exchange-membrane (PEM) electrolyzers, and anion-exchange-membrane (AEM) electrolyzers. The alkaline electrolyzers employ concentrated liquid alkaline electrolyte and platinum-group-metal (PGM)-free electrodes that are separated by a diaphragm. They have been commercialized for decades, where their low cost of materials and good system durability make it widely deployed for large-scale industrial applications. However, the conventional alkaline electrolyzer is limited by a low operating current density and lack of pressurization. 6–9 To overcome these drawbacks, PEM electrolyzers with higher operating current densities and differential pressures have been developed, thanks to the introduction of solid electrolyte membranes such as Nafion that replace the liquid alkaline electrolyte and diaphragm. However, the strongly acidic environment requires the use of expensive PGM catalysts. 8,10–13 To harness the advantages of both the alkaline electrolyzers and PEM electrolyzers, AEM electrolyzers (Fig. 1) have been increasingly researched owing to the recent development of stable, high performing AEMs. 14–18 AEM electrolyzers combine the advantage of being able to use low or non-PGM electrocatalysts in the alkaline environment 19–24 and the capability to produce pressurized hydrogen.
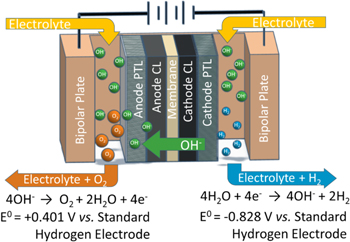
Figure 1. Schematic of an anion-exchange-membrane water electrolyzer. It consists of catalyst layer, porous transport layer and bipolar plate on each electrode. Hydrogen evolution reaction occurs on cathode and oxygen evolution reaction occurs on anode. Hydroxide transport from cathode to anode through the AEM.
Download figure:
Standard image High-resolution imageFigure 1 shows the schematic for the components and the electrochemical processes that occur in an AEM electrolyzer. The hydroxide ion-conducting AEM is sandwiched by two electrodes, i.e., the anode and cathode. It electronically isolates the electrodes but allows passage of hydroxide ions between them. Each electrode consists of catalyst layer (CL), porous transport layer (PTL), and bipolar plate (BP). When electrical power is applied to the electrolyzer, water in the cathode with the addition of electrons splits into hydroxides and hydrogen via the hydrogen-evolution reaction (HER). Due to the voltage difference across the cell, the hydroxide ions are driven across the AEM to the anode. In the anode, the hydroxide ions recombine into water and oxygen by losing electrons via the oxygen-evolution reaction (OER).
The high current-density operation in a practical electrolyzer requires the catalyst to facilitate the reaction at low overpotentials. This poses a challenge especially for the OER because of its inherently sluggish nature involving multiple steps and four electron transfers as reviewed elsewhere. 25–27 The OER polarization curves of IrO2 catalyst showed a clear trend as a function of the NaOH concentration. 28 The monotonic growth of OER activity was attributed to the increase of the pH. Such OER pH/activity trend was also observed in transition-metal oxide 29,30 and perovskite 31,32 catalysts. Therefore, it is evident that a higher pH is preferred for most OER catalysts under alkaline conditions. It is worth noting that, there is also significant progress reported on OER catalysts that worked at near neutral pH. 33–35 However, the overall device performance using the OER catalysts still suffers from some kinetic loss, low ion conduction and transport issues, especially at high current density. In addition, the use of buffer solutions for more neutral pH may cause challenges in an actual device, and non-precious metal oxides stability at near neutral pH may also be an issue. 12,30
Similar to OER, HER performance of Pt-based catalysts improves monotonically as the concentration of alkaline electrolyte increases. 28 It appears that cation adsorption that negatively impacts hydrogen oxidation reaction do not pose an obstacle for the HER activity of Pt-based catalysts. 36,37 While HER at near-neutral pH has been investigated to reveal the possibility of catalysts working at the relatively mild environment, 38–40 it was noted that the performance of liquid electrolyte flowing Pt catalyzed-AEM electrolyzers was much higher (e.g. 2 A/cm2 at 2 V). 41–43 When distilled (DI) water and solid alkaline ionomer were used, the performance and durability of AEM electrolyzers became lower (< 1 A/cm2 at 2 V ). 16,44,45 While adding KOH or other alkali metal solutions is known to improve cell performance, 46 it is critical to understand the specific mechanism of the performance improvement by adding alkali metal solution.
In this work, we investigate the hydroxide concentration effect on the performance of AEM electrolyzers and the mechanism of performance improvement. Our work differs from previous studies in that we apply both experimental and mathematical methods to elucidate the functionality of the liquid electrolyte explicitly and quantitatively. We used membrane electrode assemblies that consist of IrO2 anode, PtRu/C cathode, and alkaline stable anion-exchange polymer electrolyte. PGM catalysts are used in this study as a benchmark and since they provide higher performance than the alternatives. 43 First, we demonstrate the polarization curves and high-frequency resistances (HFRs) of the AEM water electrolyzers as a function of KOH concentration (0–1 M). Then, we describe the effect of hydroxide concentration on electrolyzer performance by a mathematical model. From the mathematical model, we decouple the effect of hydroxide concentration into OER and HER kinetics, electrochemical active surface area (ECSA), and ohmic resistance of AEM and electrode ionomer. Finally, we discuss the performance improvement mechanism with high concentration liquid electrolyte and propose strategies to design highly performing AEMWEs.
Methods
Materials and MEA Fabrication
Materials
Both the AEM and ionomer are hexamethyl trimethyl ammonium-functionalized Diels–Alder polyphenylene (HTMA-DAPP). 47 The ion exchange capacity and water uptake of HTMA-DAPP is 2.6 mequiv/g, and 58% at 30 °C, respectively. 48 The aryl ether-free polymers have high chemical stability under high pH conditions. 48 Undesirable electrochemical oxidation of HTMA-DAPP ionomer at a high anode potential may impact the electrolyzer performance. 49 To ensure that no adverse impact of electrochemical oxidation of the ionomer during the experimental data acquisition, we measured the stepwise current of the AEMWE as a function of the concentration of KOH over 4 h (Fig. S1 (available online at stacks.iop.org/JES/168/054522/mmedia)). We obtained reversible current during downward and upward scans, suggesting that HTMA-DAPP AEI can provide stable performance during the performance measurement using different concentration of KOH electrolytes. For anode and cathode catalysts, commercial IrO2 (Premion®) and PtRu/C (HiSPEC® 12100) catalysts were purchased from Alfa Aesar. We used PtRu/C as the HER catalyst instead of Pt/C catalyst to prevent undesired phenyl adsorption on the surface of HER catalyst. 50 Platinized titanium PTLs for the anode catalyst layer was obtained from Giner Inc. Commercial carbon paper (29BC, SGL) was used for the cathode catalyst layer.
Fabrication of MEA and single cell
The detailed MEA fabrication method was as described in the previous paper. 28 First, porous transport electrodes (PTEs) were fabricated using PTL, ionomer and electro-catalysts. The loadings of the anode and cathode PTEs were 0.75 mgIr/cm2 IrO2 and 0.36 mgPt/cm2 PtRu/C (50 wt.% Pt, 25 wt.% Ru), respectively. Before the cell assembly, the membranes were soaked in 1% KOH for 4 hours for ion exchange. The membrane was sandwiched between the electrodes, a set of nickel triple-serpentine flow field separator plates, gold-plated copper current collector plates, and compression plates. The MEA had a 5 cm2 active area and was operated in masked down 25 cm2 triple serpentine flow-fields using polytetrafluoroethylene (PTFE) gaskets. Compression was created by eight bolts using 4.52 Nm torque. After assembly, the cell was immediately connected to the test station to avoid MEA dry out.
Measurement
Conductivity of AEM
The hydroxide conductivity of stand-alone HTMA-DAPP was measured as a function of NaOH concentration. To measure through-plane conductivity, the membrane electrode assembly was fabricated. For the catalyst ink, commercial carbon-supported Pt (60 wt.% Pt on high surface area Carbon, HiSPEC 9100®) and carbon-supported Pt-Ru alloy (50 wt.% Pt, 25 wt.% Ru on high surface area Carbon, HiSPEC 12100®, Johnson Matthey) were mixed with the ionomer dispersions. The catalyst to ionomer ratio in the dispersion is 30%. The catalyst ink was applied to a gas diffusion layer (29BC, SGL) using a Sono-Tek's ultrasonic coating system. The catalyst loading is controlled to have the same Pt loading, ca. 0.6 mgPt/cm2 for Pt/C electrodes, and the catalyst loading is controlled to have 0.5 mgPt/cm2 and 0.25 mgRu/cm2 for PtRu/C alloy anodes. The gas diffusion electrodes (GDEs) were dried in vacuo at 60 °C for 30 minutes. MEAs were prepared by sandwiching the HTMA-DAPP membrane (15 μm thick (dry), 21.5 μm thick (wet)) between the two GDEs. The area specific resistance (ASR) was measured in a fuel cell mode operation at 60 °C. In the anode, H2 (300 sccm) with a mixture of NaOH solution was supplied. In the cathode, O2 (100 sccm) with a mixture of NaOH solution was supplied. The NaOH solution was supplied at 1.8 ml/min, which made the MEA completely flooded. Then the flow rate was changed to 0.6 ml/min. After the current density was stabilized to 0.1 A/cm2, the cell resistance was read from a frequency response analyzer. The cell resistance was converted to conductivity after decoupling the electronic resistance and ohmic resistance. 51 We repeated this process at least four times with increasing NaOH concentration and present the averaged values in Table I. The HTMA-DAPP ionic conductivity increases with the hydroxide concentrations in the liquid electrolyte and this effect has been implemented into the mathematical model.
Table I. HTMA-DAPP ionic conductivity at 60 °C as a function of the hydroxide concentrations.
 (mol/L) (mol/L) | 0 | 0.01 | 0.02 | 0.05 | 0.1 | 0.5 | 1 |
|---|---|---|---|---|---|---|---|
| Conductivity (mS/cm) | 18.4 | 23.8 | 32.2 | 37.4 | 40.8 | 51.1 | 57.4 |
Electrolyzer performance
We examined the performance of the cell with two types of solutions: (i) DI water (18.2 MΩ cm, Millipore Milli-Q), and (ii) 0.01, 0.05, 0.1, 0.5, and 1.0 M KOH solution. We began with 10 liters of DI water, which was poured directly into the feed tanks, flowed through the electrolyzer station and cell, and heated to 60 °C. After each round of testing, KOH pellets (from Sigma-Aldrich with ACS reagent grade) were carefully measured out and added to the two tanks to increase the concentration of the electrolyte. In Table SI, the amount of KOH added is listed for each concentration. The electrolyte continues to flow through the cell at 60 °C at a combined flow rate of 200 ml/min for at least 30 minutes before testing. Figure 2 shows the schematic of the test station used to run the tests. The electrolyte solution is circulated to both sides of the cell using a closed two-loop system. Two pumps, one for the anode and one for the cathode, draw solution from the two electrolyte solution tanks, each at a rate of 100 ml/min. A connector tube between the two tanks ensures that both tanks retain the same amount of solution, and that a uniform solution is pumped into the anode and cathode. One thermocouple is inserted into the cell hardware for cell temperature control using silicon encased heating pads. Two additional thermocouples are placed at the cell's anode and cathode inlets to measure and control the electrolyte solution temperature with two-line heaters. Finally, two thermocouples at the cell exhausts enable to record the temperature increase due to the exothermic reaction within the cell. After exiting the cell, the anode and cathode exhaust streams are returned to their respective solution containers, which also act as gas separators. Note that two separator systems are required to avoid mixing of the produced H2 and O2. For additional safety, both separators are also purged with a small N2 flow stream which removes the product gases from the system, while the solutions remain in the feed tanks and continue to be circulated. Measurements are taken with a Metrohm Autolab PGSTAT302N. Before testing, a constant 2.0 V hold is applied to the cell for one hour to break-in and condition the cell. The same instrument was used to conduct electrochemical impedance spectroscopy (EIS) experiments. The cell was perturbed at every voltage controlled operating point using 1% of the DC voltage and a frequency range of 100 kHz—100 mHz for perturbation. High frequency resistance (HFR) values were extracted from the EIS data by determining the x-axis intercept of the high frequency data in the Nyquist plot representation. Note that at the lowest and highest current points the EIS data were very noisy and did not allow for accurate extraction of the high frequency resistance. These data points were omitted from our data set. The detailed test procedure is described in the SI and a flow chart of the test procedure is shown in Fig. S2.

Figure 2. Schematic of the AEM electrolyzer testing station setup. Electrolyte solution is circulated to each electrode from the feed container which also acts as gas separator.
Download figure:
Standard image High-resolution imageMathematical modeling
The 1-D, continuum, two-phase AEM electrolyzer model is extended from our previous work, where a detailed description is given. 52 Here, we briefly introduce the physics and the major modifications made to study the KOH concentration effects. A summary of the key parameters is presented in Table SII including noting what was fit to experimental polarization curve and ex-situ data and what was taken from experiments.
Model description
Both liquid and gas transport in the porous media are studied by Darcy's law

where  ,
,  ,
,  and
and  are the density, effective permeability, dynamic viscosity, and pressure of phase
  respectively. The two source terms on the right-side account for reactions and water phase change. The pressure is set to 1 atm at the PTL/channel interface for both liquid and gas.
Gas diffusion is modeled by Stefan-Maxwell equation:
where  and
and  are mass and molar fractions of gas species
  respectively.
  is the gas mixture velocity.
  is the effective diffusion coefficient and is calculated as

where  and
and  are the volume fraction and tortuosity factor of the gas phase, respectively. The binary diffusion coefficient
  is dependent on the gas-mixture composition.
53
Gas compositions are set to fully humidified oxygen and hydrogen at the PTL/channel interface at the anode and cathode, respectively.
is dependent on the gas-mixture composition.
53
Gas compositions are set to fully humidified oxygen and hydrogen at the PTL/channel interface at the anode and cathode, respectively.
Electron transport is studied by Ohm's law

where  is the effective electronic conductivity and
  is the electronic potential.
  is the local volumetric reaction current and the kinetics will be discussed in more detail in the next section. Cell operating voltage and an arbitrary zero potential are specified at the outside boundary of the anode and cathode, respectively.
Ion transport in the ionomer phase (membrane and catalyst layer) is described by a modified Nernst-Planck equation
where  ,
,  ,
,  ,
,  ,
,  and
and  are the ionic conductivity, charge number, electroosmotic coefficient, diffusion coefficient, the concentration of the fixed positive charge in the ionomer, and mole fraction of species
  respectively. The three transport mechanisms include migration driven by ionic potential in ionomer phase,
  , streaming current driven by water chemical potential,
  , and diffusion driven by species concentration,
  . No-flux boundary conditions are set at the CL/PTL interfaces.
The conservation law is applied for  :
:

where  is the reaction current and
  is the ion-exchange between ionomer and liquid electrolyte, which is given by the Donnan equilibrium
52
is the ion-exchange between ionomer and liquid electrolyte, which is given by the Donnan equilibrium
52
where  is the ion-exchange rate coefficient,
  and
and  are the ionic potential and
  concentration in the liquid electrolyte, respectively.
Water transport in the ionomer phase is governed by electro-osmosis and diffusion
Ion transport in liquid electrolyte is modeled by Nernst-Planck equation

where  ,
,  ,
,  and
and  are the molar flux, the effective diffusivity, the concentration of species
  and the ionic potential in the liquid electrolyte, respectively. Liquid electrolyte compositions are specified at the PTL/channel interface.
Temperature is given by Fourier's law and conservation of energy
where  is the volume fraction,
  is the specific heat,
  is effective thermal conductivity. The three heat source terms on the right-hand side account for phase change, joule heating and chemical reaction, respectively. Thermal equilibrium between different phases is assumed in this study. The operating temperature (60 °C) is set at the PTL/channel interface.
OER and HER kinetics
The OER and HER kinetics for the catalysts used herein are determined via rotating-disk electrode (RDE) experiments 28 and implemented into the model.
OER: OER occurs in the anode, where water is electrochemically oxidized to evolve oxygen as shown in Fig. 1. To extract the OER kinetics from the RDE results, we first fit the Tafel equation to each of the polarization curves shown in Fig. 2a of Ref. 28 to get the exchange current density  for each
  concentration in the form of

where  is the transfer coefficient,
  is Faraday's constant,
  is universal gas constant. The fitting results are shown in Fig. S3a and Table SIV. The OER exchange current densities are reported in Table II. This exchange current density is implemented as a piecewise interpolation function of the hydroxide concentration into the Tafel equation for OER in the model.

where the specific ECSA,  , is the active catalyst surface area per unit volume of the catalyst layer. The overpotential
  will be discussed in more detail in the next section.
Table II. The exchange current densities for OER and HER at different hydroxide concentrations.
 (mol/L) (mol/L) | 0.01 | 0.02 | 0.1 | 0.5 | 1 |
|---|---|---|---|---|---|
 (mA/cm2) (mA/cm2) | 0.00242 | 0.00354 | 0.0129 | 0.0172 | 0.0256 |
 (mA/cm2) (mA/cm2) | 0.3439 | 0.4523 | 0.6067 | 0.7894 | 0.8885 |
HER: HER occurs in the cathode, where water is reduced to form hydrogen as shown in Fig. 1. Similar to the study of the OER, we first fit the Butler-Volmer equation to each of the polarization curves shown in Fig. 2 of Ref. 28 to get  for each
  concentration:
The subscript  and
and  denote anodic and cathodic, respectively. The fitting results are shown in Fig. S3b and Table SIV. The HER exchange current densities are reported in Table II. Next, the HER dependence on
  concentration is also implemented as a piecewise interpolation function of the hydroxide concentration into the Butler-Volmer equation for HER in the model

Electrochemical Active Surface Area (ECSA)
Figure 3 illustrates the ion-transport pathways between the AEM and CL. The catalyst particles can be classified into three types: (1) covered by ionomer; (2) not covered by ionomer but in contact with AEM; (3) not covered by ionomer and not in contact with AEM. When DI water is fed to the electrolyzer, the ions can only transfer from AEM to catalyst surfaces in the CL through type (1) and (2) as shown by the black arrows. When KOH solution is fed to the electrolyzer, the high hydroxide concentrations in the liquid electrolyte enables reactions on catalyst surfaces that are not covered by ionomer but can contact the liquid electrolyte (type(3)), thereby providing ionic conduction pathways as shown by the red arrows.
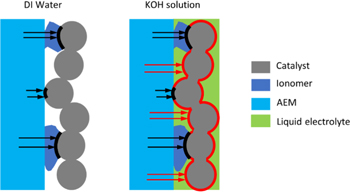
Figure 3. Illustration of the ion-transport pathways of a half cell (anode) when DI water and KOH solutions are fed to the AEM electrolyzers. The additional transport pathways through the liquid electrolyte are marked as red arrows. The catalyst/ionomer and catalyst/liquid-electrolyte interfaces are marked as black and red bold lines, respectively. Though the ionomer and AEM are marked in different colors to differentiate them, they are the same material in this study.
Download figure:
Standard image High-resolution imageThese dual pathways effectively increase ECSA and catalyst-layer utilization for non-DI water feeds. To account for this effect, the ECSA was explicitly separated into two parts,

where  ,
,  , and
, and  are the total ECSA, ECSA from catalyst/ionomer interface, and ECSA from catalyst/liquid-electrolyte interface, respectively. The two parts of ECSA, i.e.,
  and
and  , are illustrated in Fig. 3 as black and red bold lines, respectively.
  is determined by fitting the polarization curve data when DI water is fed to the electrolyzer.
  is assumed to be proportional to half-order of the hydroxide concentration in the liquid electrolyte. i.e.,

The coefficient  is obtained by fitting the experimental polarization curves at different KOH concentrations;
  is kept as a constant for all KOH concentrations without further fitting for each case. The half-order power in Eq. 16 is indicative of the CL structure and the transport of ions to the surface, and can be seen as related to a microscale tortuosity value and implicit Thiele problem dependence, and was chosen as it best represented the experimental data when used in conjunction with a single f value as shown later. It is valid within the range of experimental data but must eventually decay to the actual physical surface area (minus that covered by the ionomer) as
  goes to infinity. In terms of the kinetics, as discussed above, the reaction at the catalyst/liquid-electrolyte interface, i.e., the reaction on
  , is faster at higher KOH concentrations. Finally, it is worth noting that the driving forces, i.e. the overpotentials, for the reactions at the two different interfaces are different. The overpotential is defined as

where  is the electronic potential,
  is the ionic potential and
  is the equilibrium potential. For reactions at the catalyst/ionomer interface,
  is the ionic potential in ionomer, i.e.,
  In contrast, for reactions at the catalyst/liquid-electrolyte interface,
  is the ionic potential in liquid electrolyte, i.e.,
Finally, at high current densities, bubble evolution can result in mass-transport limitations due to part of the ECSA being covered by bubbles. An empirical relationship between the fractional bubble coverage and the superficial current density is implemented in the model. 54


where  is the superficial current density of the AEM electrolyzer. This bubble coverage effect impacts ECSA at both catalyst/ionomer and catalyst/liquid-electrolyte interfaces.
Results and Discussion
Experimental study
Polarization curves and HFR
With the help of RDE experiments, we have confirmed that high pH is instrumental for both HER and OER activities in alkaline water electrolysis. 28 Indeed, conventional alkaline water electrolysis employs a highly concentrated KOH solution (20–30 wt.%) as an electrolyte to boost its performance. 6 For the AEM electrolyzers, the anion-exchange ionomer and membrane are the solid electrolyte. In addition, the source of water ranges from concentrated KOH, K2CO3, KHCO3, to pure water. To verify the pH effect, polarization curves, and corresponding HFRs of the AEM electrolyzer are measured as a function of KOH concentration as shown in Fig. 4. The bulk pH of the system was regulated by the concentration of KOH flowing through the electrodes. The cell performance is highly pH dependent (Fig. 4a), which is consistent with the trends observed in HER and OER RDE experiments. 28 As the KOH concentration drops, both kinetic and mass-transport regions suffer from performance loss. The HFR doubles when switching from 1.0 M KOH to pure water (Fig. 4b). Additionally, at relatively high alkaline concentration (0.5 M or 1.0 M), the HFR remains almost constant as the current density increases to over 1.0 A/cm2. As shown in Fig. 3 , in pure water, without the additional transport pathways enabled by liquid electrolyte, the ECSA at the catalyst/liquid-electrolyte interface may be not effectively utilized, which results in kinetic losses because less ECSA is available to support the reaction. The ion-conducting capability of both the membrane and ionomer also hinders the high-current-density performance. The iR-corrected polarization curves as a function of the pH (Fig. 4c) show similar trends as Fig. 4a, indicating that the pH effect dominates the AEM electrolyzer performance not only through iR effects.
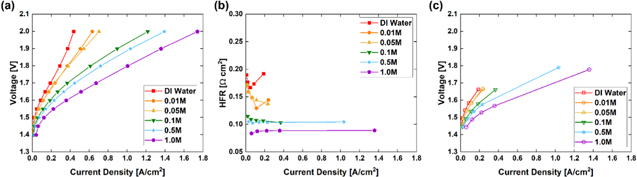
Figure 4. (a), Polarization curves, (b) HFR, and (c) AEM electrolyzer performance with HFR compensated as a function of KOH concentration. Catalyst: Cathode, PtRu/C 0.36 mgPt/cm2, Anode, IrO2 0.75 mgIr/cm2. Liquid electrolyte: KOH or DI water. Membrane and ionomer, HTMA-DAPP, AEM wet thickness: 50 μm. All the measurements were conducted at 60 °C and ambient pressure.
Download figure:
Standard image High-resolution imageModeling study
Model calibration and validation
To explore the observed trends in more detail, mathematical modeling is utilized. The model dimensions are adjusted to the experiment data, which are summarized in Table SIII. As we can see from Fig. 5a, the modeled polarization curves (dashed lines) are in good agreement with the experimental data (symbols). Small deviations at high current densities for DI water- and low concentration KOH-fed electrolyzers are probably due to the water mass transfer limit by bubble formation for the relatively low ECSA electrodes, which was not considered in our modeling. With the kinetics studied by RDE and implemented into the model, the separation of ECSA into two parts, and the HFR and ionic conductivities obtained from experiments, the model matches well with the experimental results for all KOH concentrations without further fitting for each KOH concentration. Figure 5b shows the normalized total ECSA as a function of the hydroxide concentration in the liquid electrolyte. The ECSA in Fig. 5b is normalized to the ECSA in the cell with DI water, i.e., the ECSA at the catalyst/ionomer interface. The total ECSA is 5 times higher in the cell that is operated with 1 M KOH compared to that with DI water, thereby indicating that only ∼16.7% of the catalyst surface is effectively utilized in the electrolyzer with DI water. Figure 5c shows the bubble coverage as a function of the cell current density. As current density increases, gas evolution becomes faster and more bubbles are generated. As a result, a larger portion of the catalyst surface is covered by bubbles, which effectively reduces ECSA and limits water mass transport.
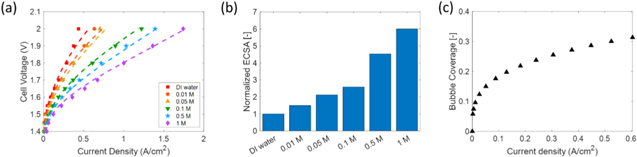
Figure 5. (a) Model calibration and validation by comparing the polarization curves with experimental data for DI water and different KOH concentrations. The symbols are experimental data and the dashed lines are model results. (b) Normalized total ECSA as a function of hydroxide concentration in the liquid electrolyte. (c) Bubble coverage as a function of the current density.
Download figure:
Standard image High-resolution imageCurrent distributions and applied-voltage breakdowns
Figure 6a shows the total volumetric reaction current distribution through the anode CL at a cell current density of 0.5 A/cm2 for different electrolyte concentrations. The cell with DI water exhibits a much higher reaction current in the vicinity of the AEM. With increasing distance from the AEM to the PTL, the reaction current decreases due to the lack of effective ion pathways and conductivity from the membrane towards the PTL. This is exacerbated in the DI water case because the accessible ECSA is much lower and thus the local reaction current, fluxes and bubble coverage at the local reaction site are all higher. As indicated by the data in Fig. 6a, as hydroxide concentration increases, the reaction current distributes more uniformly throughout the anode catalyst layer. The hydroxide in the liquid electrolyte enables reaction at the catalyst/liquid-electrolyte interface, which is compounded by the increased reaction rate due to higher hydroxide concentration as discussed in the kinetics section and shown in Fig. S4b. The ionic potential change in the liquid electrolyte is much smaller than that in the ionomer due to the liquid's significantly higher effective ionic conductivity, especially at high hydroxide concentrations. For example, the effective ionic conductivity of the liquid electrolyte in the catalyst layer with 1 M KOH is 27 mS/cm and that of ionomer is only 1.2 mS/cm. As a result, the reaction current from the catalyst/liquid-electrolyte interface distributes more uniformly than that from the ionomer (Fig. S4). Figure 6b shows the percentage of the reaction current from catalyst/liquid-electrolyte interface at a cell current density of 0.5 A/cm2. In the cell with DI water, the reaction entirely occurs at the catalyst/ionomer interface. As hydroxide concentration increases, the contribution of the catalyst/liquid-electrolyte interface to the reaction increases. In the cell with 0.05 M KOH, about half of the current is associated with the liquid electrolyte. In the cell with 1 M KOH, more than 80% of the current comes from the liquid electrolyte. Figure 6c shows the total volumetric reaction current distribution through the anode CL in the cell with 1 M KOH at different cell current densities. Because most of the currents come from the catalyst/liquid-electrolyte interface (Fig. 6d), the overall reaction current distribution is dominated by the currents from catalyst/liquid-electrolyte interface (Fig. S4d). Due to the much higher ionic conductivity of the liquid electrolyte at high KOH concentrations, only at large current densities, e.g. 1.8 A/cm2, the reaction current is clearly higher next to the AEM. In other cases, the reaction currents distribute uniformly through the anode catalyst layer. As shown in Fig. S4c, at high current densities, the current from catalyst/ionomer interface is much higher next to the AEM. As a result, at large current densities, the percentage of reaction current from catalyst/liquid-electrolyte interface decreases next to the AEM though it is still the major source of the current (Fig. 6d).
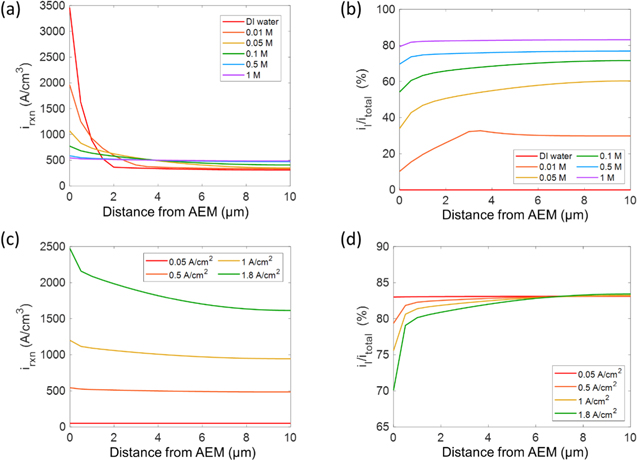
Figure 6. (a) Total volumetric reaction current and (b) percentage of reaction current from catalyst/liquid-electrolyte interface distributions through the anode catalyst layer at a cell current density of 0.5 A/cm2 for different KOH concentrations. (c) Total volumetric reaction current and (d) percentage of reaction current from catalyst/liquid-electrolyte interface distributions through the anode catalyst layer at different cell current densities in the cell with 1 M KOH.
Download figure:
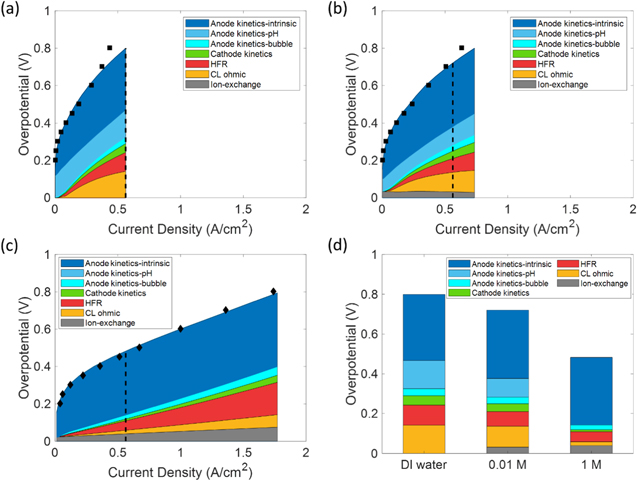
Standard image High-resolution imageThe applied-voltage breakdown of the cells with DI water, 0.01 M KOH and 1 M KOH is shown in Fig. 7. The applied-voltage-breakdown method is described in the SI; it allows one to ascertain the limiting phenomena in the cell. The cell overpotential is defined as the difference between the applied voltage and the thermodynamically prescribed voltage of the two half-reactions on anode and cathode. The cell overpotential consists of anode kinetic losses, cathode kinetic losses, HFR loss, catalyst-layer ohmic loss, and the loss due to ion-exchange between ionomer and liquid electrolyte. Figure 7d shows the comparison of the overpotential compositions at the same current density of 0.56 A/cm2, which is indicated by the dashed lines in Figs. 7a–7c. Figure 7 shows the following conclusions. In all cases, OER kinetic losses dominate at low current densities. The anode kinetic losses are further broken down into three parts: (1) Kinetic losses due to bubble coverage on the catalyst surface, which reduces ECSA.(2) Kinetic losses due to low hydroxide concentrations in the liquid electrolyte, i.e., the pH effect. This pH effect includes two aspects: (i) the ECSA at the catalyst/liquid-electrolyte interface is minimized for low to zero hydroxide concentrations (Eq. 16); (ii) the reaction rate at the catalyst/liquid-electrolyte interface is hindered at low hydroxide concentrations due to small exchange current densities (Eqs. 11–14). (3) The intrinsic kinetic loss which is calculated as the kinetics loss when there is 1 M KOH in the liquid electrolyte and there is zero bubble coverage on the catalyst surface. As the current density increases, gas evolution becomes faster and bubble coverage increases; thus, the anode kinetics loss due to bubble coverage also increases. In the cell with 1 M KOH, the reaction is fully enabled across a larger interfacial area, resulting in a negligible pH kinetic loss. In contrast, in the cell with DI water, the catalyst surface that is not covered by ionomer is not effectively utilized and the anode kinetic loss due to low pH constitutes a large portion of the kinetic overpotential. In the cell with 0.01 M KOH, this pH kinetic loss is smaller comparing to that of the cell with DI water. However, it still constitutes a large portion of the kinetic loss. Overall, the total anode kinetics loss is much smaller in the cell with 1 M KOH due to the extra hydroxides provided by the liquid electrolyte. The cathode kinetics loss is small in all cases due to the fast kinetics of HER with the use of highly active PtRu/C catalyst. Because the HER kinetics are faster at higher hydroxide concentrations,
28
the cathode kinetics overpotential is further minimized in the cells with high KOH concentrations. The catalyst-layer ohmic and HFR losses increase with current density and emerge as major contributors to the cell potential at high current densities. Since the ionic conductivity is much higher in the liquid electrolyte, the catalyst-layer ohmic loss is dominated by that of the ionomer. In the cell with high KOH concentrations, a large portion of current is conducted through the liquid electrolyte instead of the ionomer, which reduces catalyst-layer ohmic loss. Furthermore, from the experimental results, the ionomer ionic conductivity increases and HFR decreases with the  concentration in the liquid electrolyte. As a result, the catalyst-layer ohmic and HFR losses are much smaller in the cell with 1 M KOH. The ion-exchange between the two phases is governed by Donnan equilibrium.
52
This ion-exchange also consumes energy and results in the ion-exchange overpotential (i.e., a junction potential) as shown in Figs. 7b and 7c. This ion-exchange is faster at higher KOH concentrations, which results in a higher ion-exchange overpotential. However, the high concentration of
concentration in the liquid electrolyte. As a result, the catalyst-layer ohmic and HFR losses are much smaller in the cell with 1 M KOH. The ion-exchange between the two phases is governed by Donnan equilibrium.
52
This ion-exchange also consumes energy and results in the ion-exchange overpotential (i.e., a junction potential) as shown in Figs. 7b and 7c. This ion-exchange is faster at higher KOH concentrations, which results in a higher ion-exchange overpotential. However, the high concentration of  in the liquid electrolyte also facilitates the ion-transport. Overall, the summation of these aspects still results in a net beneficial effect on cell potential, i.e., the summation of the catalyst-layer ohmic and ion-exchange losses decreases with KOH concentration (Fig. 7d).
Figure 7. The applied voltage breakdown for (a) DI water, (b) 0.01 M KOH, and (c) 1 M KOH. The dashed line shows the location corresponding to the largest current density in (a). The bar graph in (d) shows the applied-voltage breakdowns at the same current density of 0.56 A/cm2, i.e., the current density indicated by the dashed lines. The cell overpotential is broken down into anode kinetic losses (blue), cathode kinetic losses (green), HFR loss (red), CL ohmic loss (yellow), ion-exchange loss (grey). The anode kinetic losses are further broken down into three parts: anode kinetic losses due to bubble coverage (light blue), anode kinetic losses due to low pH (medium blue), intrinsic kinetics loss (dark blue).
Download figure:
Standard image High-resolution image
Based on the above analysis, one may only need to flow KOH on the anode side of the cell and gain hydration and ionic effects due to transport through the membrane, as recently explored in water-vapor electrolysis
55
and  reduction modeling.
56,57
Such a scheme would allow for more efficient hydrogen compression and collection. As seen in the Fig. S5, flowing KOH on only the anode does indeed increase performance compared to the DI water case, however not as high as for flowing KOH on both electrodes. Further analysis and optimization of the cell design is beyond the scope of the current work as it depends on compression amounts and specific designs.
reduction modeling.
56,57
Such a scheme would allow for more efficient hydrogen compression and collection. As seen in the Fig. S5, flowing KOH on only the anode does indeed increase performance compared to the DI water case, however not as high as for flowing KOH on both electrodes. Further analysis and optimization of the cell design is beyond the scope of the current work as it depends on compression amounts and specific designs.
Conclusions
In this work, we investigated the effect of adding KOH electrolyte on the performance of AEMWEs. The polarization curves of AEMWE showed that the electrolyzer performance increased and the cell HFR decreased with increasing KOH concentration of the electrolyte. The mathematical model indicated multiple effects of using the liquid electrolyte: (1) lowered HFR; (2) significantly increased OER kinetics through (i) additional ion-transport pathways and increased ECSA and (ii) increased OER activity, i.e., increased exchange current density; (3) marginally increased HER kinetics; (4) facilitated ion-transport in ionomer by increased ionic conductivity. The mathematical modeling results indicated that the effect of using a high concentration of liquid electrolytes is more significant on OER kinetics than on AEM conductivity. Moreover, this result emphasizes the importance of hydroxide conductivity of the electrode and electrolyte distribution in the electrode for the AEMWE performance as shown in the high performance of AEMWEs with circulating 1 M KOH solutions. This study suggests that ionomers that have high ion exchange capacity and a large interface with electrocatalysts may significantly improve the AEMWE performance. Optimal CL formulations and high ECSA is critical for the development of AEMWEs operating without electrolyte. Besides, this research suggests that removing evolved gas bubbles from the catalyst-ionomer interface may be a critical factor for high current density performance for DI water-fed AEMWEs. The results presented herein demonstrate and quantitatively describe the gap between DI water and KOH feeds, and present routes towards bridging it (namely, catalytic, surface-area, and conductivity effects).
Acknowledgments
This work was funded under the HydroGEN Consortium by the Energy Efficiency and Renewable Energy, Hydrogen and Fuel Cell Technologies Office, of the U. S. Department of Energy under contract number DE-AC02–05CH11231 (LBNL), 89233218CNA000001 (LANL), DE-NA0003525 (SNL). This work was authored in part by the National Renewable Energy Laboratory, operated by Alliance for Sustainable Energy, LLC, for the U.S. Department of Energy (DOE) under Contract No. DE-AC36–08GO28308. Funding provided by U.S. Department of Energy Office of Energy Efficiency and Renewable Energy (EERE) Hydrogen and Fuel Cell Technologies Office (HFTO). The U.S. Government retains and the publisher, by accepting the article for publication, acknowledges that the U.S. Government retains a nonexclusive, paid-up, irrevocable, worldwide license to publish or reproduce the published form of this work, or allow others to do so, for U.S. Government purposes. The views expressed in the article do not necessarily represent the views of the DOE or the U.S. Government.