
Abstract
The durability of carbon supported PtCo-alloy based nanoparticle catalysts play a key role in the longevity of proton-exchange membrane fuel cells (PEMFC) in electric vehicle applications. To improve its durability, it is important to understand and mitigate the various factors that cause PtCo-based cathode catalyst layers (CCL) to lose performance over time. These factors include i) electrochemical surface area (ECSA) loss, ii) specific activity loss, iii) H+/O2-transport changes and iv) Co2+ contamination effects. We use a catalyst-specific accelerated stress test (AST) voltage cycling protocol to compare the durability of Pt and PtCo catalysts at similar average nanoparticle size and distribution. Our studies indicate that while Pt and PtCo nanoparticle catalysts suffer from similar magnitudes of electrochemical surface area (ECSA) losses, PtCo catalyst shows a significantly larger cell voltage loss at high current densities upon durability testing. The distinctive factor causing the large cell voltage loss of PtCo catalyst appears to be the secondary effects of the leached Co2+ cations that contaminate the electrode ionomer. A 1D performance model has been used to quantify the cell voltage losses arising from various factors causing degradation of the membrane electrode assembly (MEA).
Export citation and abstract BibTeX RIS

This is an open access article distributed under the terms of the Creative Commons Attribution 4.0 License (CC BY, http://creativecommons.org/licenses/by/4.0/), which permits unrestricted reuse of the work in any medium, provided the original work is properly cited.
PEMFCs represent a promising energy conversion technology to propel the next-generation of zero-emission electric vehicles (EV) using H2 as the fuel, although its widespread commercialization strongly hinges on decreasing cost and extending its lifetime. 1,2 Emphasis on PEMFC durability and lifetime becomes more critical with the recent shift in focus towards heavy-duty truck EV applications that demand less than 10% loss in rated power over cumulative fuel cell runtime of ∼30,000 h (roughly a million miles) compared to light-duty applications that demand only 8,000 h of operation. 3 Over its operational lifetime, fuel cells suffer from a loss in power produced due to various factors related to the degradation of the cathode catalyst layer. 4 It is critically important to gain an understanding of the various factors that cause degradation of an operating fuel cell in order to develop new materials and mitigation strategies for improved durability.
The current state of the art CCLs for O2 reduction reaction (ORR) is composed of carbon supported Pt or PtCo-alloy based nanoparticle electrocatalysts dispersed along with perfluorosulfonic acid (PFSA) ionomeric binder for proton transport. The performance and durability of the PEMFC MEA is strongly dependent on the underlying physico-chemical characteristics of the Pt/PtCo catalyst nanoparticles and the microstructural aspects of the catalyst layer. 5 Pt-based alloy electrocatalysts provide significant improvement in ORR specific activity thereby enabling a decrease in the usage of the precious metal content in the catalyst layer. Highly active PtCo-alloy nanoparticles are composed of Pt3Co core with a Pt-rich shell of ∼2 to 3 atomic layers that exhibit higher ORR catalyst activity by moderating the binding strength of reaction intermediates and efficiently breaking the double-bond in O2 molecule. 6 This moderation in adsorbate binding strength is enabled by the geometric strain induced by the sub-surface Co alloying element on the Pt-rich shell and/or an electronic ligand effect that modifies the electronic properties of the Pt-shell such as the d-band vacancy/center. 7 A Pt-rich shell that is neither too thin nor too thick (∼3 atomic layers) is typically desired to ensure a peak activity which is also designed to hinder the leaching of sub-surface Co. The underlying microporous nature of the carbon support plays a critical role in the distribution of the catalyst nanoparticles and its interaction with the PFSA ionomeric binder. 8–13 Pt/PtCo nanoparticles are present both in the internal and the external surface of the carbon support. 14,15 The presence of Pt/PtCo nanoparticles inside the carbon support is beneficial due to its higher kinetic activity as it prevents direct contact with the PFSA ionomer and improved durability wherein the porous structure prevents the migration of the nanoparticles. 10,16–18 On the other hand, the presence of Pt/PtCo nanoparticles inside the carbon support does pose transport barriers, particularly their accessibility to H+/O2. 8,10
While the current state of the art carbon supported PtCo materials are highly active for ORR, they suffer from loss in catalytic performance over time during operation in a fuel cell MEA under the influence of various chemical and electrochemical forces such as the corrosive acidic environment provided by the PFSA ionomer and the high potentials experienced in the cathode electrode environment. 19–22 Loss in CCL performance can be attributed to i) decrease in ECSA due to the catalyst nanoparticle size growth and ii) decrease in the intrinsic activity of the PtCo-alloy nanoparticle due to the leaching of alloying Co component, iii) contamination of the membrane and electrode ionomer by the leached Co2+ cations, iv) local-O2 transport resistance changes due to Pt redistribution with in the porous carbon support. These four aspects are discussed briefly here.
The growth in size of the catalyst nanoparticles arises due to coarsening attributed to i) Pt dissolution followed by redeposition in the membrane (i.e. the so-called "Pt-band" formation), ii) Pt dissolution from smaller particles and redeposition on larger Pt nanoparticles in the electrode (Ostwald ripening), iii) Pt adatom/particle migration and coalescence to larger Pt particles on the carbon support. 22–28 Pt-band formation and electrochemical Ostwald ripening appear to be the predominant mechanisms for surface area loss while Pt migration/coalescence appear to be a special case on graphitized carbon support. 10,16,24,28 Transition metal alloying element such as Co dissolve from the PtCo nanoparticles leading to significant loss in the intrinsic catalyst ORR specific activity. 29 While Pt dissolution is strongly dependent on the cathode potentials above 0.7 V, Co dissolution occurs at all potentials ≥ 0.1 V. 30,31 Besides the loss in specific activity, leached Co2+ cations contaminate the PFSA membrane and electrode ionomer by ion-exchanging with the sulfonic acid functional groups which is bound to have major implications. 29,32 Recent studies using electrode-edge micro-XRF measurements have shown clearly that Co2+ cations are transported into the CCL under the influence of the electrochemical potential (combination of diffusion and migration gradients) during fuel cell operation. 33,34 Finally, the impact of Pt/PtCo nanoparticles redistribution with respect to the pore-structure of the carbon support as a result of modified-Ostwald ripening mechanism has not been discussed in the literature. This could likely cause changes to the local-O2 transport resistance as the location of Pt nanoparticles continue to change during durability cycles.
It should be noted that some durability studies in the literature compare the degradation of Pt and Pt-alloy materials at different particle sizes. 16,35,36 Typical synthesis of Pt/C catalysts on porous high surface area carbons lead to an average Pt nanoparticle diameter of ∼2 nm with high beginning-of-life (BOL) ECSA of ∼80 m2 g−1. However, these 2 nm particles coarsen and lose ECSA rather quickly during durability cycling protocols via Ostwald ripening process largely driven by the reduction in surface energy. On the contrary, current state of the art PtCo alloy nanoparticle catalysts exhibit a BOL average particle size of ∼4 to 5 nm due to the heat-treatment steps involved in their synthesis to enable alloy-formation between Pt and Co. 20,37 4 nm PtCo nanoparticles feature a more modest BOL ECSA (<50 m2 g−1) and do not sinter significantly. 16,38 So, any comparison between the degradation of Pt and PtCo at disparate particle sizes leads to inconclusive results on the sources of durability related voltage losses. Few studies have been carried out in the literature discussing the durability of Pt and Pt-alloy catalysts degradation at similar particle sizes but did not show results at high current densities (>1.5 A cm−2). 38,39
In this article, we perform a direct comparison of carbon supported Pt and PtCo nanoparticles catalysts at similar average particle size and distribution. A variety of in situ electrochemical diagnostics and ex situ analytical tools have been used to understand the structural changes to the catalyst and the CCL. We then quantify the durability related cell voltage losses arising from changes in ECSA, specific activity, bulk-H+/local-O2 transport resistances. It is important to understand and quantify the voltage loss contributions from each of these factors so that mitigation strategies could be developed.
Experimental
Catalyst materials and membrane electrode assembly (MEA) fabrication
High surface area carbon (HSC) supported Pt and PtCo nanoparticle catalysts at a nominal metal loading of 30% by weight were procured from a commercial supplier. In consistency with our earlier work, the KetjenBlack® EC-300J carbon support used is labelled here as HSC-a. 8 The PtCo/HSC-a alloy catalyst has a nominal Pt:Co atomic ratio of 3:1. The synthesis of Pt/HSC-a catalyst followed the same steps as the PtCo/HSC-a except for the incorporation of the Co alloying element, i.e. the Pt/HSC-a catalyst was subjected to similar process steps including heat treatment as that of PtCo/HSC-a. This is a key aspect of the study in order to achieve similar properties of the catalyst such as the average particle size, carbon support surface characteristics etc. Cathode catalyst inks were made by dispersing the catalyst in n-propanol to water (3:1) solvent mixture with a PFSA ionomer featuring medium side chain length and an equivalent weight of 825 g mol−1 at an ionomer to carbon ratio of 0.9. Cathode inks were coated on decal substrates at various loadings ranging from 0.05 to 0.2 mgPt/cm2. All anode catalyst layers were composed of 10% Pt/C catalyst at a fixed loading of 0.025 mgPt cm−2 (ionomer to carbon ratio being at 0.6). MEAs with 5 cm2 active area were fabricated via decal transfer of the anode and cathode catalyst layers on either side of a 12 μm thick, 800EW PFSA membrane in the H+ form. Hot-press for MEA lamination was carried out at 146° and 1700 kPaa for 4 min. Roughly 230 μm thick carbon fiber paper-based gas diffusion layer was used on both the anode and cathode side. MEAs were also fabricated using membranes that were pre-doped with Co2+ cations following a procedure discussed elsewhere. 33 This involved immersion of the PFSA membrane in an aqueous solution of cobalt nitrate (Sigma Aldrich, ACS Reagent) and 0.1 M nitric acid (J. T. Baker, Instra-analyzed reagent grade). The concentration of the solution was adjusted such that 10% of the H+ sites in the membrane was exchanged by Co2+ cation. More details on the Co2+ doping of the membrane can be found elsewhere. 32–34
Transmission electron microscopy (TEM) of catalysts
As received Pt and PtCo powders were prepared for TEM characterization by immersing the samples in ethanol, followed by ultrasonication for approximately 10 s to ensure dispersion and subsequent deposition of the powder on a carbon/copper grid. The nanoparticles were analyzed with a JEOL 2010F TEM operated at 200 kV. In addition, fresh, annealed Pt/HSC-a and PtCo/HSC-a cathode catalysts at BOL and end of test (EOT) were prepared from 5 mm × 2 mm sections cut from active area MEAs. These sections were initially coated with a Gatan-J1 epoxy mixture to improve stiffness; placed in a mold filled with an Araldite 6005, benzyl dimethylamine, and docenyl succinic anhydride mixture; outgassed to remove air at the MEA/epoxy interface; and cured in an oven at 60 °C for 8 h. The cured molds were microtomed at room temperature to produce electron transparent MEA cross sections of less than 100 nm thickness. The nanoparticles present on the cathode side of these MEA cross sections were analyzed with a JEOL 2010F TEM operated at 200 kV and in bright-field mode.
To determine the particle size distributions, 200 particles were analyzed from each sample, using an algorithm in Matlab for automated segmentation of nanoparticles using bright-field TEM images. 40 This method, which is based on the concept of variance hybridized mean local thresholding, coupled with exclusion criteria, was applied to a database of randomly selected bright-field TEM images. Because each image contains a different number of distinguishable platinum particles, the number of images selected continued until 200 particles were collected. If a total of 200 particles were reached before analyzing all the distinguishable particles within an image, a random generator picked out the number of particles needed to complete the set of 200 from all the distinguishable particles in that specific image.
To determine the chemical composition of the catalysts, 100 nanoparticles were analyzed from each sample, by energy dispersive X-ray spectroscopy (EDS) coupled to the JEOL 2010F TEM. In particular, the atomic percentages of Pt and Co in these particles have been calculated from the EDX spectra with the standardless Cliff-Lorimer method. 41
Electron-probe microanalysis (EPMA)
Cross-sectional analysis were carried out to investigate the elemental distribution across the MEAs. EPMA performed on CAMECA Instruments, Inc. (Madison, WI, USA) model SX100 electron probe microanalyzer using a 15 keV probe with 20 nA current and a spot size of 0.6 microns. Pt M-α, S K-α, F K-α and Co K-α signals of the MEA cross-sections were collected on the fly with a speed of 10 msec/pixel over an area of 150 μm × 150 μm. Band profile of the elements was generated from element maps using SX100 software. Sample preparation of the MEAs was done by mounting 5 mm × 10 mm samples in brominated epoxy such that the cross-section of the sample is perpendicular to the surface of the mount. The samples are polished to mirror finish using different levels of SiC grinding and polishing papers and completed using 3 μm diamond polish. Kerosene is used as the coolant during grinding, polishing and final rinsing. The mount was immediately sputter coated with 2–3 nm Au-Pd alloy coating prior to loading in the sample exchange chamber of the EPMA system.
Electrochemical measurements and diagnostics
In situ characterizations of the cathode catalyst layers to quantify kinetic activities, H-adsorption electrochemical surface area (ECSA), CO adsorption/stripping ECSA, H2/air polarization curves, local and bulk O2 transport resistances, and H+ transport resistance were carried out in a single-cell test fixture comprising of 5 cm2 active area MEA (0.5 mm lands/channels). 9,42,43 Cyclic voltammetry was carried out at 30 °C, 100% RH, ambient pressure conditions by flowing H2 and N2 at 200 sccm rate over the working electrode and counter/reference electrode, respectively. Working electrode potential was scanned from 0.05 to 0.60 V followed by quantification of H-adsorption ECSA via integration of the area under the curve from 0.05 to 0.40 V. ORR activities were measured at 0.9 V using the polarization curves obtained with pure H2 and O2 as the reactant gases in the anode and cathode, respectively. The RH of the inlet gas was maintained at 100% with the cell temperature maintained at 80 °C at an absolute outlet pressure of 150 kPa. The activity at 0.9 V was determined using the Tafel plot which is a semi-log plot of the Ohmic-resistance corrected cell voltage vs H2 gas crossover corrected current density. Details on H2 gas crossover current density measurements are available elsewhere. 44 H2/air polarization curves with high stoichiometric feed of the reactant gases were measured at various operating conditions with cell temperatures ranging from 80 to 94 °C, RH values from 65 to 100%, and absolute outlet pressures of 150 to 250 kPa. High-frequency resistance (HFR) to quantify the sum of DC electronic resistance, contact resistances in MEA and H+ transport in membrane was measured at AC frequency of 5 kHz.
A cathode catalyst-specific AST durability protocol recommended by the U.S. Department of Energy was used in this study. The catalyst AST consists of 30,000 trapezoidal voltage cycles between 0.6 and 0.95 V. The dwell time at each voltage was 2.5 s and the ramp time was 0.5 s. 36 Each cycle takes 6 s. AST durability protocols were carried in 5 cm2 MEAs with H2/N2 flow at 200 sccm each, 80 °C, 100% relative humidity (RH) and ambient pressure.
Pt catalyst utilization was determined by CO electrooxidation (CO stripping) measurements at 80 °C at various RH values. Once the MEA reached the set temperature and RH values, the working electrode was purged with nitrogen (N2) gas for 1 min, and subsequently multiple cyclic voltammetry (CV) scans between 0.05 and 0.9 V were performed to clean the electrode surface. Later, the working electrode was saturated with 1% CO (balance N2) for 2 min. Finally, the working electrode was purged with N2 again for 1 min, and CO stripping was carried out by conducting a CV scan between 0.05 and 0.9 V. ECSA was calculated by integrating the CO stripping peak assuming a charge density of 420 μC cm−2 Pt. The CO stripping measurement was repeated from RH of 20% to 100%. Subsequently, the Pt utilization was calculated by taking the ratio of charge from CO stripping at the respective RH value to the charge obtained at 100% RH. The fraction of Pt-alloy nanoparticles exposed or directly in contact with the ionomer phase was calculated by dividing the CO stripping surface area measured at 20% divided by that at 100%. 15,45
RO2-local was calculated using the limiting current density measurements at low O2 partial pressures under operating conditions of 80 °C and ∼70% RH under differential cell conditions (1000 sccm of H2 and 5000 sccm of O2/N2 mixtures). 9,42,46 O2 limiting current densities were measured at potentials below 0.3 V at various O2 mole fractions (1% to 4%) as a function of outlet pressures (110 to 300 kPaabs). O2 limiting current densities measurements were carried out for each catalyst at three different cathode Pt loadings (0.05, 0.1, 0.2 mgPt cm−2). The total O2 transport resistance of the cathode electrode consists of both the pressure-dependent and pressure-independent terms. RO2-local can be extracted from the pressure-independent portion of the resistance. The procedure to extract RO2-local is as follows. 47,48 First, the total O2 transport resistance at any given outlet pressure is calculated as the slope of the plot between the limiting current density and O2 mole fraction. The slope of the plot between total transport resistance and outlet pressure gives the pressure-dependent resistance whereas the intercept at zero total pressure yields pressure-independent resistance. Subsequently, the slope derived from a plot of pressure-independent transport resistance vs the inverse roughness factor of the catalyst layer (derived from the hydrogen-underpotential deposition (HUPD) ECSA at various loadings) was measured as the experimentally determined RO2-local value.
Bulk proton transport resistance of the catalyst layer was measured using an electrochemical impedance spectra (EIS) methodology.
43,48
This involved the flow of H2 on the anode and N2 on the cathode at 80 °C, 275 kPaa and various RH values from 20% to 122%. EIS measurement was carried out to quantify proton conduction resistance at a DC potential of 0.2 V with 0.15 mV amplitude from a frequency of 0.5 Hz to 20 kHz with twenty points per decade. EIS profile was fitted to a transmission line model from which the proton transport resistance in the membrane (RH+,membrane) and the cathode catalyst layer (RH+,cathode) were obtained. The effective proton transport resistance ( ) in the cathode was then calculated by correcting the measured value according to the equation
  where
where  is a correction factor that accounts for the effect of catalyst utilization on the effective length for protons with the cathode to transport to the membrane.
49
is a correction factor that accounts for the effect of catalyst utilization on the effective length for protons with the cathode to transport to the membrane.
49
Results and Discussion
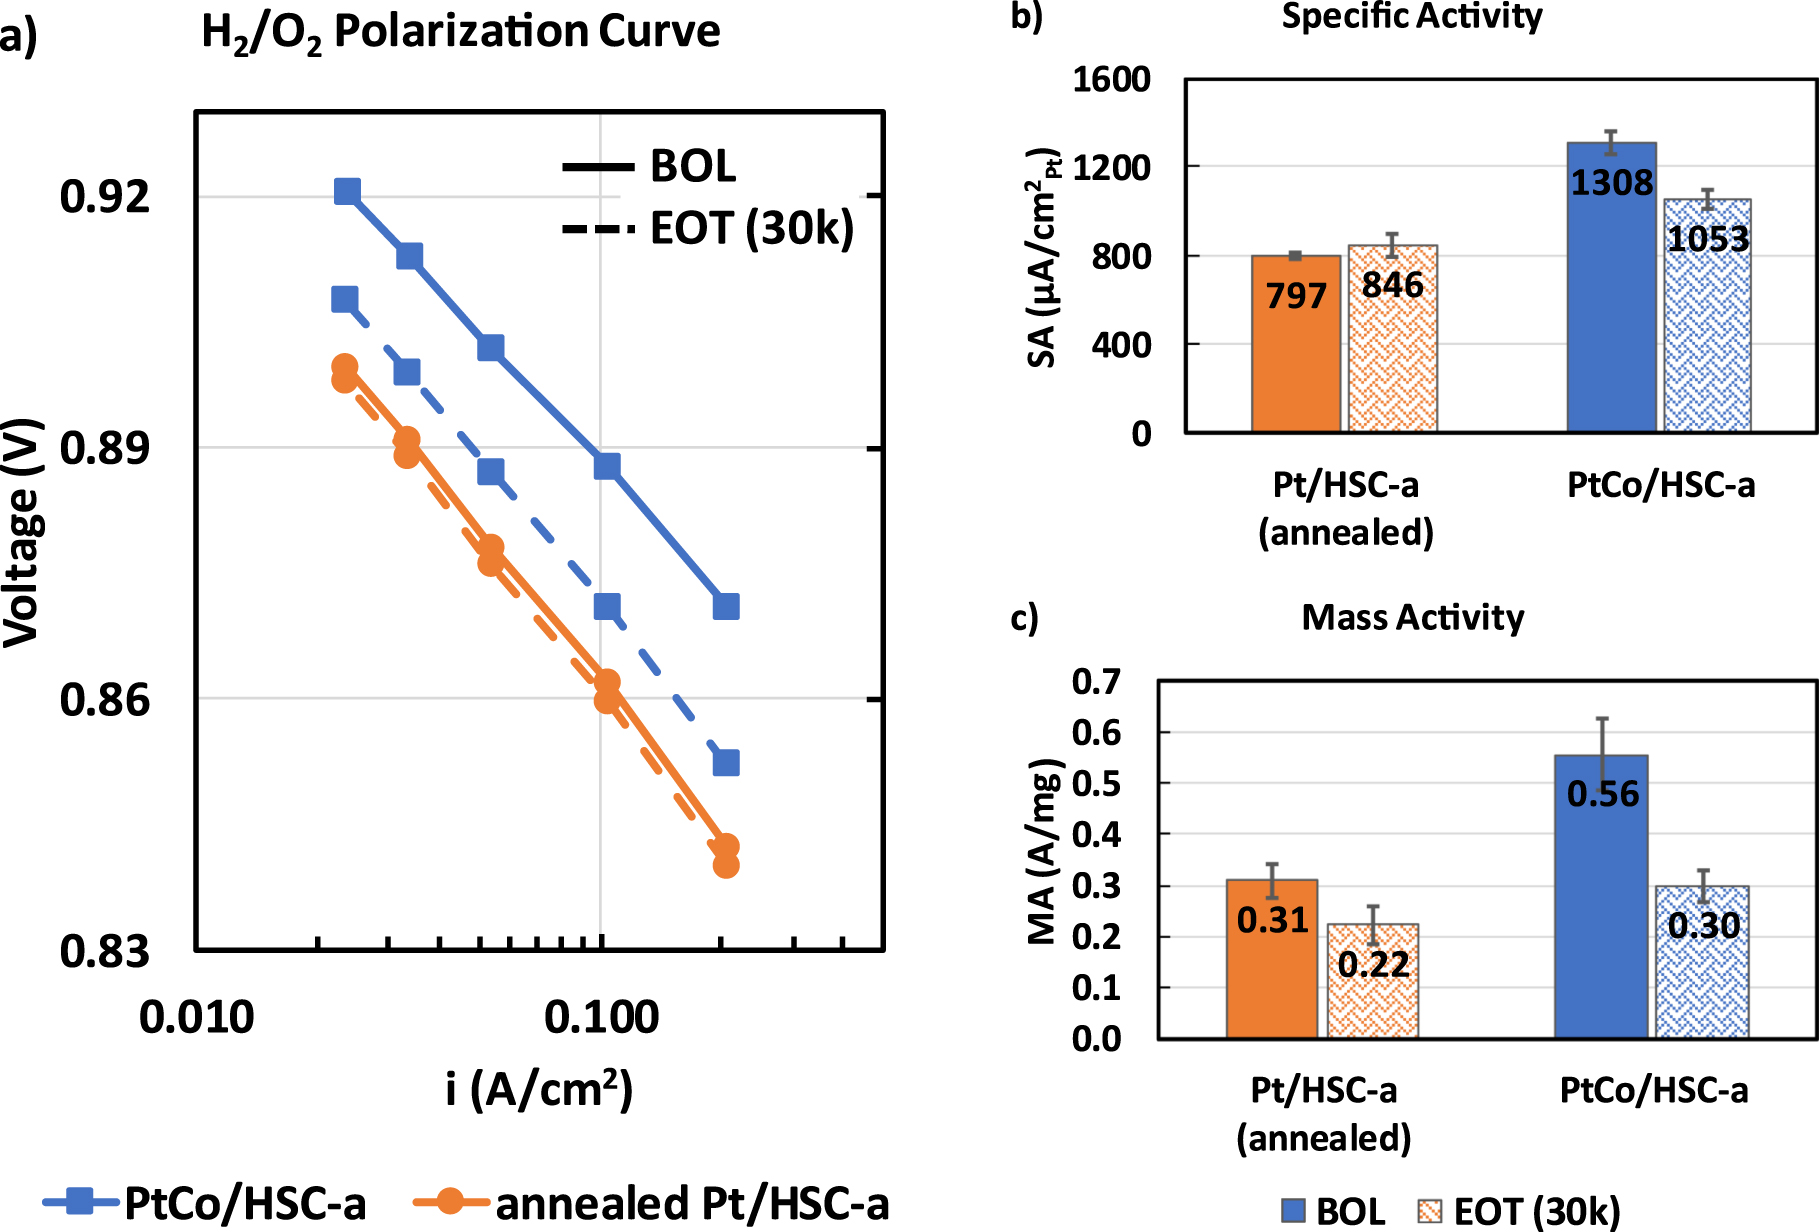
The two catalysts dealt with in this manuscript namely, annealed Pt/HSC-a and PtCo/HSC-a were synthesized via the same method including heat treatment to achieve similar particle sizes and distribution. Table I shows the BOL properties of the two catalysts. Pt/Co atomic ratio of as-received PtCo/HSC-a catalyst is 3.3. Annealed Pt/HSC-a and PtCo/HSC-a catalysts feature an average particle size of 4.3 and 4.5 nm, respectively along with an ECSA value quantified via Hupd measurements in an MEA of 39 to 42 m2/gPt. As is well-known because of alloying, PtCo/HSC-a catalyst shows a specific activity of 1308 μA cm−2 Pt which is 60% higher due to the alloying effect than the Pt/HSC-a catalyst. A higher mass activity is also observed (0.56 A/mgPt for PtCo/HSC-a vs 0.31 A/mgPt for annealed Pt/HSC-a).
Table I. Selected properties of annealed Pt/HSC-a and PtCo/HSC-a cathode catalyst at beginning-of-life conditions. Anode and cathode loadings of 0.025 and 0.10 mgPt cm−2, respectively.
| Catalyst | Pt/Co atomic ratio a) | Pt/PtCo average particle size (nm) b) | Hupd ECSA (m2/gPt) c) | Mass activity (A/mgPt) d) | Specific activity (μA cm−2 Pt) d) |
|---|---|---|---|---|---|
| ann. Pt/HSC-a | n/a | 4.3 | 39 ± 1 | 0.31 ± 0.03 | 797 ± 12 |
| PtCo/HSC-a | 3.3 | 4.5 | 42 ± 4 | 0.56 ± 0.07 | 1308 ± 55 |
a)measured from ICP analysis. b)measured from analysis of TEM images. c)measured from integration of Hupd area of cathode cyclic voltammogram in an MEA at 30 °C, 100% RH. d)measured from H2/O2 polarization curve in an MEA at 0.9 ViR-free, 80 °C, 100% RH, 150 kPaa.
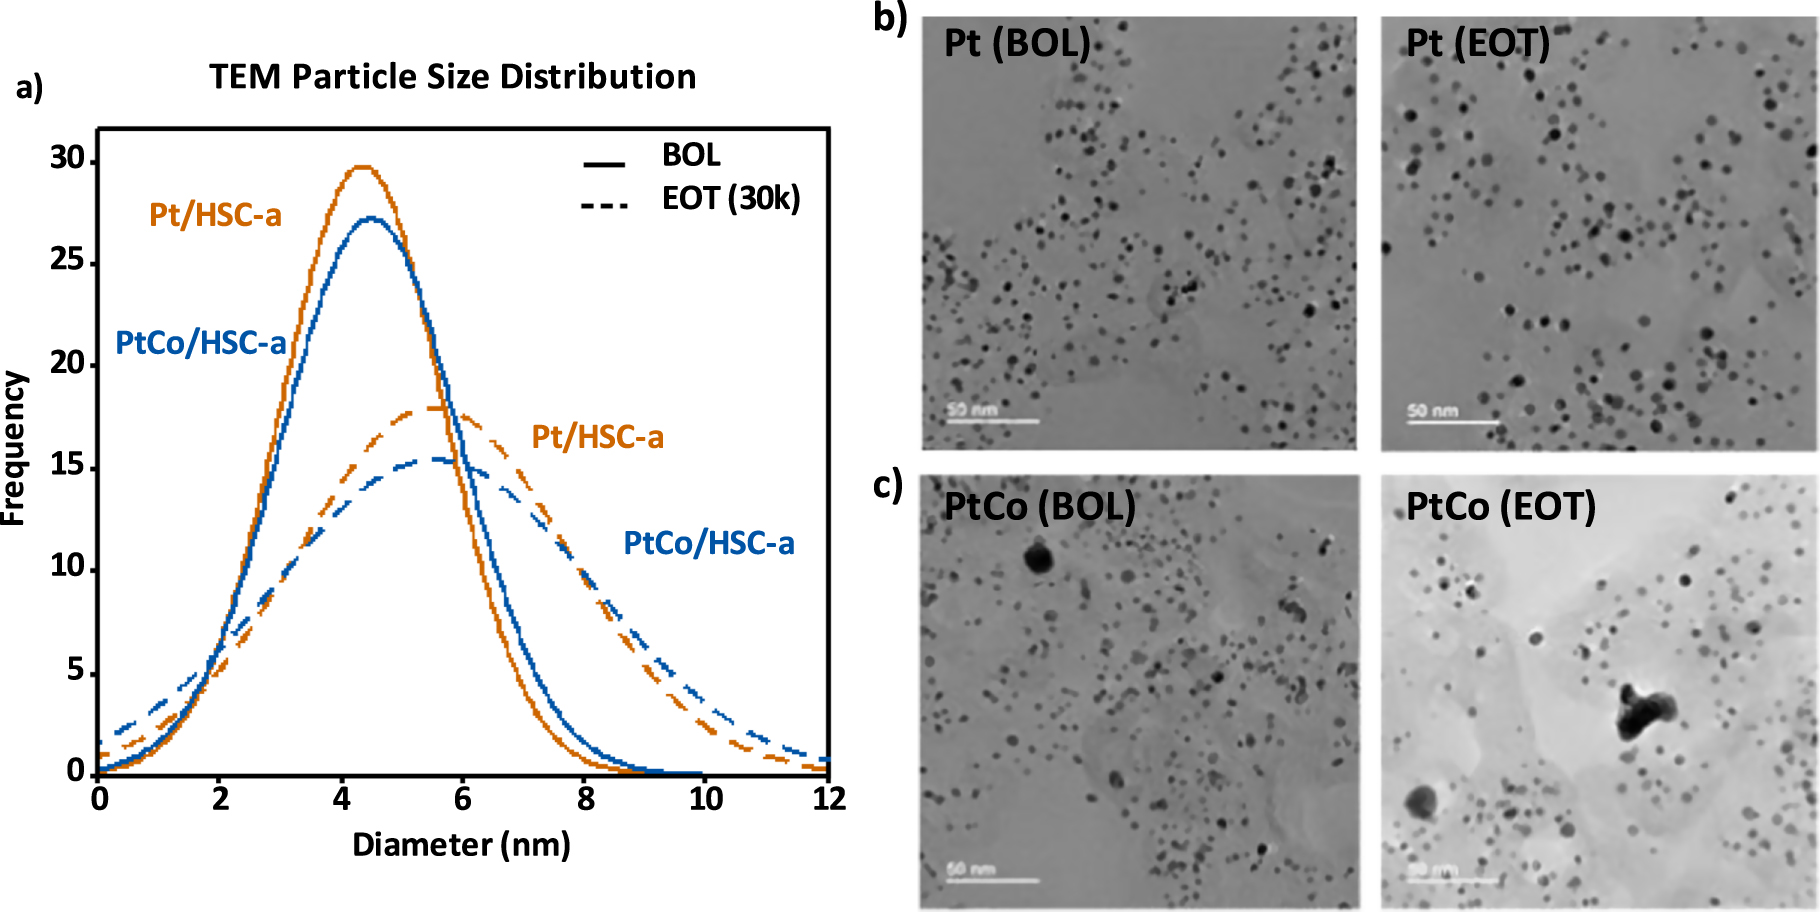
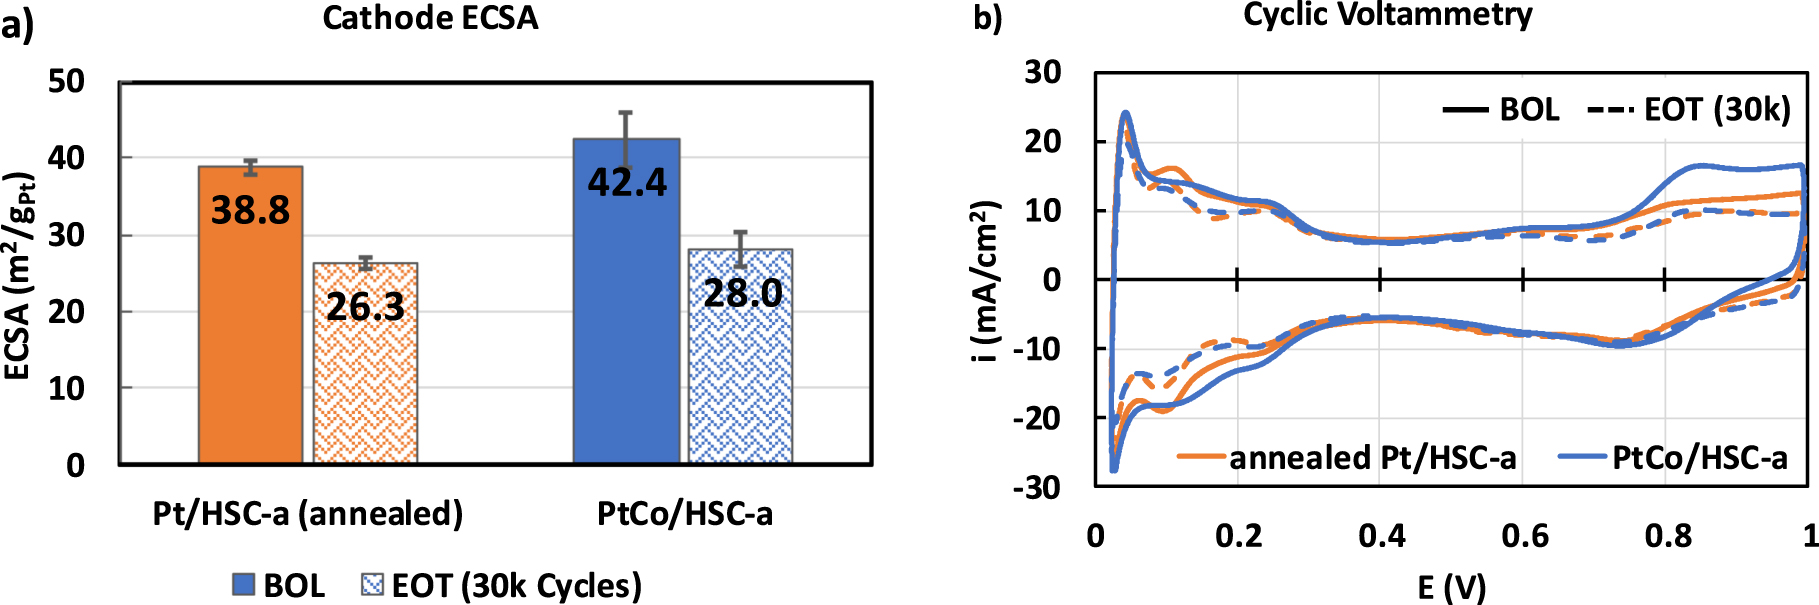
MEAs containing the annealed Pt/HSC-a and PtCo/HSC-a cathode materials were subjected to the catalyst AST protocol and characterized via various analytical procedure at EOT. Figure 1a shows the particle size distribution for the annealed Pt/HSC-a and PtCo/HSC-a cathode catalysts at BOL (solid lines) and EOT (dashed lines), whereas Fig. 1b shows corresponding bright-field TEM images. Clearly, the particle size distributions for the EOT samples have broadened significantly when compared with the BOL samples. The same trend is observed for the average particle size, which increased to ∼5.5 nm for both the catalysts at EOT. This behavior is expected after 30k cycles due to a variety of possible mechanisms, such as particles migration/coalescence, electrochemical Ostwald ripening and carbon corrosion leading to nanoparticle coarsening. 22,24 We should point out that the very large particles shown in the bright-field images were excluded from particle size distributions, as they are an exception and thus rarely observed. Higher average particle size and wider distribution observed at EOT is also reflected in the similar magnitude of ECSA loss after 30k cycles as shown in Fig. 2a. Both the catalysts show an EOT ECSA in the range of 26 to 28 m2 g−1 that corresponds to ∼33% loss in Pt surface area after 30k cycles. Figure 2b shows the cyclic voltammograms of the Pt and PtCo catalysts wherein the Hupd area of 0.05 to 0.4 V clearly decreases at EOT. Further, the Hupd peaks corresponding to the H-adsorption/desorption on the various facets of Pt nanoparticles reveal the loss of the alloying element Co in the PtCo/HSC-a catalyst. A broad featureless Hupd region is observed for PtCo/HSC-a at BOL in the anodic scan due to the alloying effect, which becomes more Pt-like at EOT as Co is leached from the alloy catalyst nanoparticles.
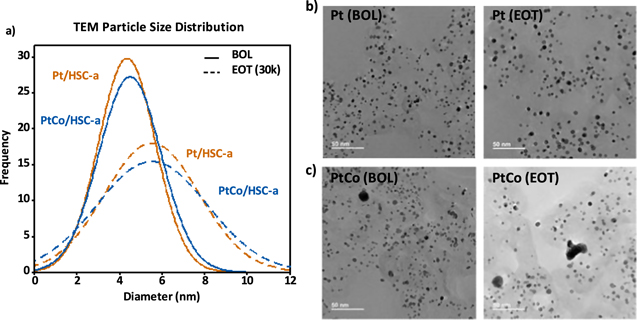
Figure 1. (a) TEM particle size distribution of annealed Pt/HSC-a and PtCo/HSC-a cathode catalyst at BOL (solid lines) and EOT (dashed lines). Representative TEM images of (b) annealed Pt/HSC-a and (c) PtCo/HSC-a at cathode catalyst layers BOL and EOT conditions.
Download figure:
Standard image High-resolution image
Figure 2. (a) ECSA measured via integration of Hupd area and (b) cyclic voltammetry of cathode catalysts at BOL (solid) and EOT (dashed) conditions in MEAs measured at 30 °C and 100% RH.
Download figure:
Standard image High-resolution imageFigure 3a shows the ORR kinetics of the two catalysts as measured via H2/O2 polarization curve. At BOL, PtCo/HSC-a catalyst clearly shows a much improved kinetics as reflected by ∼25 mV lower overpotential at 0.05 A cm−2 for ORR compared to the annealed Pt/HSC-a. Post-30k durability cycles, the kinetic benefit of the alloy catalyst decreases significantly with PtCo/HSC-a showing only ∼11 mV improvement at 0.05 A cm−2 compared to annealed Pt/HSC-a. As is well-known, this is due to the leaching of Co from the alloy catalyst that leads to a strain relaxation which was originally responsible for the higher activity. 7,36 It should be noted that the intrinsic kinetic activity of annealed Pt/HSC-a catalyst marginally increases post-30k durability cycles which is at least partly due to the increase in particle size. 16,50 This is clearly observed in the specific activity plot (Fig. 3b) wherein PtCo/HSC-a decreases from 1308 ± 55 to 1053 ± 44 μA cm−2 whereas annealed Pt/HSC-a increases marginally from 797 ± 12 vs 846 ± 52 μA cm−2. The mass activity does drop for both the catalysts post-30k cycles due to the loss in ECSA that leads to decrease in absolute H2/O2 performance normalized to the Pt loading (Fig. 3c).
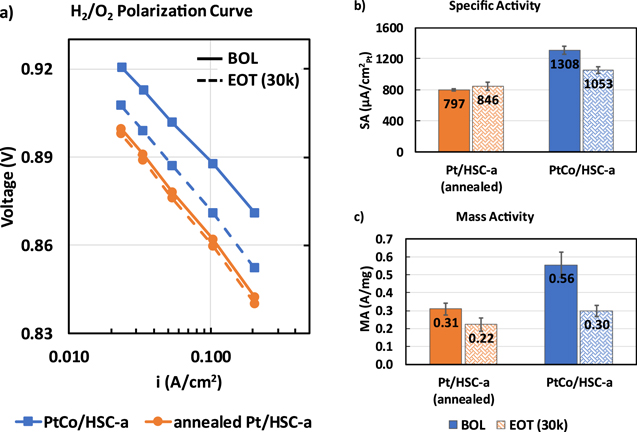
Figure 3. ORR kinetic behavior of annealed Pt/HSC-a and PtCo/HSC-a catalysts at 0.1 mgPt cm−2 cathode loading showing (a) H2/O2 polarization curves (solid lines—BOL and dashed lines—EOT measurements after 30k durability cycles), (b) specific activity and (c) mass activity. Measurements were carried out in a 5 cm2 differential cell at 80 °C, 100% RH, 150 kPaa operating conditions. Kinetic activities were calculated at 0.9 V after correction for Ohmic losses and crossover currents.
Download figure:
Standard image High-resolution imageFigure 4a shows the H2/air polarization performance of annealed Pt/HSC-a and PtCo/HSC-a catalysts at BOL and EOT conditions measured at 0.1 mgPt cm−2 loading up to an operating current density of 2.5 A cm−2. At BOL, PtCo/HSC-a catalyst provides significant benefit in performance compared to annealed Pt/HSC-a as measured by an improvement of ∼40 to 60 mV in cell voltage at all current densities up to 2.5 A cm−2. This significant improvement in cell voltage of PtCo/HSC-a is solely brought upon by the positive impact of the alloying element compared to annealed Pt/HSC-a catalyst at BOL. However, the relative performance of the two catalysts depict a drastically different picture after the 30,000 durability cycles. The H2/air polarization performance of annealed Pt/HSC-a is relatively unchanged whereas PtCo/HSC-a catalyst shows a significant drop. A closer look at the polarization curves in Fig. 4a shows the cell voltage of PtCo is only ∼10 mV better than annealed Pt at EOT conditions up to a current density of 1.0 A cm−2. Further at current densities greater than 1.5 A cm−2, a massive drop in cell voltage is observed for PtCo catalyst. At 2.5 A cm−2, PtCo catalyst has lost ∼200 mV compared to its own BOL performance and is also lower than annealed Pt catalyst by ∼115 mV at EOT conditions. While the loss in cell voltage of PtCo/HSC-a catalyst in the kinetic region can simply be explained by the loss in its specific activity due to the leaching of Co element from the alloy, the loss in high current density performance requires a more closer analysis of the transport properties of the cathode catalyst layer. HFR measured as a function of current density does not show any changes for both the catalyst containing MEAs at EOT conditions indicating that the membrane resistance has not changed measurably. This is expected since the catalyst-specific AST protocol does not cause any structural or compositional changes to the membrane.

Figure 4. Durability of annealed Pt/HSC-a vs PtCo/HSC-a catalyst: (a) H2/air polarization curves at 0.1 mgPt cm−2 showing the BOL (solid) and EOT (dashed lines) performance after 30,000 durability cycles. Measurements were carried out in a 5 cm2 differential cell at 80 °C, 100% RH, 150 kPaa operating conditions.
Download figure:
Standard image High-resolution imageVarious electrochemical diagnostics and ex situ characterization of the MEA were carried out to understand the sources of potential-cycling induced cell voltage losses: i) Hupd measurements to quantify Pt ECSA, ii) COads stripping as a function of RH to understand Pt utilization on carbon support, iii) H2/N2 impedance measurement to understand H+ transport resistance in CCL, iv) O2 limiting current density analysis to quantify local-O2 transport resistance in CCL. Further, TEM-EDS analysis were carried out to quantify Pt/Co atomic ratio in the cathode catalyst and EPMA analysis to quantify metal-cation distribution in the MEA.
Figure 5 shows the Pt utilization measured via COads stripping surface area measurement as a function of % RH (Pt-COads + H2O → Pt + CO2 + 2H+ + 2eˉ). This is a measurement to investigate the accessibility of Pt to H+/H2O. At a low enough RH of 20%, only the Pt nanoparticles in direct contact with the ionomer are active for COads stripping whereas the Pt nanoparticles present inside the micropores are inactive since they are not in contact with the ionomer. 15,45 Only at higher RH values of ≥ 60%, Pt nanoparticles inside the micropores become active for COads stripping due to the presence of condensed water. Hence, the utilization at 20% RH could be considered as a measure of the fraction of Pt present on the external surface of the carbon support in direct contact with the ionomer. As can be seen in Fig. 5a, at BOL both annealed Pt/HSC-a and PtCo/HSC-a catalysts show a utilization of ∼70 to 80% which increases to almost to 100% pointing to an improvement in the accessibility of Pt to H+/H2O. It is hypothesized here that two plausible structural changes in the CCL could lead to such an improvement in Pt utilization which are depicted in Fig. 5b: i) Pt nanoparticles in the interior pores of the carbon support undergo dissolution followed by redeposition on the external surface and/or ii) widening of the carbon microporous openings (due to surface carbon corrosion that occurs during catalyst AST potential cycling 51 ). These two structural changes could enable the apparent improvement in the utilization of Pt nanoparticles.

Figure 5. (a) COads stripping surface area measured as a function of RH in an MEA at 80 °C and 0.1 mgPt cm−2 cathode loading, (b) schematic representation of the possible structural changes occurring in the catalyst layer such as Pt redeposition on the external surface of the carbon support and/or the widening of the microporous openings in carbon primary particle (color codes: red—Pt/PtCo nanoparticles present inside the micropores of the carbon support at BOL, blue—nanoparticles redeposited on the external surface of the carbon support during durability cycling, yellow—nanoparticles originally present on the carbon external surface at BOL, green—PFSA ionomer film, gray—carbon primary particle).
Download figure:
Standard image High-resolution imageFigure 6 shows the local-O2 transport resistance measured at BOL and EOT conditions. Figure 6a is a plot of pressure-independent transport resistance as a function of inverse roughness factor for both the catalysts at BOL (solid lines) and EOT (dashed lines). The slope of the plot is a measure of the local-O2 transport resistance in the CCL which is captured as bar plots in Fig. 6b. 8 Several recent studies have shown that the local-O2 transport resistance in the CCL is directly correlated to the volume of micro- and small meso-pores in the carbon primary particle. 8–10 These internal pores impose a resistance to O2 transport and hence hinder the accessibility of Pt to O2. At BOL, both catalysts exhibit a local-O2 transport resistance of ∼12 s cm−1 which appears to decrease to ∼8 s cm−1 after 30,000 durability cycles. This is an interesting observation that indicates the resistance towards local-O2 transport in both the annealed Pt and PtCo-alloy CCL decrease after 30,000 catalyst-AST potential cycles. This result in conjunction with the Pt utilization measured via COads stripping indicates that the possible redeposition of the nanoparticles from the internal pores of carbon support to its external surface and/or the widening of microporous openings could result in the decrease of the local-O2 transport resistance.
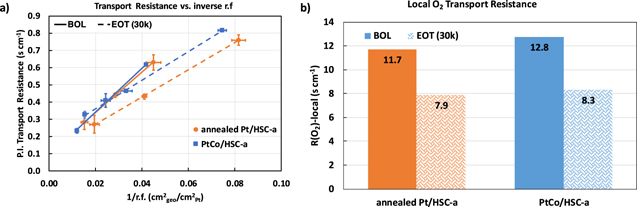
Figure 6. Local-O2 transport resistance measurements: (a) plot of pressure independent transport resistance vs the inverse roughness factor of the catalysts at BOL (solid) and EOT (dashed) conditions. The slope of the plot is a measure of the local O2 transport resistance that is shown as bar plots in (b).
Download figure:
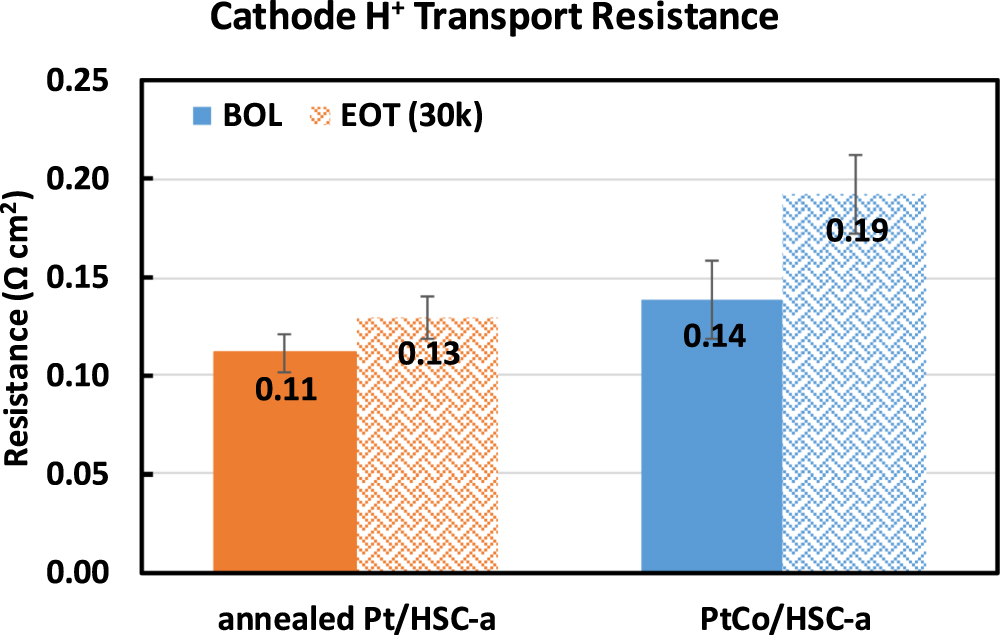
Standard image High-resolution imageFigure 7 shows the H+ transport resistance in the CCL measured via H2/N2 EIS protocol at BOL and EOT conditions. H+ transport resistance remains constant for the annealed Pt catalyst within the error level of the measurement whereas marginal increase is observed for the PtCo-alloy catalyst from 0.14 ± 0.02 to 0.19 ± 0.02 Ω cm2. It should be noted that the data in Fig. 7 corresponds to the resistance measurements at an inlet RH of 50% which is reasonably dry enough to capture minor changes in H+ transport resistance of the catalyst layer due to various cationic contaminants. At higher RH values (≥75%), the presence of small amounts of contaminants is usually not perceptible via H2/N2 EIS measurements. This measurement suggests the presence of contaminants that impedes the overall cationic transport in the bulk ionomer phase of the CCL. It is emphasized that the EIS measurement is only indicative of resistance trends because impedance measurements (AC signal) do not necessarily correspond to fuel cell operation under constant operating conditions. The AC signal ensures that the contaminant cations are mobile whereas under steady state conditions, the contaminant cation flux is equal to zero. 52

Figure 7. Cathode H+ transport resistance measured at 50% RH using H2/N2 electrochemical impedance spectroscopy method for annealed Pt/HSC-a and PtCo/HSC-a catalysts at BOL vs EOT samples subjected to 30,000 catalyst-AST potential cycles. Error bars represent standard deviation from measurements on three distinct MEA samples.
Download figure:
Standard image High-resolution imageFigure 8 shows the average Pt content as a function of the PtCo particle sizes for the BOL and the EOT samples, as well as a comparison of the Pt/Co atomic ratio for the pristine powder, the BOL and the EOT samples. For the case of the BOL sample (Fig. 8a), the atomic content of Pt increases as the particle size decreases, whereas for the case of the EOT sample (Fig. 8b), the Pt content remains approximately constant for all particle sizes. Regarding the BOL samples, the smaller particles exhibit thick Pt-rich shells when compared with their size. For larger particles, a significant amount of Pt segregates to the surface to form the shell, leaving the bulk depleted in Pt. 53 During cycling, the smaller particles dissolve and disappear (as shown in Fig. 1a), redepositing Pt on larger particles through Ostwald ripening. As a result, the EOT samples exhibit a rather constant Pt content for all particle sizes. Specifically, at EOT there is an enrichment of Pt atomic content to about 90% irrespective of the nanoparticle size. In addition, when the Pt/Co ratio is compared for the pristine powder and BOL samples, we notice a small enrichment in Pt content from 3.3 to 4.2. This is due to Co2+ dissolution during the various stages of MEA fabrication and testing such as catalyst ink milling and break-in. Further, after 30,000 durability cycles, there is a preferable Co dissolution with respect to Pt, where the Co remains in ionomer phase during the whole process, while the dissolved Pt can redeposit in larger particles as mentioned above. 23,30,53 Pt/Co atomic ratio increases to 10.2 after 30,000 durability cycles indicating significant Pt enrichment of the nanoparticles.
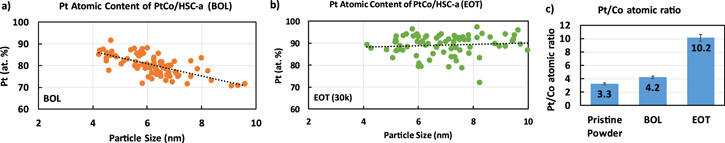
Figure 8. TEM-EDS analysis of the Pt/Co atomic ratio: Pt atomic content as a function of PtCo/HSC-a catalyst nanoparticle size at (a) BOL and (b) EOT (30k) conditions. (c) Pt/Co atomic ratio at various stages of MEA fabrication and testing.
Download figure:
Standard image High-resolution imageUsing the Pt/Co atomic ratio from TEM-EDS measurements, simple calculations were carried out to quantify the amount of sulfonic acid sites ion-exchanged with the Co2+ cations at BOL and EOT conditions. If all the leached Co2+ remains only in the membrane (12 μm thick, 800EW), ∼3% SO3 ˉ sites are calculated to be exchanged with Co2+ cations at BOL which increases to 9% at EOT. On the other hand, if all the leached Co2+ cations is assumed to remain in the electrode ionomer phase (0.9 I/C, 825EW), then it turns out that 26.5% of the SO3 ˉ sites are exchanged with Co2+ cations at BOL which increases to a significantly high value of 63.5% at EOT.
EPMA cross-sectional analysis of the PtCo-alloy catalyst MEA was carried out at BOL and EOT condition to detect the presence of various elements such as Pt, Co, F and S distribution across the MEA. EPMA map scans are shown in Fig. 9a whereas line-scans are shown in Fig. 9b. This measurement allows the detection and quantification of Co2+ cations in the membrane. At BOL, most of the Co is present in the CCL with only a small fraction present in the membrane. At EOT, an increase of Co content across the membrane is observed along with a decrease in the CCL.

Figure 9. Electron-probe microscopic analysis of the MEA containing PtCo/HSC-a cathode catalyst: Map-scans of distribution of Pt, Co elements across the MEA at (a) BOL and (b) EOT conditions. (c) line-scans of Co2+ distribution across the MEA (shown for reference is Pt line-scans to demarcate the anode, membrane and cathode regions).
Download figure:
Standard image High-resolution imageIt should be noted that EPMA is an ex situ measurement performed in vacuum which shows the Co2+ concentration distribution across the MEA under the absence of any gradients imposed by fuel cell operation. During fuel cell operation, Co2+ cations are under the influence of diffusion and migration gradients that transports Co2+ cations into the cathode thereby ion-exchanging with the acid sites in the electrode ionomer. As was recently shown by Cai et al., 32,33 movement of Co2+ cations into the cathode increases with various MEA operating conditions such as higher current densities, low RH and temperature. Co2+ cation accumulation in the cathode causes depletion of H+ thereby leading to i) decreased Pt utilization due to H+ inaccessibility, ii) decrease in H+ activity (pH effect) and iii) increased H+ transport resistances in the CCL. These impacts of Co2+ cation contamination is similar to the findings in several studies carried out in the past to investigate the impact of cation contaminants arising from leaching of metallic bipolar plates and external contaminants such as Na+ based ions in the cathode air feed. 34,54
In order to understand the presence of Co2+ cations in the membrane, MEAs were fabricated using annealed Pt/HSC-a cathode catalyst and membranes that were pre-doped with 10% Co2+ cations. This MEA was subjected to 30,000 durability cycles and the EOT performance was measured. As shown in Fig. 10, the H2/air polarization performance of the 10% Co2+ doped MEA with pure-Pt catalyst shows cell voltage comparable to the cycled PtCo/HSC-a catalyst. Particularly, the increased cell voltage loss profile at current densities greater than 1.5 A cm−2 is reflective of PtCo/HSC-a catalyst at EOT conditions. This provides a confirmation that the presence of dissolved Co2+ cations in the membrane and its accumulation in the CCL is responsible for the significant cell voltage losses of cycled PtCo/HSC-a catalyst at high current densities. It can be noticed in Fig. 10 that the shape of EOT polarization curves at current densities ≥1.75 A cm−2 is complex. Voltage gap between BOL and EOT curves increase from 1.75 to 2.25 A cm−2 and tends to form a plateau from 2.25 to 2.50 A cm−2. The increases in voltage loss from 1.75 to 2.25 A cm−2 is attributed to the transport of Co2+ cations into the CCL. On the other hand, the plateau formation from 2.25 to 2.50 A cm−2 is likely due to a H2 pumping phenomena that was observed earlier with cation contaminated MEAs at high current densities. 34
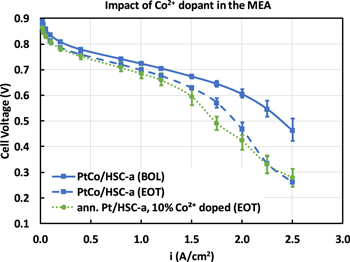
Figure 10. H2/air polarization curve showing the impact of 10% Co2+ cations pre-doped into the membrane. Polarization curve measured at 80 °C, 100% RH, 150 kPa at 0.1 mgPt cm−2 cathode loading.
Download figure:
Standard image High-resolution imageA 1D-performance model was used to fit the experimental polarization curves and understand the various durability related cell voltage loss factors (see Appendix for details). Figure 11 shows a good agreement between the experimental and model generated polarization curves up to current densities of 2.5 A cm−2. Figure 12 shows a breakdown of the voltage losses and gains at 2.0 A cm−2 arising due to the 30,000 durability cycles from various CCL-specific factors such as changes in ECSA, specific activity, local-O2 transport resistance and Co2+ contamination effect. In the case of the annealed Pt/HSC-a catalyst, cell voltage loss due to the decrease in ECSA appears to be the major factor which is compensated by the cell voltage gains from both specific activity improvement and decrease in local-O2 transport resistance. On the other hand, for the PtCo/HSC-a catalyst, cell voltage loss due to ECSA decrease continues to be the major factor. A minor contribution from specific activity loss of PtCo catalyst is also observed (first-order effect of Co2+ dissolution from the catalyst nanoparticles). A marginal gain from the decrease in local-O2 transport resistance is observed. Unlike, the annealed Pt catalyst, a major cell voltage loss factor due to the impact of Co2+ cation contamination of the electrode ionomer is observed for the PtCo (second-order effect of Co2+ dissolution). In summary, annealed Pt and PtCo catalysts show roughly similar magnitude of cell voltage losses due to the decrease in ECSA. However, for annealed Pt catalyst this does not translate to total cell voltage loss due to compensatory effect from improvement in specific activity and decrease in local-O2 transport resistance. Contrarily for PtCo catalyst, cell voltage losses due to the decrease in ECSA is compounded by the losses arising from the decrease in specific activity and the Co2+ contamination effect.

Figure 11. Comparison between experimentally measured H2/air polarization performance data (symbols) and 1D-performance model (lines) for (a) annealed Pt/HSC-a and (b) PtCo/HSC-a cathode catalysts containing MEA. Polarization curve measured at 80 °C, 100% RH, 150 kPa at 0.1 mgPt cm−2 cathode loading.
Download figure:
Standard image High-resolution image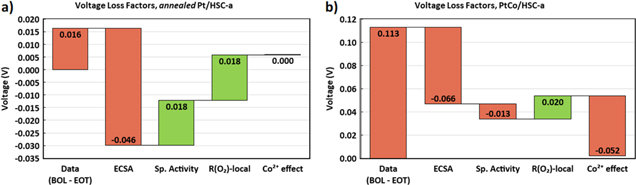
Figure 12. Waterfall chart showing voltage losses at 2.0 A cm−2 induced by various cathode catalyst layer specific factors due to the durability cycles for (a) annealed Pt/HSC-a and (b) PtCo/HSC-a containing MEAs as predicted by the 1D performance model. The first bar in each plot corresponds to the difference in experimental cell voltage data between BOL and EOT conditions at 2.0 A cm−2. The other bars are those predicted by the 1D performance model. (Color codes: Red—voltage loss and green—voltage gain).
Download figure:
Standard image High-resolution image
Conclusions
A direct comparison of the durability of high surface area porous carbon-supported annealed Pt and PtCo catalyst at similar particle sizes have been carried out to understand the factors that cause cell voltage losses at high current densities. Our results clearly show that:
- 1)Both annealed Pt and PtCo catalysts exhibit similar ECSA losses upon 30,000 durability cycles, but PtCo suffers from significantly high cell voltage losses at current densities greater than 1.5 A cm−2.
- 2)The decrease in specific activity of PtCo catalyst due to Co2+ dissolution corresponds to only ∼13 mV in cell voltage losses which can be used to explain the losses in the kinetic region. However, the impact of Co2+ contamination of the electrode ionomer is significantly higher leading to ∼52 mV loss at 2.5 A cm−2. Transport of Co2+ contaminant into the cathode during fuel cell operation at high current densities appears to be the predominant reason for large cell voltage losses in the PtCo catalyst containing MEA.
- 3)Changes in Pt location distribution due to electrochemical Ostwald ripening and/or surface carbon corrosion during catalyst-AST durability protocol leads to a decrease in local-O2 transport resistance that enable ∼20 mV cell voltage gains post 30,000 durability cycles.
Given the secondary effects of the dissolved Co2+ cations on the high current density performance, our study clearly points to the need for highly active and durable Pt-alloy catalysts that are resistant to the dissolution of the alloying element.
Acknowledgments
This work was partially supported by U.S. Department of Energy, Office of Energy Efficiency and Renewable Energy under grants DE-EE0007651 and DE-EE0008821. Paulo Ferreira was partially supported by FCT, through IDMEC, under LAETA, project UIDB/50022/2020. NR would like to thank Dr Srikanth Arisetty for useful discussions. The authors would like to acknowledge David Lindsey, Kenneth Holt, Cristin Keary, Shruti Gondikar, Venkata Yarlagadda and Kathryn Stevick of GM for engineering support.
Appendix
Appendix. Model development
In our previous paper, 8 we described an electrode model that considers catalyst morphology, particularly accounting for ORR taking place at both interior and exterior Pt surfaces. Whereas ORR current at the exterior Pt surface is affected by the local oxygen transport resistance (RPt-ionomer) due to Pt-ionomer interaction, an overall effectiveness factor is evaluated based on O2 transport through micro-/meso-pores of HSC particles for the interior Pt. The effective oxygen permeability in micro-/meso-pores (relating to porosity/tortuosity) was obtained by fitting to the measured polarization curves. In this work, instead of tuning porosity/tortuosity, we have developed a semi-empirical correlation for the overall effectiveness factor of interior Pt in terms of Pt loading (LPt), electrochemically active area (ECA), and applied current density (iapp)

utilizing the experimental data (polarization curves, ECSA, specific activity, electrode H+ resistance, and RO2-local) taken from cells built with Pt/HSC catalyst at both BOL and EOT.
Appendix. Impact of Co cation contamination
With the above-obtained overall effectiveness factor for interior Pt, one can further utilize the experimental data taken from cells built with PtCo/HSC catalyst to develop a semi-empirical correlation for the effect of Co2+ contamination. As electrode degrades, Co cations leach out of PtCo/HSC catalyst and contaminate ionomer by occupying proton sites. This would result in lowered activity of protons involved in ORR and thus incur a higher kinetic loss. In an extreme scenario, cations are driven towards cathode and effectively deactivate a portion of cathode adjacent to MPL, 55 which would cause a large voltage loss at a high current density. Furthermore, lower relative humidity (RH) in cathode catalyst layer leads to more ORR closer to membrane, which would incur additional voltage loss. Therefore, we evaluate the effective Pt loading under the influence of the mole fraction of proton sites occupied by Co cation (xCo), applied current density (iapp), and cathode RH (RHcath)

which is then used in Eq. A·1 for calculating the overall effectiveness factor for interior Pt.
Appendix. Effect of ionomer EW
Given I/C and ionomer EW, the volume fraction of ionomer in an electrode can be calculated by, 48

where I/C is the weight ratio of ionomer to carbon in the electrode, ft is 28 ± 2 μm/(mgC cm−2 ) for I/C <3/1, dm,dry is the density of dry ionomer, dw is the density of water, Mw is the molecular weight of water, and λ is water content depending strongly on RH. According to Eq. A·3, volume fraction of ionomer is proportional to I/C ratio and inversely proportional to EW (due to larger swelling at lower EWs). At a given λ, lower EW and higher I/C lead to a higher volume fraction of ionomer which effectively decreases electrode porosity, thus increasing local oxygen transport resistance and tendency to agglomerate (or equivalently reduced amount of interior Pt). Therefore, one can use the following empirical correlations to account for the effect of ionomer EW

and

Here, iapp is included as the impact of O2 transport resistance which increases with current density. It is worth mentioning that these semi-empirical correlations are supposed to be material specific. However, it is expected that the dependent variables would apply to other material sets, and only empirical coefficients may vary.