
Abstract
In this study, we present a novel cell design for liquid electrolyte-based lithium-ion batteries (LIBs) to detect the lithium distribution across an electrode by neutron depth profiling (NDP). This newly developed cell design allows to obtain electrochemical data comparable to a standard laboratory cell making use of 500 μm diameter holes to assure a homogeneous compression over the entire electrode area. We present operando NDP data recorded during the formation of a porous graphite electrode where we can both distinguish between irreversibly bound lithium within the solid electrolyte interphase (SEI) and reversibly intercalated lithium into graphite, and quantify the lithium concentration profile across the electrode. The amount of lithium reversibly intercalated into the graphite electrode (≈LiC6), based on one lithium per electron of charge (1 Li/e−), was found to corroborate well with the lithium amount quantified using operando NDP. However, comparing the irreversible capacity with the amount of lithium detected as SEI within the graphite anode, a significantly smaller Li/e− ratio was observed. Furthermore, we confirm that small amounts of lithium alloy into the copper current collector, using NDP and complementary ex situ X-ray photoelectron spectroscopy (XPS).
Export citation and abstract BibTeX RIS

This is an open access article distributed under the terms of the Creative Commons Attribution 4.0 License (CC BY, http://creativecommons.org/licenses/by/4.0/), which permits unrestricted reuse of the work in any medium, provided the original work is properly cited.
This was Paper 268 presented at the Atlanta, Georgia, Meeting of the Society, October 13–17, 2019.
Neutron depth profiling (NDP) is a non-destructive nuclear analytical technique, which enables the in situ/operando monitoring of the lithium concentration during charging/discharging of lithium-ion batteries (LIBs) across the thickness of the electrode with a (sub-) micrometer spatial resolution. The sample is homogeneously illuminated using a cold neutron beam, whereby the 6Li(n,3H)4He reaction produces two types of charged species with well-defined initial energies, namely a 4He2+ particle (alpha particle) and a 3H+ particle (triton particle).1 When traveling through any sample material (e.g., through an electrode), the 4He2+ and 3H+ particles lose part of their energy, and a measurement of their energy distribution allows to quantify the lithium concentration distribution as function of depth.2 Chemical bonds of the investigated 6Li nuclei with the surrounding material do not alter the reaction cross-section or the energy of the produced daughter nuclei, which are in the keV regime. Since NDP is thus not sensitive to the chemical environment, it probes the local sum of active lithium, irreversibly attached lithium, and lithium salt in the electrolyte in the same manner; therefore, to distinguish between these different lithium species, suitably chosen reference measurements are required, as will be outlined in this study.
Within the field of battery research, NDP can be utilized to measure fresh or post-mortem electrode samples ex situ with relatively little experimental effort. For ex situ samples measured in a typical NDP chamber under reduced pressure (10−5 mbar) the viewing depth is only limited by the density and elemental composition of the sample itself. For example, a graphite electrode with a porosity of 30% has a viewing depth of ≈45 μm, owing to the relatively low crystallographic density of graphite (≈2.2 g/cm3).3 Thus, Whitney et al.4 and Nagpure et al.2 used ex situ NDP to study the growth of the solid electrolyte interphase (SEI) layer on graphite electrodes that underwent different cyclic and calendaric ageing processes. In a recent publication by Wetjen et al.,5 the lithium from electrolyte decomposition products in silicon-graphite composite electrodes that accumulates around the active material particles was probed by ex situ NDP after cycling the material for different cycle numbers. The homogeneous lithium concentration across the electrode thickness after extensive cycling suggested a homogeneous active material utilization across the electrode thickness, and it was shown that the cumulative irreversible capacity is in good agreement with the total lithium accumulated in the SEI.
The non-destructive nature of the NDP technique can be much more favorably exploited when performing operando experiments. In this case, however, the viewing depth into the sample is naturally diminished by the additional energy loss of the charged particles as they travel through the current collector, the cell containment, and the electrolyte in the electrode pores. The so-called stopping power, which determines the accessible depth into the sample, depends on the thickness, the density, and the chemical composition of all the materials through which the charged particles travel before reaching the detector. Therefore, in order to maximize the viewing depth into the electrode under study, the cell window and the current collector must be as thin as possible. The usual approach found in the literature is the use of either a thin plastic foil (e.g., a 7.5 μm Kapton® film6) or the current collector itself (e.g., a 10–16 μm aluminum (Al)7–9 or 10 μm copper (Cu) foil10) as cell window; in one case, where the lithiation of tin was studied,11 a tin foil served at the same time as active material and as cell window. However, we found that the poor mechanical rigidity of these very thin windows generally results in an inhomogeneity or lack of mechanical compression of the cell stack underneath the window. This problem is even more pronounced when studies are performed in NDP sample chambers held under reduced pressure (typically in the sub-mbar range) in order to minimize the energy loss of the charged particles in the atmosphere as they travel between the sample window and the detector. Unfortunately, inhomogeneous compression can lead to differences in local overpotentials and even to local lithium plating during the charging of a graphite anode.12 Besides this, the use of thin and non-rigid windows can also result in an incomplete capacity utilization of the part of the electrode located directly underneath the window, limiting the charge/discharge rate capability to very low rates and/or requiring very long constant voltage phases at the end of charge/discharge in order to achieve a homogeneous state-of-charge (SOC) across the entire electrode area. This must be considered when analyzing operando NDP cell data (i.e., data taken under potentially inhomogeneous compression), as these artefacts caused by inhomogeneous cell compression may not at all relate to the processes occurring in commercial cells (i.e., taken under comparably homogeneous compression). Therefore, it is to show that the specific capacity obtained from the active materials under study (in terms of mAh/gactive material), and thus the electrochemical processes probed are indeed representative of the entire cell, i.e., whether the electrochemical processes of the electrode segment underneath the window probed by NDP occur homogeneously over the entire window and/or cell area, as would be required for a rigorous comparison with conventional cells.
In order to attain a sufficiently homogeneous cell compression, so as to avoid the above described artefacts, we developed a coin cell based operando NDP cell, where the coin cell cap was perforated with a pattern of closely spaced 500 μm diameter holes (prepared via laser cutting) onto which a 7.5 μm Kapton® foil was placed as a window for the emitting triton particles. On one hand, the overall ca. 2.2% perforation of the cell cap allowed for a substantial emission of triton particles from inside the cell; on the other hand, the diameter of the holes is small enough to still provide a homogeneous compression of the electrodes within the cell for the given bending stiffness of the 7.5 μm Kapton® foil window. Nevertheless, the liquid electrolyte in the cell was found to cause problems (e.g., bulging of the window caused by gas formation) whenever the vacuum level in the NDP chamber was substantially below the vapor pressure of the electrolyte. Therefore, we used a helium gas atmosphere at a pressure of about 400 mbar in the NDP sample chamber, which was high enough to circumvent this problem and still low enough to sufficiently reduce the interaction of the triton particles with the helium atoms within the NDP sample chamber.
Previous studies focused on a variety of different electrode materials, like observing the lithium (de-)intercalation in a lithium titanate (LTO) anode with a very low areal capacity and loading (≈0.15 mAh/gLTO and ≈0.9 mgLTO/cm2), presumably to limit the electrode thickness.9 Here, we focus on graphite-based anodes, which are nowadays the most frequently used anode materials in industry because of their high energy density and good cycling stability; to allow for complete penetration of the NDP signal, the areal capacity also had to be restricted to ≈0.6 mAh/ggraphite, which is ≈4-fold lower than in industrial applications. Due to their low density, anode active materials such as graphite or silicon allow for a higher accessible NDP viewing depth compared to, e.g., cathode active materials. In order to compromise the viewing depth in an operando NDP cell as little as possible, the mass density of the metal current collector has to be minimized. While low-density aluminum can be used as current collector for LIB cathodes, a copper current collector with an unfortunately ≈3-fold higher density must be used for graphite and silicon anodes, since lithium alloys with Al at potentials below ≈0.3 V vs. Li+/Li.13 Therefore, in order to maximize the viewing depth, we use a very thin copper layer (100 nm-thick) as anode current collector, which was deposited on a 7.5 μm-thick Kapton® foil acting as cell window. While the latter is permeable for triton particles, the Kapton® foil of this thickness is impermeable to alpha particles,14 which therefore could not be detected and not used for a higher depth resolution analysis of the lithium profile near the interface between the electrode and the current collector. Taking into account the triton stopping power of the helium atmosphere in the NDP chamber (at ≈400 mbar), of the Cu/Kapton® foil assembly, and of the electrolyte-filled graphite electrode (assuming an electrolyte-filled pore volume fraction of ≈47%, which then equates to an effective density of ≈1.7 g/cm3electrode), the NDP viewing depth into the graphite anode mounted in the operando coin cell in the presented NDP setup can be estimated to be ≈26 μm.15 Even though this physical limitation confines the general application of in situ/operando NDP to graphite anodes with a ≈3–4 times lower thickness and areal capacity compared to commercially used graphite anodes, it still allows to study fundamental electrochemical processes. This restriction, however, does not apply in the case of silicon-based anodes, since their thickness is much lower at industrially relevant areal capacities due to the high specific capacity of silicon. E.g., Jantke et al. used anodes based on a composite of micrometer-sized silicon and conductive carbon, which had an areal capacity of ≈2.5 mAh/cm2 at an anode thickness of only ≈25 μm16; similarly, Wetjen et al. investigated nanosilicon/graphite composite-based electrodes, which had an areal capacity of ≈2 mAh/cm2 at an anode thickness of only ≈20 μm.5 In both cases, the complete electrode depth could be probed by in situ/operando NDP.
In the here presented study, we aimed for a pristine graphite anode thickness of only ≈(17 ± 2) μm in order to: (1) assure a still precise quantification of triton particles emitted near the anode/separator interface (i.e., farthest away from the NDP cell window); (2) avoid a superposition of low energy triton particles (i.e., those emitting near the anode/separator interface) with the strong NDP background signal at low energies; and, (3) allow for a possible swelling of the graphite anode during operation. With the optimized operando NDP cell design presented in this study, we could demonstrate that the compression of the graphite anode is sufficiently homogenous to attain a homogeneous lithiation across the entire graphite anode and to extract its full capacity at a rate of ≈C/16. For the here examined graphite electrodes, the evolution of the lithium profile across the entire thickness of the anode could be quantitatively followed over the course of charge/discharge, further proving the utility of our cell design for operando NDP studies. The NDP data corroborate well with the lithium concentration derived from the electrochemically observed reversible capacity based on one lithium per electron of charge (1 Li/e−). However, a significantly lower ratio of (0.61 ± 0.08) was observed when comparing the lithium amount in the graphite electrode SEI to the electrochemically measured irreversible capacity. A possible explanation could be either electrolyte decomposition mechanisms with an average Li/e− ratio of <1 or a subsequent dissolution of lithium-containing SEI compounds during/after formation, which is currently subject of further investigation. Moreover, consistent with previous operando NDP studies, our operando NDP and ex situ XPS (X-ray photoelectron spectroscopy) data also show that during the slow lithiation of a graphite electrode small amounts of lithium can diffuse into the copper current collector, forming a Li-Cu alloy.
Experimental
Electrode preparation
Due to the short range of the triton particles in NDP and to assure that the lithium profile can be obtained across the entire electrode thickness, a graphite anode electrode with a thickness of only ≈(17 ± 2) μm was prepared, which is less than the typical size of commercial graphite particles with a d50 value of ≈20 μm. Therefore, in order to obtain a homogeneously thin graphite electrode, commercially available artificial graphite particles (Sigracell SG3, SGL Carbon, Germany) with a BET area of 4 m2 g−1 (d50 = 19 μm, d90 = 37 μm) were sieved to obtain graphite particles with a small and narrow particle size distribution around 6 μm (d50 = 5.8 μm, d90 = 8.5 μm) and a BET area of ≈15 m2 g−1. The resulting graphite particle size distribution is shown in Fig. 1 (red line) in comparison to the original graphite material (blue line).
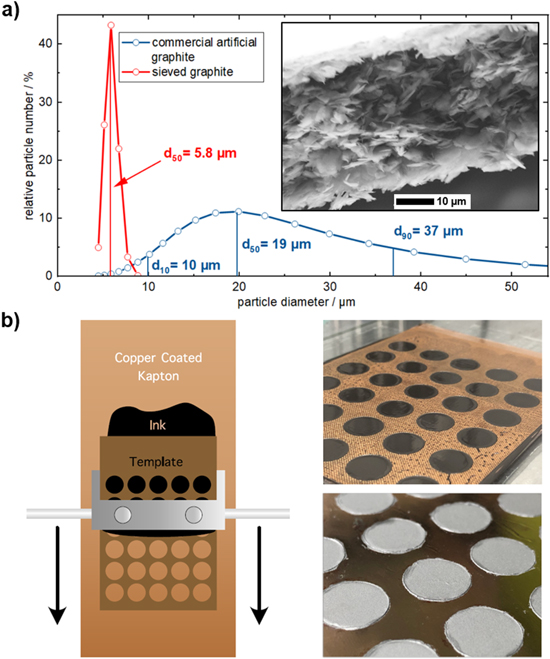
Figure 1. (a) Particle size distribution for a commercial artificial graphite (blue) and the same active material, which was sieved to remove particles larger than ≈10 μm (red); the inset shows an SEM cross-section of an NDP electrode before compression. (b) Illustration of the doctor blade mask-assisted coating procedure of the graphite electrode ink onto the copper coated Kapton® foil serving as window for the operando NDP coin cell (left), and photos of the coated electrodes (right top) and of the uncompressed electrodes after drying (right bottom).
Download figure:
Standard image High-resolution imageElectrode inks were prepared by mixing the sieved artificial graphite and polyvinylidene difluoride (PVDF, Kynar HSV 900, Arkema, France) at a mass ratio of 91:9 with N-methyl-pyrrolidone (NMP, anhydrous, 99.5%, Sigma-Aldrich, Germany) at a solid content of 28 wt% in a planetary mixer (Thinky, USA) for 15 min. The resulting ink was then doctor blade-coated onto a 100 nm-thick copper layer serving as current collector that had been sputter-coated (Movatec, Germany) onto a 7.5 μm Kapton® (DuPont, USA) foil, serving as anode current collector and window for the operando NDP cell. The 12 mm diameter graphite electrodes were obtained by coating through an 80 μm-thick mask made from a PTFE coated fiberglass film (Fiberflon, Fiberflon GmbH & Co. KG, Germany) that contained holes with 12 mm diameter (s. Fig. 1b). The coating including the mask was dried at 50 °C in a convection oven for 10 min. The mask was then removed and the coating dried for another 3 h at 50 °C. To allow electrical contacting of the current collector in the coin cell assembly (s. below), the electrodes were punched out with a larger diameter of 15 mm, so that an outer 1.5 mm wide rim of the non-coated copper current collector remained (s. Fig. 2a). Finally, the electrodes were compressed to a porosity of ≈(47 ± 6)% using a KBr press (PE-011, Mauthe, Germany), as determined by areal weight and thickness measurements, considering uncertainties of ±0.034 mg for the coating mass, and ±2 μm for the coating thickness, where the error in mass determination originates mainly from variations in the current collector weight (standard deviations of ten current collector samples). This procedure yielded an electrode loading of (1.99 ± 0.03) mggraphite (≡1.76 ± 0.03 mggraphite/cm2) with a nominal areal capacity of 0.62 mAh/cm2 (based on a reversible capacity of 350 mAh/ggraphite) and with an electrode thickness of ≈(17 ± 2) μm.

Figure 2. (a) Graphite electrode (12 mm diameter, uncompressed) mask-coated onto a 100 nm Cu film that was sputter-deposited onto a 7.5 μm-thick Kapton foil (the final assembly was punched out at 15 mm diameter, leaving a 1.5 mm wide Cu perimeter for electrical contacting); (b) graphite electrode glued into the inside of a CR2032 coin cell cap; (c) top-view of a CR2032 coin cell cap containing 57 laser-cut holes with a diameter of 500 μm; (d) cross-sectional schematic of the operando NDP cell setup; (e) operando NDP cell setup in exploded view.
Download figure:
Standard image High-resolution imageCell assembly and cell cycling
The electrodes were glued into a commercial CR2032 coin cell cap (Hohsen Corp., Japan) using epoxy resin (UHU Plus Endfest, Bolton Group S.r.l., Italy) applied onto the copper rim area (s. Fig. 2b). For this work, two different types of specially designed coin cell caps were used. For initial experiments, a hole with 4 mm diameter (0.13 cm2 open window area) was laser-cut into the cap. As this design resulted in a poor compression of the electrode and a very inhomogeneous current distribution (s. below discussion), an improved cap design was devised, containing a grid of 57 laser-cut holes with individual diameters of 500 μm arranged in a quadratic pattern and with a center-to-center distance of 1 mm (extending over a roughly circular area with a diameter of ≈10 mm), amounting to a similar total open window area of 0.11 cm2 (s. Fig. 2c). The electrode glued into the coin cell cap was dried overnight at 80 °C under dynamic vacuum in a glass oven (drying oven 585, Büchi, Switzerland) and then transferred into an argon-filled glovebox without exposure to ambient atmosphere.
To assure electrical contact between the copper current collector and the stainless steel coin cell cap, a 10 μm thick copper foil ring with an inner diameter of 13 mm and an outer diameter of 19 mm was positioned around the graphite working electrode (WE), as shown by the thick orange marked element in the cell cross sectional sketch in Fig. 2d and the orange marked ring in the exploded view shown in Fig. 2e. The coin cell was assembled using six glass fiber separators with a diameter of 17 mm (VWR, Germany), each with an uncompressed thickness of 250 μm (s. Figs. 2d and 2e; the compressed thickness is ≈200 μm each), which were soaked with 270 μl of 1 M LiPF6 in a mixture of ethylene carbonate and ethyl methyl carbonate (EC:EMC = 30:70 wt%; LP57, BASF, Germany). The use of multiple thick glass fiber separators was chosen in order to improve the homogeneity of the pressure distribution as well as to facilitate gas diffusion away from the graphite electrode surface. As counter electrode (CE), a capacitively oversized LiFePO4 (LFP) (LFP High Energy, Custom Cells Itzehoe GmbH, Germany) electrode with a diameter of 10 mm and an areal capacity of ≈3.5 mAh/cm2 was used. A 0.5 mm-thick aluminum spacer containing a 100 μm × 10.1 mm circular milled slot was used to precisely center the LFP CE during cell assembly and to adjust the height of the electrode stack to yield a calculated cell pressure of ≈3 bar.
The operando NDP cell with the optimized cap design containing the 500 μm holes used during beamtime was cycled between 3.43 and 1.93 Vcell at a C-rate of ≈C/16 (≡39 μA/cm2) using an SP300 potentiostat (Biologic, France). The cell was first charged to 3.43 Vcell (CCCV charge with a C/32 current cutoff to end the CV phase) and then discharged to 1.93 Vcell (CCCV charge with a C/80 current cutoff to end the CV phase), followed by a 2 h rest phase at open circuit voltage (OCV). Afterwards, the cell was again charged to 3.43 Vcell (CCCV charge with a C/32 current cutoff to end the CV phase). The cell with one large 4 mm hole and the operando cell with 500 μm holes for the visual lithiation determination during cell development were cycled accordingly, but at a C-rate of C/15 (CCCV charge with a C/30 current cutoff to end the CV phase, CC discharge
For the later described in situ experiment to study the lithium intercalation into the Cu current collector, an uncoated anode current collector (i.e., a 100 nm Cu on 7.5 μm Kapton® foil without the graphite electrode) was used as WE and a 16 mm diameter and 450 μm-thick lithium disk was used as CE. One set of these coin cells was not charged, but simply stored at 25 °C and OCV for 16 h. The other set of cells were cycled such that the WE potential was first scanned from OCV (≈3 V vs. Li+/Li) to 250 mV vs. Li+/Li within 2 h (corresponding to a scan rate of ≈0.38 mV/s ), and then further reduced to 20 mV vs. Li+/Li within 14 h at ≈0.0045 mV s−1. For the ex situ XPS measurements, coin cells with a standard cell cap were assembled, also with a Cu-coated Kapton® foil as WE, a 2500 Celgard® polyolefin separator (Celgard, USA) with 50 μl of LP57 electrolyte, and a Li disk CE. The same cycling procedure was used for the ex situ NDP cells.
Neutron depth profiling (NDP) and quantification of the NDP signal
NDP measurements were conducted using the N4DP setup at the PGAA instrument of the Heinz Maier-Leibnitz Zentrum (MLZ) in Garching, Germany.17,18 The cold neutron beam exhibits a flux of 1.35 × 109 cm−2 s−1 and is collimated to a circular-shaped beam profile with a diameter of 4 mm using boron-containing plastic plates.14 The NDP chamber was filled with helium gas at a pressure of about 400 mbar, well above the vapor pressure of the liquid electrolyte in the cell while keeping the additional energy loss of the charged particles by interaction with the helium on their way from the cell window to the detector (placed at a distance of 9.6 cm) low. The coin cell was mounted on a specially designed operando sample holder, shown in Fig. 3. Here, four different operando cells can be mounted together with several ex situ reference samples. The sample holder is mounted at an angle of 45° with respect to the incoming neutron beam, with the cap of the coin cell containing the window holes facing and aligned in a normal direction to the charged particle detector (ORTEC).
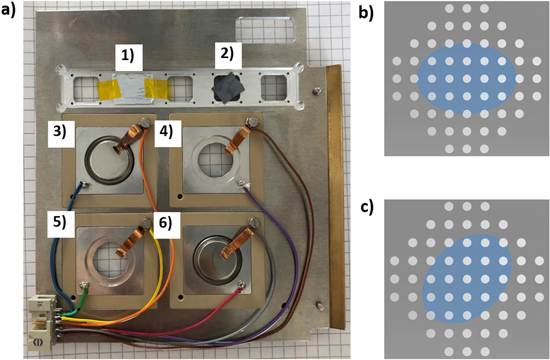
Figure 3. (a) NDP cell holder with five reference sample slots, used for elemental quantity and energy calibration, of which two are mounted: (1) LiF-coated Mylar® foil, and (2) 10B-doped silicon wafer (SRM2137). (3)–(6) show four mounting slots for operando NDP coin cells (in this picture, (3) and (6) are mounted). (b) + (c) Drawings of the 500 μm diameter hole grid on the front-side of the coin cells, superimposed with the area illuminated by the neutron beam (blue area, ≈17.77 mm2 ellipse), shown for either a perfect alignment of the center and the central axes of the incident neutron beam with the center and the central axes of the hole grid (b) or for the case where the neutron beam area is rotated by an angle of 45° (c). From these kind of drawings, the maximum and minimum hole area/beam area ratio were calculated by considering rotation angles of 0°, 22.5°, and 45° as well as in-plane offsets of the neutron beam area from the hole grid center by distances between 0 mm and 1 mm in 100 μm steps.
Download figure:
Standard image High-resolution imageThe measured signal intensities were converted to absolute quantities by comparing them to the signal obtained from the boron-containing reference sample SRM2137.19 It consists of a well-defined 10B concentration profile implanted into a silicon wafer and the boron content within the total implantation is known with a precision of ±3.4%.19 Within a calibration measurement, the integrated signal intensity, representing the total 10B amount within the SRM2137 reference, was determined with a systematic uncertainty of ±0.9%. In order to relate the measured signals to lithium, the ratio of the thermal neutron capture cross sections of 10B (≈3840 b) and 6Li (≈940 b) was taken into account together with the natural abundance of 6Li (≈7.6%).
While these aspects must be considered for the quantification of ex situ NDP data from harvested electrodes, operando NDP measurements with the here presented operando coin cell must also take into account the reduced area from where the emanating charged particles can reach the detector. Since the SRM2137 reference sample is larger than the neutron beam area hitting the sample, charged particles from the whole illuminated area can reach the detector. On the other hand, this is not true for the operando coin cell, because the 0.25 mm-thick stainless-steel cap is impermeable for the charged particles and so they can only emanate from the area defined by the processed grid of holes with individual diameters of 500 μm, as discussed in the following. The circularly collimated, ≈4 mm diameter neutron beam hits the sample at an angle of 45°, resulting in an illuminated area in form of an ellipse (≈17.77 mm2) on the window area with the hole pattern. As shown in Figs. 3b and 3c, the fraction of illuminated holes depends on the positioning of the coin cell within the elliptic beam area, which was considered by calculating the variation of the fraction of illuminated hole areas when moving the beam center in multiple directions away from the grid pattern center between 0 mm and 1 mm in 100 μm steps and a rotation of the coin cell by 0°, 22.5°, and 45° (s. Figs. 3b and 3c) was taken into account. Based on the maximum displacement error of the illuminated neutron beam area with respect to the grid pattern of the holes of 1 mm in all directions on the window plane, the maximum and minimum fractional hole area of the illuminated window area is 20.2% and 17.8%, respectively. In addition, further uncertainties might arise from a slight angular misalignment of the coin cell out of the ideal plane-parallel alignment with the detector, which would reduce the hole area fraction that is in line-of-sight with the detector. Based on our experimental setup, we estimate a maximum angular displacement of 3° between the coin cell window and the detector plane, caused by a maximum of 1 mm misalignment over the 20 mm coin cell diameter. This would lead to a further reduction of the hole area fraction by a maximum of 5.2% of the above stated value due to in-plane alignment of beam and grid pattern. Therefore, the maximum accessible hole area fraction of the illuminated window area would remain at 20.2% (perfect angular alignment) and the minimum would become 16.9% (3° angular displacement). Thus, the reduced NDP sampling area due to the given hole pattern and the above geometrical considerations can be estimated to be (18.6 ± 1.7)% of the original beam area. This uncertainty of the reduced beam area based on the here discussed min/max considerations therefore induces a systematic uncertainty of ±9.1%.
In summary, it is important to state that the systematic uncertainty originating from the geometrical setup of the operando coin cell is larger (±9.1%) than the errors of the calibration that are the ±3.4% of the SRM2137 standard and the ±0.9% of the reference calibration measurement. Therefore, while NDP is a rather precise quantitative technique for samples larger than the incident neutron beam, its precision is somewhat compromised for the here presented cell design due to the 500 μm diameter hole pattern. However, as will be shown, this processed grid is critical for assuring a homogenous compression of the cell stack and good electrical contact. Considering all three uncertainties, given by the error in the SRM2137 standard (±3.4%), an uncertainty of ±0.9% arising from the reference sample calibration procedure, and the relative geometrical min/max error (±9.1%), the total systematic uncertainty of the lithium concentration measurement was determined to be ±9.8% assuming Gaussian error propagation for errors with independent origins. It is to note that this systematic uncertainty scales all operando NDP spectra in the same manner, i.e., it is independent of the SOC.
NDP was recorded continuously (event-based) during cycling (operando) and the data were later averaged over 1 h to achieve sufficient statistics. Thus, the NDP spectra represent the lithium concentrations averaged over ΔSOC = ≈6−8%, except for spectrum 5 in Figs. 6 and 7 which was recorded during a 2 h OCV phase. The additional energy losses caused by the fact that the triton particles pass through different materials before hitting the detector, i.e., the 100 nm-thick Cu current collector, the 7.5 μm-thick Kapton® foil, and the helium atmosphere were taken into account when translating the energy spectra to depth profiles. For the conversion of the energy spectra to depth profiles, the stopping power of the triton particles provided by the SRIM software was used.15,20 Since the elemental anode composition influences the material stopping power for the triton particles, the change of the composition was also taken into account.9,14 Here, the anode composition was estimated using the pristine anode composition and the fully electrolyte-filled pores of the anode. During cell operation, lithium-ions are accumulated in the anode, leading to a change of the anode composition. Here, the lithium accumulated in the anode at the different SOCs was determined by integration of the NDP energy spectra and the composition was corrected for it. Upon operation, also SEI formation will occur by reduction of the electrolyte. Hereby, only electrolyte, which was previously present within the anode pores, is transformed into an SEI layer, and thus the change of the elemental composition due to SEI formation was assumed to be negligible. An overview of the anode compositions modeled for the different SOC states is shown in Table I.
Table I. Elemental composition of the graphite anode estimated for different SOCs. For the pristine graphite anode, the composition of the graphite anode layer (graphite + PVDF) is well known and it can be assumed that the pores in the anode layer (47% porosity) are completely filled with the LP57 electrolyte. Upon operation, the composition change induced by the (de−)intercalated of lithium-ions in the graphite active material was considered. The lithium additionally accumulated in the anodes was determined via integration of the NDP energy spectra and is taken into account to model the anode composition as a function of SOC.
| Anode SOC (spectrum #) | H (mol%) | Li (mol%) | C (mol%) | O (mol%) | F (mol%) | P (mol%) |
|---|---|---|---|---|---|---|
| Pristine (1) | 22.0 | 0.3 | 64.8 | 9.1 | 3.6 | 0.3 |
| 50% (2) | 21.3 | 3.5 | 62.7 | 8.8 | 3.5 | 0.3 |
| 100% (3) | 20.5 | 6.9 | 60.5 | 8.5 | 3.3 | 0.3 |
| 50% (4) | 21.1 | 4.3 | 62.2 | 8.7 | 3.4 | 0.3 |
| 0% (5) | 21.8 | 1.4 | 64.1 | 9.0 | 3.5 | 0.3 |
| 50% (6) | 21.0 | 4.6 | 62.0 | 8.7 | 3.4 | 0.3 |
| 100% (7) | 20.5 | 6.9 | 60.5 | 8.4 | 3.3 | 0.3 |
X-ray photoelectron spectroscopy (XPS)
For the ex situ XPS measurements, the coin cells were decrimped inside an argon-filled glovebox. Small pieces (3 × 3 mm) were cut-out from the WE with a scalpel and mounted on a stainless steel stub (Ø = 15 mm), which was then transferred from the glovebox into the load-lock of the XPS system without air exposure using a transfer vessel (Kratos, UK). With an Axis Supra system (Kratos, UK), XPS spectra were recorded using monochromatic Al-Kα radiation (hυ = 1487 eV) at a base pressure of <3 × 10⁻⁸ torr, a pass energy of 20 eV, a step size of 0.1 eV, a dwell time of 300 ms, and a measured spot size of 800 × 300 μm. The measurement was performed in hybrid lens mode with turned on charge neutralizer. Regional spectra were averaged from 4 scans (Cu 1s, Li 1s, Cu 3p, N 1s). The obtained spectra were processed and fitted using the Kratos ESCApe software (version 1.1). Binding energies (BE) were corrected based on the C–C/C–H peak of adventitious carbon at 284.8 eV in the C 1s spectrum. A mixture of 30% Laurentzian and 70% Gaussian functions was employed for the fitting procedure together with a Shirley background subtraction. The ratio between copper and lithium atoms was done based on the fitted spectra of Li 1 s and Cu 3p. Etching was performed using Ar+ ions with an energy of 5 keV. The etching time was 10 s in the first step and in the subsequent steps always 30 s. The raster size was 2 × 1 mm. The etching time was converted into a depth rate by completely etching through the 100 nm-thick Cu layer on top of the Kapton® foil. The N 1s signal from the Kapton® polyimide was used as indicator for a total penetration of the Cu layer. From that, an etching rate of ≈1.8 nm/30 s was calculated.
Results and Discussion
Cycling performance of a coin cell with a 4 mm window
First, the electrochemical performance of a coin cell with a single 4 mm diameter hole laser-cut into its cap is tested. Similar to previous works,11 this configuration would be favorable for NDP, since it maximizes the signal from the charged particles produced by the 6Li(n,3H)4He reaction inside the cell. Figure 4 displays the voltage profile of a graphite/LFP coin cell with a 4 mm hole that was cycled inside a glovebox at a rate of C/15. During the first cycle, a reversible capacity of 349 mAh/ggraphite and a coulombic efficiency of ≈73%, corresponding to a first-cycle irreversible capacity of ≈27% are obtained. These numbers are reasonably close to the reversible capacity of ≈355 mAh/ggraphite and the first-cycle irreversible capacity of ≈22% measured in a standard coin cell (without a window hole and using the same graphite electrode coated on a 10 μm-thick copper current collector foil). They indicate a good electrochemical performance of the cell and that this cell setup would be representative of a standard cell. However, upon opening the cell at 100% SOC after the second charging cycle revealed that even during charging at C/15, the central part of electrode in the middle of the 4 mm diameter window hole does not show the golden color expected from a pure LiC6 phase21 (s. inset in Fig. 4). This clearly indicates that even during relatively slow charging at C/15, full lithiation does not occur in the center of the window hole, so that a large fraction of the area probed by NDP would not at all be representative for the whole electrode. This inhomogeneous lithiation might be caused by increased intercalation overpotentials in the poorly compressed central region of the window hole.

Figure 4. Cell potential profiles for the 1st charge/discharge (blue/red lines) and for the second charge (yellow line) of a graphite electrode cycled vs. an LFP cathode in a coin cell with a 4 mm window hole that was sealed by the 7.5 μm Kapton® foil. The Kapton® foil was sputter-coated with a 100 nm-thick Cu layer onto which the graphite electrode was coated (s. Fig. 2a). The charge was conducted at C/15 with a CV hold at 3.43 Vcell (with a C/30 cutoff) and discharged to 1.93 Vcell at C/15. The inset shows a decrimped coin cell that was disassembled after the second complete charge to 100% SOC at C/15 and the CV hold at 3.43 Vcell. Here, it is clearly visible that the graphite active material within the window hole region was not completely lithiated across the entire window area due to the absence of the golden LiC6 phase.
Download figure:
Standard image High-resolution imageAs shown in the photograph in Fig. 4, the clearly under-lithiated central region extends only over a diameter of ≈3 mm (i.e., over an area of ≈0.071 cm2), which corresponds to only ≈6% of the entire graphite electrode (1.13 cm2), explaining why the overall capacity of the coin cell with the 4 mm window is very close to that of a standard coin cell (s. ≈355 mAh/ggraphite). Of concern, however, is the fact that this under-lithiated central region with an area of ≈0.071 cm2 constitutes ≈55% of the overall window area (4 mm diameter or 0.13 cm2) over which the NDP data are collected. Therefore, an NDP measurement obtained entirely from this region would not properly represent the undisturbed cell chemistry in the coin cell. The observation that the golden color of the LiC6 phase is only present in a region of ≈0.5 mm within the 4 mm diameter hole (s. inset of Fig. 4) suggests that this is the maximum distance over which the local cell compression remains in an acceptable range.
Optical appearance of a lithiated graphite anode cycled in a coin cell with 500 μm holes
These findings suggest that in a ≈0.5 mm-thick ring inside the perforated hole a LiC6 phase is still present and thus a hole with a ≈1 mm diameter might be sufficient to exclude inhomogeneous lithiation. However, in order to assure a sufficient cell compression, we decreased the hole diameter itself to ≈0.5 mm. At the same time, the overall sampling area for the triton particles should be maintained in order to maximize the NDP signal. These two requirements resulted in our improved operando NDP cell design shown in Fig. 2c in which the single 4 mm window hole (≈0.13 cm2) was replaced by a pattern of 57 holes with individual diameters of 500 μm, while the total hole area could almost be maintained (≈0.11 cm2). The validity of this improved design was demonstrated by an analogous experiment as that discussed in the previous section, whereby a coin cell with 500 μm holes (s. Fig. 2c) was cycled accordingly (CCCV charge to a cutoff voltage of 3.43 Vcell at a rate of C/15 with a CV hold until C/30), so that the graphite anode is expected to be at its fully lithiated state. Figure 5a shows a photograph of a graphite electrode extracted from this fully lithiated decrimped coin cell with an array of 500 μm holes, which are visible by little indentations in the graphite electrode coating where the electrode was slightly pressed into the window holes due to the compressive force on the cell stack. The golden color in the magnification in Fig. 5b is even present in the indentations of the electrode, and it clearly indicates that full lithiation occurred homogeneously over the entire surface of the electrode. These findings indicate that the region of interest (i.e., within the holes) is representative of the entire graphite electrode, contrary to what we had concluded for the cell design with the single 4 mm window hole (s. inset of Fig. 4). The array of 500 μm window holes in the coin cell cap thus maximizes the net area accessible for the NDP signal (i.e., for triton particle emission) while assuring a homogeneous electrochemical behavior across the entire electrode area. This improved setup was used for the further discussed operando NDP measurements.

Figure 5. (a) Post mortem photograph of a graphite electrode that was lithiated in the improved operando NDP coin cell design with an array of 500 μm holes in the coin cell cap (s. Fig. 2d). The graphite in this graphite/LFP cell was charged at C/15 with a CV hold at 3.43 Vcell (with a C/30 cutoff). Subsequently, the cell was decrimped in a fully charged state. The golden color indicates a complete LiC6 formation over the complete electrode area. (b) Magnification of the center part of the electrode. The slight imprints of the 500 μm diameter holes in the coin cell cap are visible in the graphite electrode. This magnified image clearly shows that the lithiation of the graphite electrode occurred completely also in the regions which are located within the center of the window holes.
Download figure:
Standard image High-resolution imageCycling performance and NDP energy spectra of a graphite electrode obtained in an operando NDP cell with 500 μm holes
Figure 6a shows the voltage profiles of the graphite/LFP operando NDP cell mounted within the NDP chamber under reduced helium pressure (≈400 mbar). Displayed are the first charging (blue) and discharging (red) half-cycles as well as the second charging half-cycle (yellow), conducted at a rate of C/16 with a CCCV charge to 3.43 Vcell (until C/32) and a CC discharge. The obtained reversible capacity of the capacity-limiting graphite electrode is ≈348 mAh/ggraphite, which agrees well with the ≈355 mAh/ggraphite obtained in a conventional coin cell, as does the first-cycle irreversible capacity of ≈22% (this high value can be explained by the very high BET surface area of the here used graphite active material).

Figure 6. (a) Cell potential profiles of the operando NDP graphite/LFP cell with the 500 μm diameter hole array design (s. Fig. 2c) for the first charging (blue), the first discharging (red), and the second charging (yellow) half-cycles. The cell was charged at a rate of C/16 (≡39 μA/cm2) followed by a CV hold at 3.43 Vcell (until C/32) and discharged to 1.93 Vcell at C/16. The colored dots indicate SOC regions where an NDP spectrum was recorded over the course of 1 h, corresponding to a Δcap = ≈30 mAh/ggraphite. (b) Measured NDP signal intensity as a function of the triton particle energy, plotted for various SOC regions (always averaged over 1 h). The differently colored backgrounds indicate the approximate energy ranges for NDP signals stemming from the graphite electrode (gray), from a part of the separator region (blue), and from a part of the Cu current collector/Kapton® foil assembly (orange); as described in the text, these were obtained from the inflection points of the NDP profiles.
Download figure:
Standard image High-resolution imageFigure 6b shows the acquired NDP energy spectra during the three half-cycles. The points labelled with numbers 1–7 in Fig. 6a indicate the SOC regions during which the NDP spectra shown in Fig. 6b were recorded operando (the spectra were averaged over 2 h for point 1 and over 1 h for all other points). Thereby, the NDP spectra were averaged over an SOC range of Δcap ≈30 mAh/ggraphite. The spectrum labelled with 1 was measured on the pristine cell, i.e., during an OCV rest phase before starting cell cycling. The spectra consist of signals from the triton particles of the 6Li(n,3H)4He reaction and are dominated below ≈600 keV by an exponentially-shaped background signal stemming from beta- and gamma-radiation.10,17 The alpha particles, which are also produced during neutron capture of 6Li, are not observed here, as they do not penetrate through the Kapton® foil window.5 The triton particles, however, also lose part of their initial energy of 2727 keV during their passage through the measurement setup before hitting the detector, and thus the signals at (2163 ± 10) keV (s. Fig. 6b) correspond to triton particles emitted from inside the coin cell at the interface between the graphite anode and the Cu current collector. The energy loss in the 100 nm-thick copper current collector was roughly estimated to ≈11 keV.15 Using reference measurements, the energy loss caused by the Kapton® foil could be determined to be (301 ± 0.6) keV. The remaining energy loss before hitting the detector was assigned to the helium atmosphere and it can be used as a precise measure for the gas pressure within the NDP chamber. The energy loss of (248 ± 10) keV correlates to a helium mass loading of (0.72 ± 0.03) mg/cm2.15 It can be translated to a helium gas pressure of (420 ± 18) mbar, when taking into account the sample-detector distance of 9.6 cm, consistent with the nominal helium pressure of ≈400 mbar. At energies higher than ≈2163 keV, i.e., the material before the current collector, the signal intensity rapidly drops to zero at all SOCs, which indicates that no lithium diffuses into the Kapton® window during the experiment showing the stability of the foil. Signals from lower energies correspond to lithium present at greater depth inside the anode electrode, i.e., towards the interface between the graphite electrode and the separator interface (s. Fig. 2d). An intensity decrease towards lower energies (i.e., towards a greater depth into the electrode) is typical for NDP spectra and mainly originates from the curvature of the energy-to-depth relation.14
The NDP signal of the pristine graphite anode prior to the first charging (spectrum number 1 in Fig. 6b) solely originates from the lithium-ions in the 1 M LiPF6 based electrolyte that is filling the pores of the graphite electrode; however, the NDP signal is superimposed by the signal from background radiation which steeply increases below ≈600 keV. Around a depth corresponding to ≈1200 keV, a small kink in the intensity is observed, which we believe corresponds to the transition region between the graphite electrode and the separator (blue/gray interface), i.e., to the anode/separator interface; the NDP signal is higher in the glass fiber separator, as its pore volume fraction that is filled with the LiPF6 electrolyte is ≈90% compared to a pore volume fraction of only ≈47% in the graphite electrode. This shows that the lithium distribution within the complete anode can be probed via NDP. During cell charging (blue spectra in Fig. 6b), the NDP signal intensity increases, which indicates a lithium enrichment across the whole graphite anode. Since NDP detects lithium regardless of its chemical state, three at first indistinguishable contributions to the lithium NDP signal are now present: (1) lithium from the LiPF6 salt present in the liquid electrolyte located only in the pores of the anode and it is assumed to be constant for all SOCs (at a signal level equal to spectrum 1 in Fig. 6b); (2) lithium reversibly intercalated into the graphite particles; and, (3) irreversibly lost active lithium, bound within the SEI formed on the surface of the graphite particles. The maximum NDP signal intensity is reached at the end of the first charge (i.e., at 100% SOC), where a complete anode lithiation to LiC6 is expected (spectrum number 3 in Fig. 6b). Upon the subsequent discharge (red voltage profile in Fig. 6a), the NDP signal intensity decreases, reaching its minimum at the end of the first discharge (spectrum number 5). At this point, the graphite anode is completely delithiated and the NDP signal can be assigned to the sum of lithium in the electrolyte pores and the lithium stored irreversibly in the SEI that was formed during the first cycle. The SEI, according to a study by Schwenke et al., that was based on graphite electrodes harvested after formation and subjected to a washing with DMC (dimethyl carbonate), mainly consists of LiF, lithium ethylene dicarbonate (LEDC), lithium methyl carbonate (LMC), and lithium ethyl carbonate (LEC).22 At the transition between the different phases, namely between the separator and the graphite electrode as well as between the graphite electrode and the Cu-coated Kapton® window, different distinct lithium concentration levels are expected. Therefore, these transitions can be obtained from the inflection points of the NDP spectra,10 which are traced in Fig. 6b by the differently colored segments with blue representing a part of the separator region, gray representing the graphite anode, and orange representing the Cu-coated Kapton® window. During lithium intercalation, the boundary of the graphite electrode towards the separator (blue/gray interface) is shifted towards lower energies, which implies that the electrode mass and therefore also the thickness of the electrode is increasing. This is consistent with the literature, which shows a volume expansion of ≈10% during lithium intercalation.23
Quantification of the lithium concentration across the graphite electrode measured via NDP
To quantify the lithium concentration in the SEI and the intercalated graphite, we first subtract from the NDP signals taken at different SOCs (shown in Fig. 6b) the signal contributions from the electrolyte contained within the pores of the separator and the graphite anode. This corresponds to the NDP signal from the pristine electrode (s. spectrum 1 in Fig. 6b), where lithium is only present in the electrolyte phase, based on the reasonable assumptions that (i) the void volume fraction is independent of the SOC at the applied slow cycling rate of C/16, and that (ii) the amount of formed SEI does not significantly alter the electrode void volume fraction over the only two charge/discharge cycles. In this way, NDP signals stemming from the lithium salt containing electrolyte within the electrode pores as well as undesired signals from beta- and gamma-induced background radiation are removed, so that the remaining NDP signals now only reflect the change of the lithium concentration (ΔcLi) that is due to the reversible intercalation in the graphite active material and due to the lithium-containing SEI. These NDP spectra corrected for the electrolyte contribution are shown in Fig. 7a.

Figure 7. (a) Change of the NDP spectra with respect to the pristine state of the cell. Here, the spectra from Fig. 6b are shown after subtraction of the NDP spectrum of the pristine cell (i.e., before cycling, corresponding to spectrum 1 in Fig. 6b). (b) Transformation of the NDP signal count rate into Li concentration in terms of amount of Li atoms per gelectrode as well as transformation of the triton energy into either depth into the electrode (upper x-axis) or electrode mass loading (lower x-axis). The differently numbered spectra were collected at the points marked in the charge/discharge profiles shown in Fig. 6a. Here, ΔcLi consists of the Li concentration levels in the electrode other than from the liquid electrolyte, which was subtracted beforehand. The ΔcLi concentration level at 100% SOC (spectra 3 and 7), which consists of lithium in the SEI and lithium intercalated in the graphite active material, is indicated by the upper dashed bold purple line. The concentration level measured for the fully discharged electrode (spectrum 5) after the first completed charge/discharge cycle consists only of lithium in the SEI and is marked by the lower dashed bold purple line. The concentration difference between these spectra (0% and 100% SOC) can be assigned to reversibly intercalated lithium and refers to LiC6 formation. Systematic uncertainties of the NDP measurements are indicated as discussed in the Experimental section.
Download figure:
Standard image High-resolution imageFigure 7b shows the NDP spectra from Fig. 7a after transformation of the NDP count rate into lithium concentration in terms of Li atoms per gelectrode, plotted vs. the depth into the electrode (upper x-axis) or electrode mass loading in mgelectrode per cm2 (lower x-axis). The conversion of NDP signals to an absolute quantity was achieved via measuring a reference sample and by considering the fraction of the beam area that is occupied by the holes in the coin cell cap (s. Fig. 2c), as explained in detail in the Experimental section. Here, the systematic uncertainty bands of ±9.8%, arising mainly from the geometrical alignment uncertainty of the NDP measurement are shown. To convert the energy axis in Fig. 7a to the electrode mass loading or depth axis in Fig. 7b, the SRIM software was used,15,20 considering the approximate composition of the graphite electrode vs. SOC, as outlined in the Experimental section. The energy resolutions near the electrode/current collector and near the anode/electrolyte interface are (24 ± 2) keV and (396 ± 15) keV, respectively (s. Fig. 7a). They correspond to mass loading resolutions of (0.09 ± 0.01) mg/cm2 near the electrode/current collector and a lower resolution of (0.52 ± 0.02) mg/cm2 at the electrode/separator interface, caused by the statistical nature of the charged-particle energy loss. Assuming a homogeneous material density of 1.7 g/cm3electrode, these limited mass loading resolutions translate to spatial resolutions of (0.53 ± 0.07) μm and (3.05 ± 0.12) μm, respectively (s. Fig. 7b).
As shown in Fig. 7b, rather constant lithium concentration profiles are observed for all SOCs, which indicates a homogeneous lithium accumulation across the electrode depth during battery operation. However, a small slope remains after translating the energy spectra to concentration profiles. It likely originates from the geometrical aspect ratio of the 500 μm holes in the 250 μm-thick coin cell cap, inducing an additional energy loss of the triton particles by scattering on the edges into the stainless-steel casing, which then could lead to a slight depletion of the triton signal near the graphite/current collector interface (i.e., in the region of ≈0–1.5 mgelectrode/cm2 in Fig. 7b) and is currently being investigated in more detail. While across the graphite anode a rather constant lithium accumulation is measured, a distinct lithium enrichment at the anode surface near the current collector/electrode interface is observed over the course of cycling (i.e., an NDP signal peak near this interface), which remains even in the fully discharged state (spectrum 5 in Fig. 7b).
In the following, first the lithium concentrations measured across the graphite anode are quantitatively compared to the expected lithium concentrations based on the electrochemical data. Subsequently, the peak at the current collector/electrode interface will be quantitatively studied and verified using ex situ XPS.
Comparison of lithium concentrations measured via NDP and estimated from the electrochemistry
The lithium concentrations measured at 100% SOC after the first charging (spectrum 3 in Fig. 7b) and the second charging half-cycle (spectrum 7 in Fig. 7b) are both only composed of reversibly intercalated and irreversible bound lithium in the SEI, since signal from lithium in the electrolyte was eliminated by subtracting the signal obtained from the pristine anode (s. Fig. 7a). Since both spectra 3 and 7 show an almost identical lithium concentration, it can be concluded that the major part of the SEI formation was completed during the first charging, i.e., the first half-cycle. This is consistent with on-line electrochemical mass spectrometry (OEMS) analysis that shows that the gas evolution known to accompany SEI formation essentially vanishes at the end of the first charge.24,25 Even though the exact composition of the SEI is still under debate in the literature, the major constituents and the underlying formation mechanisms have been intensively investigated.26–28 For example, it was found that a major pathway for reductive EC decomposition proceeds via formation of lithium ethylene dicarbonate (LEDC) and ethylene (C2H4),24,29,30 which would imply the consumption of one lithium atom (i.e., its incorporation into the SEI) per one electron of irreversible charge, corresponding to a ratio of 1 Li/e−.
Therefore, the major part of the SEI formation was assumed to take place during the first charging half-cycle, and thus the amount of lithium in the SEI is reflected by the lithium concentration of (0.69 ± 0.07) × 1021 Li atoms/gelectrode in the fully discharged state after the first cycle (0% SOC, spectrum 5 in Fig. 7b). Furthermore, taking into account the lithium concentration of (4.47 ± 0.44) × 1021 Li atoms/gelectrode obtained from the fully charged anode (spectra 3 and 7), the concentration of reversibly intercalated lithium was calculated to be (3.78 ± 0.37) × 1021 Li atoms/gelectrode from the difference of both concentration levels (0% SOC and 100% SOC). In this way, the reversibly intercalated lithium (≈LiC6, i.e., ≈350 mAh/ggraphite) and the irreversibly bound lithium in the SEI can be separated, as indicated by the arrows/labels at the right-hand-side of Fig. 7b.
In order to compare these values to the estimated lithium concentrations derived from the electrochemical measurements, the total mass of the graphite electrode, including PVDF binder, electrolyte, SEI, and intercalated lithium need to be considered, since NDP is sensitive to the lithium quantities per mass of matrix (i.e., per mass of the electrolyte-filled anode in this case). The mass of the electrode coating (graphite + PVDF binder) is well-known from weighing the electrode and the current collector and is (2.19 ± 0.03) mg (s. Table II). The mass of intercalated lithium can be calculated from the moles of lithium determined by the reversible capacity (25.84 μmol = 0.18 mg; s. second column of Table II). The mass of the electrolyte in the electrode pores of 1.08 mg (s. second column of Table II) was calculated from the electrode thickness of 17 μm (measured before cell assembly), the electrode porosity of 47% (calculated from electrode thickness and mass), and the electrolyte density of 1.19 g/cm3. Finally, the mass of the SEI can be approximated from the moles of lithium that were deduced from the irreversible capacity (viz., 7.28 μmol), under the assumption that the total charge goes into the formation of LEDC with a molecular mass per lithium of 81 gLEDC/molLi, resulting in 0.59 mg LEDC (from: 7.28 μmol × 81 gLEDC/molLi = 0.59 mg of LEDC); note that this implicitly assumes a ratio of one lithium atom per electron irreversible charge (i.e., 1 Li/e−) for SEI formation. Since other minor SEI components are formed, this somewhat overestimates the mass of the SEI (due to the lower mass of LiF and Li2CO3 per Li atom), but as the thus calculated SEI mass only constitutes ≈15% of the mass of the electrode (s. second column of Table II), this error is minor. Note that for the electrochemical calculation of the lithium concentrations, the following uncertainties based on the graphite electrode preparations were taken into account: a coating mass uncertainty of ± 0.034 mg was obtained from the standard deviation of 10 individual weight measurements. Furthermore, a thickness uncertainty of ±2 μm and an electrolyte concentration error of ±0.01 mol/L was assumed. The overall mass of the electrode would thus be estimated to be (4.04 ± 0.23) mg at the end of the first charge (≡melectrolyte + mgraphite+PVDF + mLi-int. + mLi-SEI, s. Table II) and (3.86 ± 0.23) mg at the end of the first discharge (≡melectrolyte + mgraphite+PVDF + mLi-SEI, s. Table II).
Table II. Calculations of the expected lithium concentrations within the operando cell, originating from lithium concentrations in the electrolyte, from reversibly intercalated lithium in the graphite active material, and from lithium bound irreversibly in the SEI. The mass contributions to the electrode (second column) and the lithium amount in the electrode (third column) were determined as follows: (i) electrolyte mass and lithium amount from the 17 μm thickness, the 47% porosity of the electrode, and the LP57 electrolyte density of 1.19 g/cm3 ; (ii) graphite + PVDF from weight measurements; (iii) the intercalated lithium mass was calculated from the reversible capacity of the first cycle; (iv) the SEI mass and lithium amount were estimated assuming a ratio of 1 Li/e− and pure LEDC (81 gLEDC/molLi). Based on these values, the expected NDP signals from the lithium in the electrolyte, intercalated in the graphite (NDPLi-int.), and bound in the SEI (NDPLi-SEI) are shown in the fourth column. Uncertainties are based on a coating mass error of ±0.034 mg, a thickness error of ±2 μm, and an assumed electrolyte concentration error of ±0.01 mol/L.
| mass contribution [mg] | Li amount [μmol] | expected lithium concentration [Li atoms/gelectrode × 1021] | |
|---|---|---|---|
| 1 M LiPF6 electrolyte | 1.08 ± 0.19 | 0.90 ± 0.16 | 0.17 ± 0.06 |
| graphite + PVDF coating | 2.19 ± 0.03 | — | — |
| lithium intercalated in graphite based on ≈348 mAh/ggraphite reversible capacity in the first operando NDP cycle; s. Fig. 2a | 0.18 ± 0.003 | 25.84 ± 0.40 | NDPLi-int.= 3.86 ± 0.29 |
| lithium bound to SEI based on ≈98 mAh/ggraphite irrev. cap. during first operando NDP cycle and assuming that the SEI consists purely of LEDC | 0.59 ± 0.01 | 7.28 ± 0.11 | NDPLi-SEI = 1.14 ± 0.09 |
In a first step, we will now determine whether the amount of reversibly intercalated lithium that can be quantified precisely from the measured discharge capacity is indeed in quantitative agreement with the NDP data analysis. Taking into account that the electrochemically measured reversible capacity of ≈348 mAh/ggraphite in the first discharge (s. Fig. 6a) must correspond to a ratio of 1 Li/e−, this equates to 25.84 μmol lithium (≡1.56 × 10¹⁹ Li atoms). Then, the expected lithium concentration (NDPLi-int.) would be the ratio of the calculated lithium atoms divided by the estimated electrode mass of (4.04 ± 0.23) mg in the fully charged state, which equates to NDPLi-int. = (3.86 ± 0.29) × 1021 Li atoms/gelectrode (s. Table II), i.e., the concentration can be estimated with an accuracy of 7.5%. This value corroborates well with the reversible lithium concentration obtained from the NDP measurements which was found to be (3.78 ± 0.37) × 1021 Li atoms/gelectrode, thereby confirming that, within the stated errors, the here presented operando NDP cell design allows for a quantitative NDP measurement while at the same time providing good electrochemical performance.
In a second step, we will now determine whether the amount of lithium in the SEI measured by NDP, namely the determined (0.69 ± 0.07) × 1021 Li atoms/gelectrode at the end of the first discharge (s. spectrum 5 in Fig. 7b), is consistent with what one would expect on the basis of one lithium atom per electron of irreversible charge (i.e., 1 Li/e−) for SEI formation. Assuming the latter and considering the electrochemically observed irreversible capacity of ≈98 mAh/ggraphite (i.e., the difference between the first charge and the first discharge capacity in Fig. 6a), the estimated amount of lithium irreversibly bound to the SEI would amount to 7.28 μmol (≡4.38 × 10¹⁸ Li atoms). Thus, the expected NDP signal from the SEI (NDPLi-SEI) would correspond to the ratio of these estimated lithium atoms divided by the estimated electrode mass of (3.86 ± 0.23) mg in the fully discharged state (spectrum 5 in Fig. 7b), which equates to NDPLi-SEI = (1.14 ± 0.09) × 1021 Li atoms/gelectrode (s. Table II). This value is within measurement uncertainties significantly larger than the concentration value of (0.69 ± 0.07) × 1021 Li atoms/gelectrode measured at 0% SOC using operando NDP (spectrum 5 in Fig. 7b). Therefore, this finding suggests that the Li/e− ratio for SEI formation determined in our experimental setup is much lower than our assumed ratio of 1 Li/e−, and that the Li/e− ratio determined by our operando NDP measurements would only be (0.61 ± 0.08). Possible explanations for this finding are that the intrinsic Li/e− ratio during SEI formation is indeed significantly lower than 1 and/or that a notable fraction of the SEI products are soluble in the electrolyte and are thus not immobilized in the SEI, which is currently being investigated in a different study.
Analysis of the NDP lithium peak at the current collector/electrode interface
Apart from the previously discussed lithium concentration signals within the graphite anode, also an apparent enrichment of lithium at the current collector/electrode interface is observed in the NDP spectrum at the end of the first discharge (spectrum 5 in Fig. 7). In the second charging cycle, this peak remains present and is superimposed with the NDP signal stemming from lithium intercalation, as can be seen upon closer inspection of spectra 6 and 7. The NDP signal peak at the interface between the graphite electrode and the Cu-coated Kapton® window indicates that there is a thin layer at this interface that is enriched in lithium. While this peak could be due to an increased SEI formation or an incomplete delithiation of graphite at this interface, a recent operando NDP study by Lv et al.10 showed a lithium intercalation into the copper current collector. To verify that this is also the case in the herein investigated study, we mimicked the charging process in a second experiment in the operando cell by slowly sweeping the potential of a pure current collector, i.e., the Cu-coated Kapton® foil without graphite coating, to a potential region where intercalation of lithium in copper might occur. Here, the counter electrode was a lithium metal foil, and the interface was subsequently analyzed by in situ NDP and by ex situ XPS.
In order to confirm that the peak at the current collector interface really stems from lithium intercalation into copper, we recorded in situ NDP spectra of an operando NDP cell assembled with the bare Cu-coated Kapton® foil as WE and a metallic lithium CE. The potential of the WE was swept slowly from OCV (≈3 V vs. Li+/Li) to 20 mV vs. Li+/Li in a total time of ≈16 h, after which an in situ NDP spectrum was recorded (red line in Fig. 8). For comparison, a nominally identical cell was also measured by in situ NDP at its OCV, i.e., without polarizing the WE negatively (s. black line in Fig. 8). Only the cell scanned to 20 mV vs. Li+/Li showed a pronounced peak at the energy corresponding to the copper interface (at ≈2000 keV in this case, due to a slightly higher He pressure in the NDP sample chamber), confirming that the peak measured during the operando measurement shown in Figs. 6b and 7 is due to lithium intercalation into the Cu current collector.10 As shown in Fig. 8, the energy resolution of the NDP signal near the current collector is ≈25 keV, which corresponds to a depth resolution of ≈200 nm in Cu.15 Within the Gaussian-shaped signal no internal structure is observed, which indicates a lithium distribution thinner than the NDP resolution. Although the lithium alloying depth profile can not be resolved using NDP, the integral of the isolated lithium alloying signal, as shown as spectra difference in Fig. 8b, allows to quantify the total lithium that was alloyed into the 100 nm-thick copper current collector layer to be (1.77 ± 0.17) × 1016 atoms/cm2 or (0.20 ± 0.02) μgLi/cm2. This value corroborates well with earlier findings of Lv et al.,10 where they report the intercalation of lithium in a conventional 10 μm-thick Cu current collector. Comparing this finding to the total lithium amount of ≈160 μgLi/cm2 that was reversibly intercalated in the graphite electrode (≈25.84 μmolLi = ≈181 μgLi (s. Table II), taking into account the anode diameter of 12 mm) it shows that only ≈0.1% of the reversibly intercalated lithium amount, and is thus quasi non-detectable by electrochemical charge/discharge measurements. We therefore measured the lithium concentration using XPS as a complementary characterization technique on identical ex situ copper current collector anodes, which provides a depth resolution of a few nanometers. In the following, an XPS analysis on the lithiated copper film semi-quantitatively confirms the findings obtained via NDP.

Figure 8. (a) In situ NDP spectra of two electrodes consisting of a 7.5 μm Kapton® foil covered with a 100 nm-thick Cu current collector and assembled against a metallic lithium counter electrode in the operando NDP cell. The potential of one electrode (red) was swept gradually from OCV (≈3 V vs. Li+/Li) to 20 mV vs. Li+/Li within 16 h; the second cell (black) was not cycled and measured at OCV. (b) Intensity difference between the two spectra from (a) showing the additional signal caused by alloy formation between the copper current collector and lithium.
Download figure:
Standard image High-resolution imageAnalysis of lithium insertion into the copper current collector via ex situ XPS
Figure 9a and b show the ex situ XPS spectra for Li 1 s and Cu 3p, respectively, recorded on a Cu-coated Kapton® foil electrode that was polarized to 20 mV vs. Li+/Li in a conventional coin cell with a metallic lithium counter electrode. The cell underwent the same cycling procedure as that used for the ex situ NDP measurements described in the previous section. The Cu-coated Kapton® foil was harvested from the coin cell in a glovebox and inertly transferred under inert conditions into the XPS.

Figure 9. (a) Cu 3p and (b) Li 1s XPS spectra of an electrode consisting of a 7.5 μm Kapton® foil coated with a 100 nm-thick Cu layer. The potential of the electrode was swept from 3 V vs. Li+/Li to 20 mV vs. Li+/Li within 16 h; subsequently, the cell was opened in a glovebox and then transferred under inert conditions into the XPS. XPS spectra were taken after etching the surface to different depths, clearly showing that after removal of the Li-containing SEI (≈6 nm), the lithium signal is still visible. This suggests that Li electrochemically alloyed with the Cu from the current collector.
Download figure:
Standard image High-resolution image
First, the surface of the Cu current collector was cleaned by sputtering to a depth of 0.6 nm with an Ar+ ion gun, followed by recording an XPS spectrum. Afterwards, ≈1.8 nm per sputtering cycle were etched, recording Li 1s and Cu 3p spectra after each cycle. With increasing depth into the sample, the lithium signal continuously decreases, whereas the copper signal increases (s. Fig. 9). At potentials below ≈0.8 V vs. Li+/Li, it is expected that electrolyte is reductively decomposed24,31 on the copper surface, forming an SEI similar to that on graphite particles in an LIB graphite anode.32 The Cu 3p signal measured after the first two sputter cycles, corresponding to sputter depths of ≈0.6 and ≈2.4 nm, respectively, is still rather weak (s. black and red lines in Fig. 9), indicating the presence of an SEI layer. Since the Cu 3p signal is strongly increasing after the third sputtering cycle (at a depth of ≈4.1 nm, s. green line) and stays roughly constant after the fourth sputter cycle (≈5.9 nm, s. dark blue line), suggesting that the complete SEI is at latest removed after etching to a depth of ≈6 nm. SEI thicknesses on graphite are reported to range from 2 to several 10's of nanometers,31,33 which is consistent with our observation. Sputtering into deeper layers, i.e., between ≈6 and ≈1 nm (represented by the blue, turquois, magenta and orange lines), the Li 1s signal is still clearly visible. These observations suggest that some lithium must have diffused into the copper phase forming a Cu-Li alloy. The Cu-Li phase diagram shows a maximum solubility of lithium in copper of up to ≈22 at%,34 and Klemm and Volavsek35 concluded that the lithium solubility extends up to ≈20 at% (or Cu4Li), based on experiments reacting lithium with copper powder at temperatures from about 300 °C to 800 °C. Peñaloza et al.36 reported on a Li-Cu alloy which they obtained by electroplating lithium from a LiCl/KCl salt melt onto an electrolytic copper cathode and Rehnlund et al.37 could detect lithium traces in a copper current collector that they stored in contact with a lithium foil for several days at 50 °C.
Table III shows the atomic ratios of lithium and copper as a function of sputtering depth into the 100 nm-thick copper current collector layer, starting at a sputter depth of ≈7.7 nm, where only copper and lithium alloyed into copper are main species, i.e., where the SEI has been completely removed. At this point, the lithium concentration is ≈16 at%, which is reduced to ≈7 at% at a sputter depth of ≈13 nm. The concentration over this approximately 7.2 nm wide region is ≈11 at% lithium and ≈89 at% copper. Considering an atomic density of copper of ≈8.5 × 10²² atoms/cm3 and assuming that the atomic density does not change significantly upon lithiation, the total atoms of lithium in the copper foil in this 7.2 nm wide region can be estimated to be on the order of 0.6 × 10¹⁶ atoms/cm2. While this clearly underestimates the total lithium concentration, since it only accounts for the lithium concentration between ≈7.7 and ≈13 nm, its magnitude is consistent with the lithium concentration determined by the in situ NDP analysis (1.77 × 10¹⁶ atoms/cm2).
Table III. Atomic ratio of lithium and copper within the copper current collector estimated from the XPS spectra (s. Fig. 9) recorded at different sputtering depths. Only sputtering depths beyond the ≈5.9 nm are considered, as there Cu and Li are the majority surface species.
| at% Li | at% Cu | depth/nm |
|---|---|---|
| 16 | 84 | 7.7 |
| 13 | 87 | 9.4 |
| 9 | 91 | 11.2 |
| 7 | 93 | 13.0 |
As copper foil current collectors are ubiquitously used in commercial LIBs, the rate and the extent of the electrochemical lithiation of a copper current collector during charging is expected to be very low, i.e., negligible compared to the intercalation capacity of a typical graphite electrode. Under the assumption that a 10 μm-thick copper foil used as current collector would be lithiated to form a Li-Cu alloy with ≈20 at% Li, the associated charge would result in an areal capacity of 0.95 mAh/cm2. This would correspond to ≈38 % of the capacity of a typical graphite anode (assuming an areal capacity of 2.5 mAh/cm2), which would be quite significant and there is no experimental data which would suggest that this occurs. Thus, the lithiation of copper must be a very slow process. While we have not sputtered deep enough to determine the maximum penetration of lithium into the copper current collector, Table III suggests that the diffusion of lithium into the Cu current collector does not extend much beyond ≈10 nm. Assuming this process to be driven by diffusion, the diffusion time, τ, should be proportional to the square of the diffusion distance x. Considering that the Cu current collector in these experiments was at a potential below 250 mV vs. Li+/Li for 14 h, and assuming that this is low enough to drive lithium alloying into Cu, a lithium penetration of ≈1 μm into the copper foil would require ≈144 h or more than 4 years. This time scale is far beyond typical charging intervals of a LIB, which is why a parasitic lithiation of an anode current collector would generate too little charge to be measured electrochemically.
Conclusions
In this work, we introduce a newly developed cell setup suitable for operando Neutron Depth Profiling (NDP) measurements. We present operando NDP data recorded during formation of a conventional graphite electrode with a reasonable areal capacity of ≈0.62 mAh/cm2 (corresponding to a thickness of ≈(17 ± 2) μm) at a rate of ≈C/16. To the best of our knowledge, this is the first study proving that the cycling performance in an operando NDP lithium-ion battery (LIB) cell is comparable to that of a standard laboratory coin cell. This was accomplished by using a thin Kapton® window permeable for triton particles together with a specially designed coin cell cap that is modified to contain a pattern of holes with a diameter of 500 μm in order to maximize the NDP signal while providing a good contact pressure on the electrodes. This design yielded good cell performance and, furthermore, it was shown to guarantee a homogenous lithiation across the entire electrode. A cell design with a more commonly used single window with a diameter of 4 mm was found to result in incomplete lithiation of the graphite active material in the center region of the window, even at a very slow charging rate of C/15, caused by the low and inhomogenous compression of the electrodes across the window area. However, since the fraction of the electrode outside the 4 mm window area is large compared to the window area, the cell voltage profile and the specific capacity gave no clear indication of the inhomogenous lithiation across the window area, so that NDP measurements in this configuration would obviously not yield data which could be correlated with the cell voltage profile and the measured state-of-charge. This underlines the importance of obtaining representative electrochemistry in operando cells, particularly in the window region.
By subtracting the NDP signal of a reference cell, it was possible to differentiate between lithium contained in the electrolyte, and additional lithium accumulating in the electrode upon cell cycling. Furthermore, we could distinguish between both irreversibly bound lithium within the SEI and reversibly intercalated lithium in the graphite active material, and also quantify the lithium concentrations in each case within a systematic uncertainty of ±9.8%. As outlined in our study, this rather large error results mostly from the uncertainty in alignment of the grid pattern of the holes with the neutron beam.
Within the here defined experimental errors, the concentration of reversibly intercalated lithium determined via NDP was found to be in excellent agreement with the electrochemically measured reversible capacity, for which a well defined ratio of 1 Li/e− is known. However, the lithium concentration observed at the end of the first charge/discharge cycle, corresponding to lithium bound in the SEI, was shown to be significantly lower than what one would calculate based on the expected 1 Li/e− ratio that is implied by the known electrolyte decomposition mechanisms. Instead, the NDP data suggest a ratio of (0.61 ± 0.08) Li/e−, which either indicates electrochemical SEI formation reactions with an average ratio of <1 Li/e− or dissolution of lithium-containing SEI species after or during SEI formation. A detailed interpretation of this finding will be provided in a future study, which is currently in progress.
During slow charging of the cell, an increased lithium concentration at the interface between the graphite electrode and the copper current collector was identified which could be assigned to the electrochemical alloy formation between lithium and the surface-near region of the copper current collector; this was verified by ex situ XPS sputter profiling. The quantitative amount of lithium detected via NDP was in agreement with the lithium amount estimated by XPS depth profiles, and corresponds to only ≈0.1% of the reversibly intercalated lithium, making it quasi non-detectable by electrochemical charge/discharge measurements.
The herein presented operando NDP cell design can be a useful tool to investigate dynamic lithium transport in battery electrodes during operation, at the same time allowing for a spatial resolution of concentration changes. Possible future applications could therefore be the determination of transport parameters for lithium (e.g., diffusion coefficients), which is usually a very challenging task, using specially designed model electrodes. Furthermore, an interesting study would be the investigation of lithium plating during fast-charging (e.g., on graphite), which is currently under progress in our group. For such an experiment, the cell has to deliver a good electrochemical performance also at high C-rates, and possible artefacts stemming from a lack of compression in a large hole, as we have proven to be the case in the course of this study, must be avoided. Especially, the spatial resolution is here of crucial importance, since the occurrence of lithium concentration gradients would presumably lead to an onset of lithium plating close to the separator/electrode interface. Another interesting application could be the exploration of the lithium plating and stripping processes on lithium metal anodes or in so called "anode-free" lithium-ion cells that are recently gaining increasing attention as an alternative to graphite anode-based LIBs.38 Apart from battery applications, the presented design can be applied for many applications containing liquids or sensitive materials, which are hard to measure using NDP.
Acknowledgments
The authors want to thank SGL Carbon for providing the sieved graphite active material, and Daniel Pritzl for his assistance in recording the XPS sputter profiles. The Heinz Maier-Leibnitz Zentrum (MLZ) is kindly acknowledged for the possibility to use the high flux neutron beam at the PGAA facility. FL and MT gratefully acknowledge funding by the BMBF (Federal Ministry of Education and Research, Germany) for their financial support under the auspices of the "'ExZellTUM II" project (grant number 03XP0081) and the "N4DP" project (grant number 05K16WO1), respectively.