Abstract
Among various electrical energy storage devices the recent advances in Li-ion battery technology has made this technology very promising for the electric vehicles. The advantage of these batteries is high energy and power density. Understanding the aging mechanisms of these batteries to improve the cycle life is critical for electrification of vehicles. Aging of the cells at the system level is quantified by the increase in internal resistance and drop in capacity. It is imperative to understand the degradation of the electrode materials of the battery related to these system level parameters. The degradation of the material is caused by several simultaneous physiochemical processes that occur within the batteries, which makes material characterization of the electrodes challenging. This review provides results of a systematic multi-scale characterization study to understand the degradation mechanisms in LiFePO4 cathode material. The study includes various techniques to understand the physical, morphological, electrical, chemical and structural changes in the cathode material. The review also presents an overview of the various modeling techniques used for Li-ion batteries. Simulation results of one of the models are presented using results of multi-scale characterization studies of the cathode material.
Export citation and abstract BibTeX RIS
The world energy consumption is expected to double in the next 50 years.1 Increased environmental awareness has renewed our interest in low or zero emission energy sources to meet this ever-growing demand for energy. One of the major sources of energy consumption is for our daily transportation needs. So far, we have heavily relied on hydrocarbon-fueled internal combustion engines for our daily transportation needs. Vehicles powered by hydrocarbon fuels are one of the major sources of green house gases, such as CO2, causing air pollution and damaging the ecosystem. Electrochemical energy storage systems such as batteries, fuel cells and supercapacitors can play a vital role in electrification of personal transportation systems by providing a sustainable clean energy source and subsequently reducing green house gas emissions.2–4
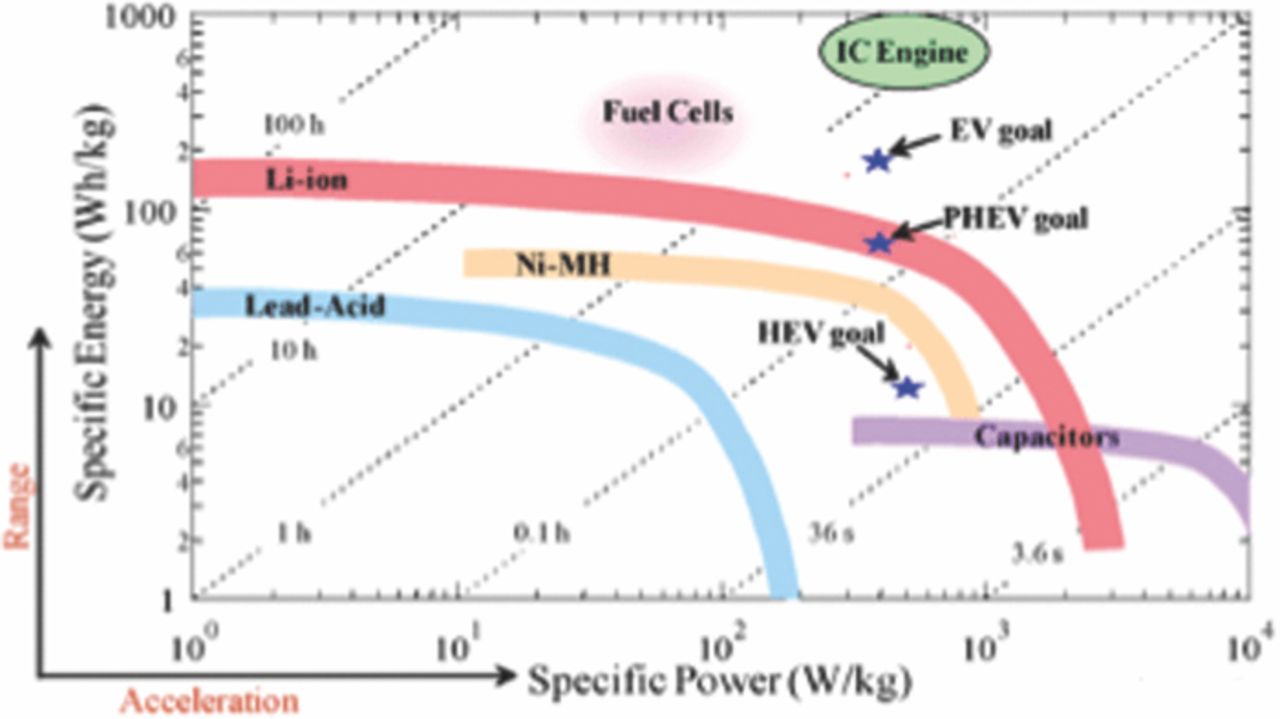
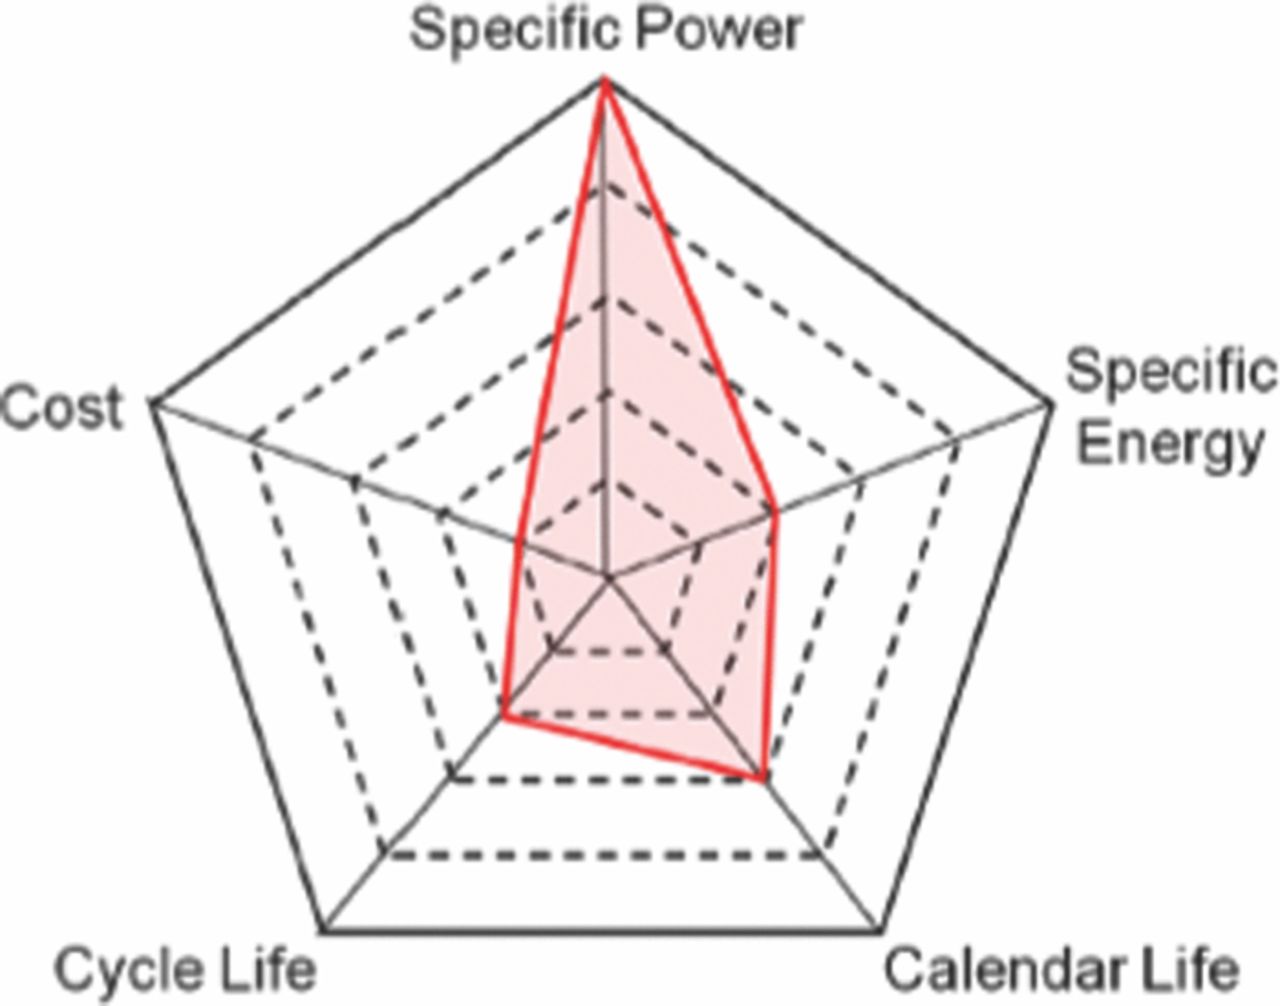
Winter and Brodd5 have presented a detailed review of these various electrochemical energy storage systems. A brief comparison of prominent battery chemistries for automobile applications is given in Appendix
A scientific fundamental understanding of the phenomena governing the degradation of life is necessary in achieving sustainable improvements in cost, as well as calendar and cycle life. When a cell is formed and put in operation the operating current and temperature of the cell, which can affect the cell kinetics and transport phenomena can be controlled to optimize its performance. The evolution of design parameters such as active material particle size, electrode thickness, porosity, and active surface area during operation, will also affect transport and kinetic phenomena within the cell resulting in performance degradation and loss of cycle life. A scientific understanding of the phenomena governing the degradation of these parameters and its effect on transport and kinetic phenomena will be different in large format cells that are used in building packs and modules for EV's than in the traditional coin cells used in laboratory studies.
It is generally difficult to analyze all the aging mechanisms in a single article due to the various different chemistries of the lithium-ion cells. Even within particular cell chemistry the aging mechanisms will be greatly affected by the nature of the different components such as the synthesis process of the active material, electrode design, manufacturing and assembly process, etc. In this overview article we present a methodology to systematically study this degradation of life in large format LiFePO4 cells. We will first briefly discuss the fundamental operation of a standard Li-ion cell along with the different materials, structure and fabrication processes used in building the large format Li-ion cells. We then discuss the most commonly observed aging mechanisms across different lithium-ion cell chemistries. This will be followed by the main topic of this article, a multi-scale characterization methodology that analyzes the evolution of various parameters, which affect the fundamental kinetic and transport phenomena over the life of the large format cell causing degradation in performance and life of the cell. We will cover some of the modeling efforts used in predicting the performance and simulating the life of large format Li-ion cells. The overview concludes with a brief summary of the damage mechanisms identified at various length scales, the summary of the modeling techniques, and the scope for future studies.
Li-Ion Batteries
Like any typical electrochemical cell, a Li-ion cell has two electrodes, an anode and a cathode separated by an electrically insulating separator. The cell is filled with electrolyte that is a solvent containing lithium salt. Figure 3 shows a schematic of a Li-ion cell with a graphite anode, LiFePO4 cathode, separator and an electrolyte. The cell stores the electrical energy in the form of chemical energy during charging and delivers this stored energy back as electrical energy during discharging. This energy conversion takes place within the cell through a redox reaction. This redox reaction is a combination of two separate half-cell reactions taking place at the two electrodes. During discharging, the anode undergoes an oxidation reaction as seen in Eq. 2.1.
![Equation ([2.1])](https://content.cld.iop.org/journals/1945-7111/160/11/A2111/revision1/jes_160_11_A2111eqn1.jpg)
The 0 ⩽ x ⩽ 1 denotes the degree of lithiation of the anode. Correspondingly, the cathode undergoes the reduction reaction as given by Eq. 2.2
![Equation ([2.2])](https://content.cld.iop.org/journals/1945-7111/160/11/A2111/revision1/jes_160_11_A2111eqn2.jpg)
Similarly, 0 ⩽ y ⩽ 1 denotes the degree of lithiation of the cathode. During these reactions the Li+ ions from the anode diffuse through the liquid electrolyte and through the separator and intercalate into the cathode material. The electrons flow through the external circuit providing the necessary electrical energy. The same reactions occur in the reverse direction when the cell is charged with an external source of energy. Li+ ions deintercalate from the cathode and intercalate into the anode during the charging of the cell. The two half-cell reactions combined together give the following complete reaction for the cell,
![Equation ([2.3])](https://content.cld.iop.org/journals/1945-7111/160/11/A2111/revision1/jes_160_11_A2111eqn3.jpg)
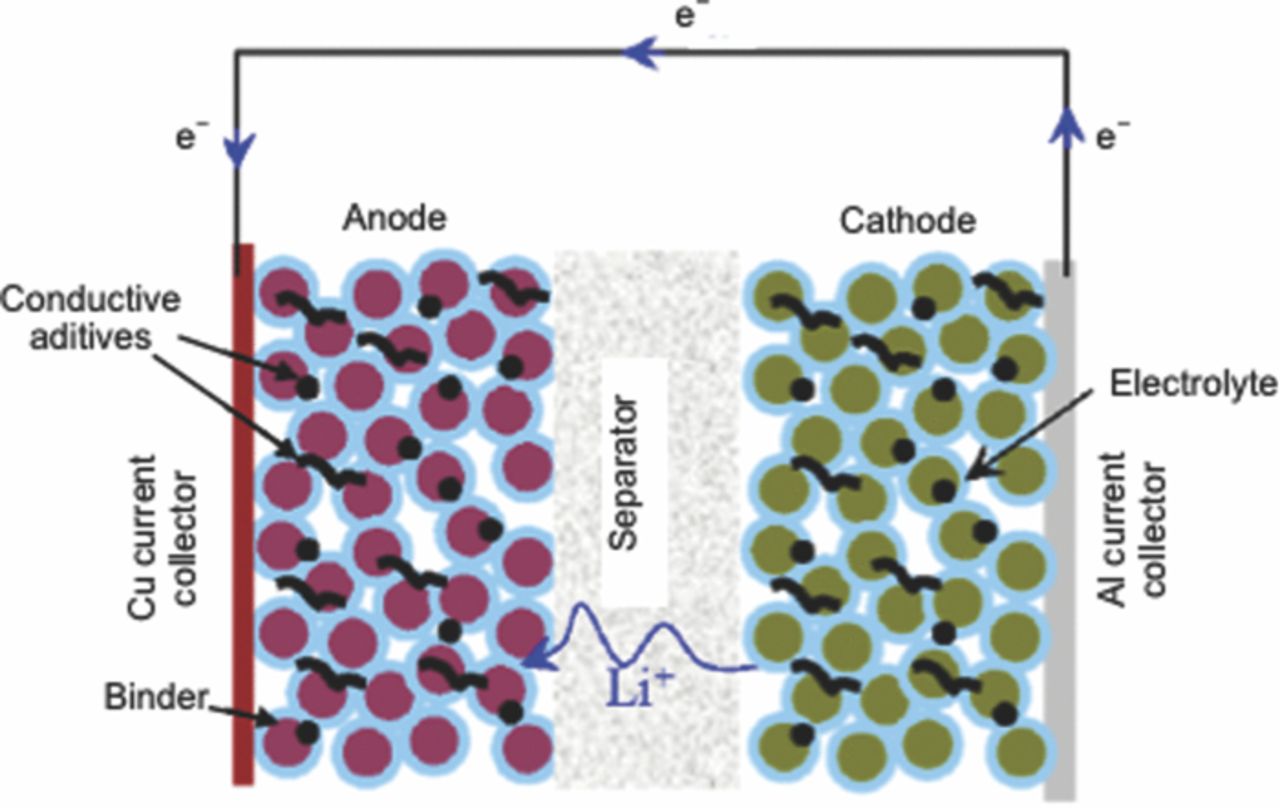
Figure 3. Schematic of Li-ion cell operstion. During charging Li+ ions are inserted in the anode structure by virtue of intercalation and during discharging, these Li+ ions are removed from the anode structure by virtue of deintercalation and transferred to the cathode (adapted from Srinivasan9).
The performance of these batteries is highly dependent on the thermal, mechanical and physical stability of its materials. The main components of the lithium ion battery are the anode, cathode, separator and the electrolyte. The combination of the anode, cathode, electrolyte and separator materials will dictate the performance of the cell, the energy and power capacity, life, safety characteristics, operating temperatures, etc. The electrodes are a composite structure comprising of active material, binders, and additives.17–21 The separator is made up of a polymer that prevents the contact between the anode and cathode but allows lithium ions to pass through it. The electrolyte provides the path for the lithium ions to travel between the electrodes during the cycling of the cell. Due to the potential application of these batteries in the transportation industry, there has been a great deal of effort to develop cheaper, reliable and stable materials. In doing so, often extraordinary claims are made about the long term electrochemical performance of the system while the intrinsic limitations are overlooked. Here certain active materials for anode, cathode, and electrolytes have been discussed. These materials have been tested by several researchers and they have shown certain potential in furthering lithium ion battery technology. We will now briefly discuss the various materials of the cell, and the manufacturing and assembly processes of large format cells for completeness of this overview.
Electrodes
Electrodes are the active material within the cell that undergo the intercalation and deintercalation process during charging and discharging cycles. The combination of the electrode material for the cell decides the operating voltage, the specific energy and the specific power capacity of the cell. The electrode materials should have these key features:17,22
- The anode material should have a high lithium chemical potential and the cathode material should have low lithium chemical potential to maximize the operating voltage.
- The electrode material should be able to hold a large amount of lithium ions per unit formula of the material to maximize the cell capacity.
- The electrode material should have good structural integrity and should be able to withstand the cyclic volume change for a large number of charge-discharge cycles to maximize the cell life.
- The electrode material should have good ionic and electronic conductivity to minimize the polarization losses and maximize the power capability of the cell.
- The redox voltages of the electrode material should lie within the stable operating voltages of the electrolyte.
- The electrode material should be inexpensive, environmentally benign, and thermally and chemically stable within the required operating conditions.
Anode
Lithium is an ideal anode material for Li-ion batteries, but because of the plating out of lithium during the charge/discharge cycle and subsequent formation of dendrites, there is a risk of the cell being short-circuited. Instead, carbonaceous materials are preferred for anodes in current commercial Li-ion batteries.23 Studies have been conducted on graphite,24 C-C composite, mesocarbon microbeads (MCMB),25 carbon nanotubes26,27 and carbon films. These anodes have a very good rate of lithium insertion/removal and thus improve the charge/discharge rate (power rating) of the battery, but the performance of the cell is limited due to the formation of a solid electrolyte interphase (SEI) during cycling of the cell.23,28,29 The SEI is formed from the electrolyte decomposition products.30 This SEI layer prevents the graphite surface from further exfoliation and also prevents further reduction of the electrolyte and consumption of active lithium. In the case of nanoparticulate graphite, the consumption of active lithium would be even higher, and the excessive charge developed between the graphite surface and the SEI would result in a loss of overall cell voltage. The SEI layer also reduces the active surface area and the porosity affecting the performance of the cell. Also, it is important to note that the lithium is intercalated into graphite at potentials less than 100 mV versus Li/Li+. There is always a risk of lithium depositing on the graphite surface resulting in dendrite formation and fatal short-circuiting of the cell.24 The other classes of materials that are being pursued are the materials that can reversibly form alloys with lithium. As shown in Table I these alloys have much higher capacity than graphite. Since the equilibrium potential of these alloys with Li/Li+ is higher the possibility of plating and the reduction of electrolyte solvent is minimized. The drawback of these materials is the large volume change during the charging and discharging cycles that leads to cracking and mechanical disintegration of the anode structure. The last groups of materials that can be used as anode are certain lithium oxides that have low lithium equilibrium potential. TiO2 is an example of such a material.31 These materials have the least risk of lithium plating and electrolyte reduction, but have very low energy capacity due to the low operating voltage when coupled with other cathode material.
Table I. Properties of certain anode materials suitable for lithium-ion batteries (adapted from Mantia282).
| Reduced form | Oxidized form | Eeq (Li/Li+) (V)a | Qmax / (mAh g-1)b |
|---|---|---|---|
| Metals | |||
| Li | Li+c | 0 | 3861 |
| Graphite based compounds | |||
| LiC6 | Graphite | 0.1 | 372 |
| Li1/2C6 | Graphite | 0.13 | 186 |
| Li1/3C6 | Graphite | 0.22 | 124 |
| Alloys | |||
| LiAl | Al | 0.35 | 993 |
| Li22Sn5 | Sn | 0.42–0.66 | 994 |
| Li3Sb | Sb | 0.9 | 660 |
| Li21Si5 | Si | 0.3 | 4000 |
| Titanates | |||
| LixTiO2 | TiO2 | 1.8 | 170 |
| Li4+xTi5O12 | Li4Ti5O12 | 1.5 | 160 |
aThe electrochemical activity can be observed in a range of potentials. bThe specific charge is relative to the weight of the pristine active material. cLi+ is in solution.18,19,283
Cathode
The most common cathode materials are layered oxides LiMO2, the spinels Li[M2]O4 and olivines LiMPO4 where M is a transition metal atom.7
Layered oxide LiCoO2, was developed as the cathode material for commercial Li-ion batteries,7,24 but due to expensive and toxic cobalt they were later replaced by other layered oxides such as LiNi0.8Co0.15Al0.05O2, LiNi0.8Co0.2O2, Li1−xNi1−yCoyO2, and LiMn0.5Ni0.5O2 in commercial batteries.7,32,33 These oxides have a high operating voltage, in the range of 2.75 V to 4.3 V.7 They have very high energy density and power density but they lack the necessary structural stability for deep discharge cycles, during which the host oxide structure collapses upon removal of more than 50% of the Li. The spinel structured LiMn2O4 has good structural stability.24 They also have higher operating voltage and high charge/discharge rate but low energy density. The most recent among these cathode materials have been olivine-structured materials such as LiFePO4. LiFePO4 has a lower operating voltage of ∼3.3 V but demonstrates higher power and energy density along with good structural stability. Using nanosized particles helps mitigate the lower conductivity of LiFePO4. Table II lists the properties of certain cathode materials. Battery manufacturers have also developed cathodes with multiple materials such as a mixed cathode with Li Ni1/3Mn1/3Co1/3O2 layered oxide and LiMn2O4 spinel.34–40 They have high specific capacity and thermal stability, and they limit the dissolution of Mn that limits the cycle life.11,37–39,41,42
Table II. Properties of certain cathode materials suitable for lithium-ion batteries (adapted from Mantia282).
| Reduced form | Oxidized form | Eeq (Li/Li+) (V)a | Qmax (mAh g-1)b |
|---|---|---|---|
| Layered compounds | |||
| LiTiS2 | TiS2 | 1.5–2.4 | 239 |
| Li3V2O5 | V2O5 | 2–3.5 | 442 |
| LiCoO2 | LixCoO2 | 3.5–4.2 | 274 |
| LiNiO2 | LixNiO2 | 3.5–4.2 | 274 |
| LiMnO2 | LixMnO2 | 3.5–4.2 | 285 |
| Li(NiMnCo)O2 | Lix(NiMnCo)O2 | 3–4.5c | 274(c) |
| Olivines | |||
| LiMnO4 | LixMnO4 | 3 –4 | 213 |
| Spinel | |||
| LiFePO4 | FePO4 | 3.4 | 170 |
aThe electrochemical activity can be observed in a range of potentials. bThe specific charge is relative to the weight of the pristine active material and all lithium m ions removed. cThe mixed oxides can show very different behavior depending on the exact composition.20
This review focuses on the characterization of LiFePO4 cathode material used in commercial cells. This material is extensively discussed in literature and it is preferred by some automobile makers due to its low cost and environmentally benign nature. The oxygen atoms in the phosphate have strong bonds and are not easily released, making the material incombustible in the event of overcharging. Thus the material is thermally and chemically stable and can provide thousands of charge/discharge cycles.43–46
Separators
A separator is porous membrane with good ionic conductivity and good electronic insulation. The separator should allow a rapid flow of ions while preventing any electrical contact between the two electrodes of the cell. Until recently very little research and development has done to develop new separators as compared to other battery components. The separators should have the following features:47
- Good electronic insulator
- Minimum electrolyte and ionic resistance
- Good mechanical, dimensional and physical stability
- Uniform thickness, and tortuosity
- Chemically stable and resistant to degradation by electrolyte, impurities and electrode reactants and products.
- Thermally stable
- Prevent migration of species between the two electrodes
- Easily wetted by the electrolyte
The most common type of separators in nonaqueous Li-ion batteries is microporous polyolefins. They can be a single layer of polyethylene (PE), polypropylene (PP) or laminates of PE and PP (Fig. 4).47,48
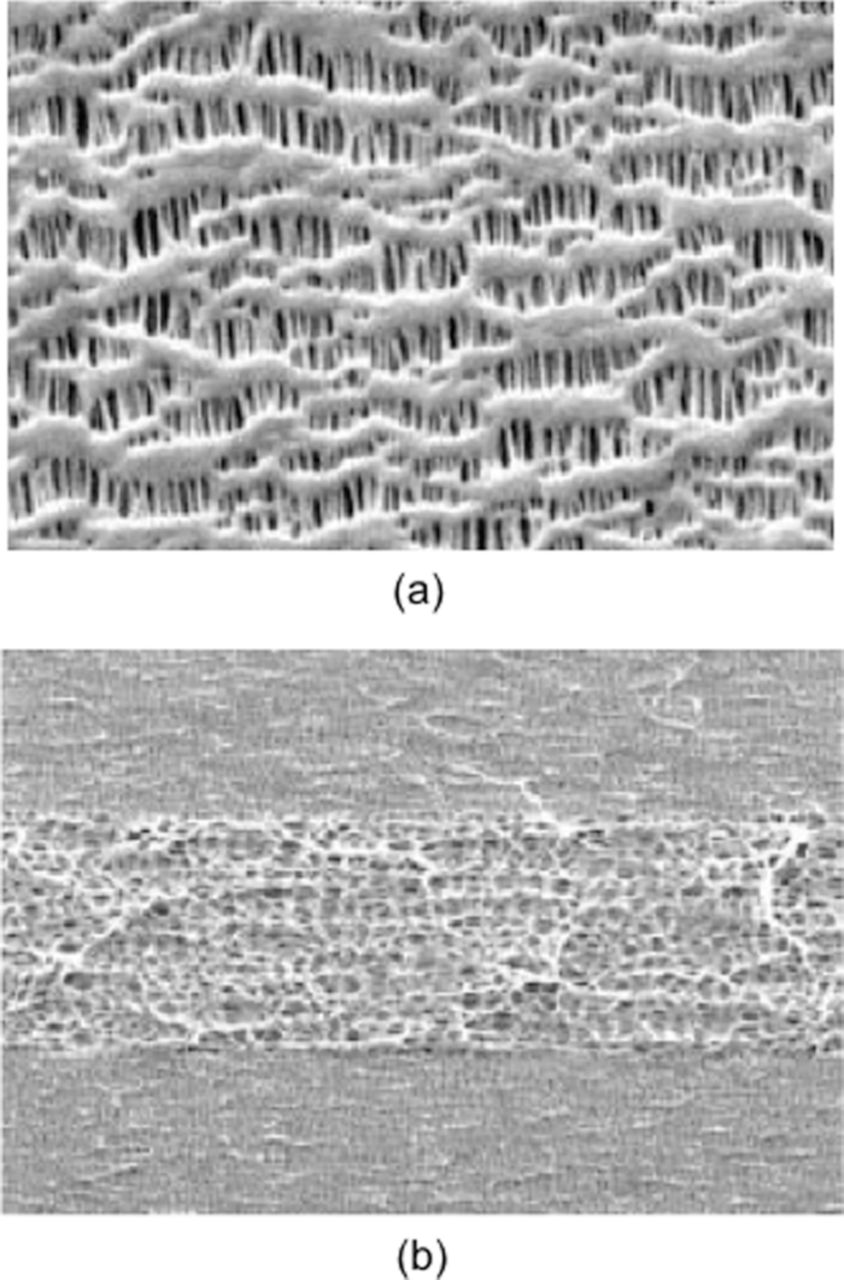
Figure 4. SEM micrographs of (a) uni-layer and (b) tri-layer microporous separator. [Picture courtesy Celgrad]
Electrolytes
The function of the electrolyte is to provide a path for the ions while blocking any electronic charge flow. An electrolyte should have the following keys features49
- Good ionic conductor and electronic insulator, to have better ion transport and minimum self-discharge
- Electrochemically inert with both, the oxidizing or reducing electrode surfaces within the operating range of the cell
- Should not react with other cell components such as cell separators, current collectors, etc.
- Environmentally benign
The combination of electrolyte and the electrode materials is responsible for the formation of the SEI that limits the life of the cell. The stability and quality of the film depends on the electrolyte composition, additives and impurities. Usually the electrolyte is composed of one or more liquid solvents and one or more salts. The most common electrolytes used in current generation lithium ion batteries are non-aqueous. The preferred solvent for the electrolyte in lithium-ion batteries is a combination of ethylene carbonate (EC) and dimethyl carbonate (DMC). EC is solid at room temperature and has low viscosity.49 The EC:DMC mixture is liquid for range of compositions. The most common salt is LiPF6. A 1 M LiPF6 solution of EC:DMC 1:1 (wt) has a conductivity of 107 mS cm−1, and it is stable and safe in the temperature range between −20 and 50°C. The conductivity is quite high for a nonaqueous electrolyte, but is still too low to avoid non-homogeneous usage of thick electrodes when high power is required. Certain polymers and ionic liquids are being developed for future generations of lithium ion batteries.49 Solid polymer electrolytes have very poor conductivity (<1 mS cm−1).50 Ionic liquids also need to be tested before they can be used in lithium ion batteries.49 Table III lists the properties of certain solutes and solvent for lithium-ion battery electrolytes.
Table III. Properties of certain solvent and solutes for lithium-ion battery electrolytes (adapted from Mantia282).
| Solvents | ||||
|---|---|---|---|---|
| Solvent | Tm (°C) | Tb (°C) | η (cPa) | ɛa |
| Cyclic carbonates | ||||
| EC | 36.4 | 248 | 1.9b | 89.8 |
| PC | −48.8 | 242 | 2.5 | 64.9 |
| Linear carbonates | ||||
| DMC | 4.6 | 91 | 0.59 | 3.1 |
| DEC | −74.3 | 126 | 0.75 | 2.8 |
| EMC | −53 | 110 | 0.65 | 2.9 |
| Salts | ||||
| σ (mS cm−1) | ||||
| Salt | T (°C) | PC | EC:DMC | |
| LiBF4 | >100 | 3.4 | 4.9 | |
| LiPF6 | ∼80 | 5.8 | 10.7 | |
| LiAsF6 | >100 | 5.7 | 11.1 | |
| LiClO4 | >100 | 5.6 | 8.4 | |
Construction and assembly of large format cells
The manufacturing technology for large format cells includes chemical synthesis, film casting, joining, polymer manufacturing, etc. Some of the key challenges for lithium-ion battery manufacturing are the scaling up of the processes, quality control, advanced materials processing, cost of the equipment and dry room environment.
The active electrode materials is synthesized as spherical or ellipsoidal particles. The nanoparticles of these lithium compounds are made by grinding, by synthesis from solution, or by solgel approaches.24 The particle size is very critical in cell operation. As seen in the equation below the time for diffusion (t) is directly proportional to the size of the particle,
![Equation ([2.4])](https://content.cld.iop.org/journals/1945-7111/160/11/A2111/revision1/jes_160_11_A2111eqn4.jpg)
where 2d is the diameter of the particle and D is the diffusion coefficient. Hence the primary particles have a radius in a nanometer to micrometer range to reduce the diffusion time and length, to provide a higher electrolyte/electrode contact area, and thus to improve the charge/discharge kinetics of the Li-ion batteries.51
The active material particles are mixed with a carbon filler material and polyvinylidene fluoride (PVDF) binder material to form thick slurry that does not flow but is conformable. This thick slurry is then "painted" onto a metal substrate that acts as a current collector during cell operation. Typically the current collector for the anode side is copper while for the cathode side it is aluminum. The composite electrodes are porous in structure, so that the electrolyte can percolate through the pores and provide the transport mechanisms for the lithium ion produced from electrode reactions. Table IV shows the typical parameters of the two electrodes. Since the cathode material has less capacity than the anode material the thickness of the cathode is usually higher to achieve uniform utilization of the active material.
Table IV. Typical values of different properties of design parameter of porous electrodes for large format Li-ion cell.11
| Property name | Value |
|---|---|
| Binder volume fraction | 5–10% |
| Porosity | 30–40% |
| Average active material particle radius (nm) | 1–1000 |
| Thickness (μm) | 50–100 |
The electrodes are then assembled in a sandwich pattern with alternate layers of separator material in between. The properties of common commercial separators are shown in Table V. The sandwich of the anode, separator and cathode material is then assembled in casing of different shape and size (Fig. 5) by rolling, folding or stacking process. The casing structure is filled with just enough electrolyte to fill the pores of the solid matrix and then it is hermetically sealed.
Table V. Typical properties of commercially available separators for large format Li-ion cells.11,47,48
| Property name | Value | |
|---|---|---|
| Composition | PE or PP | PP/PE/PP |
| Thickness (μm) | 20–25 | 20–25 |
| Gurley (s) | 22–26 | 20–23 |
| Porosity | 40–43% | 42 |
| Ionic resistivitya (Ω cm2) | 2.23–2.66 | 1.36–1.85 |
| Melting temperatre (°C) | 137–165 | 135/165 |
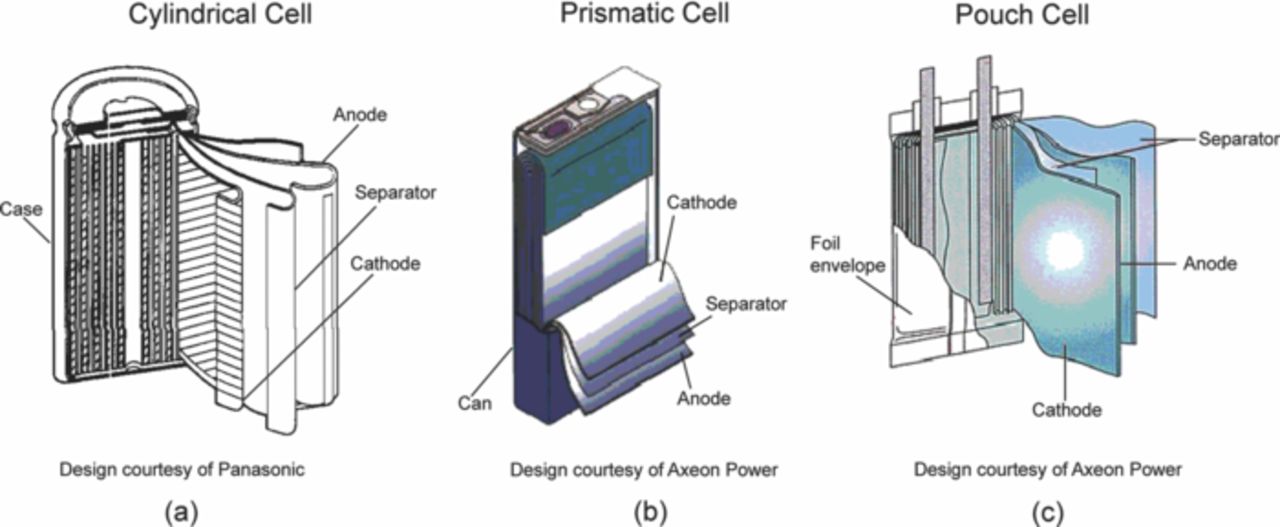
Figure 5. (a) Schematic of a cylindrical lithium-ion battery. The components are rolled and packed in a cylindrical case. (b) Schematic of a prismatic lithium-ion battery. The components are stacked in layers and enclosed in a rectangular casing. (c) Schematic of a pouch cell. The components are stacked in layers and enclosed in a foil envelope.156,284
Commercial batteries vary in size and shape from the coin cells as shown in Fig. 5. Cylindrical cells (Fig. 5a) were initially preferred due to ease of manufacturing and better protection from environmental contaminants.
The prismatic cell (Fig. 5b) and pouch cell (Fig. 5c) have now become more common due to better stacking efficiency in packs. The prismatic and pouch cells have higher volumetric density when assembled in a pack. The drawbacks of the pouch cell are swelling due to the evolution of gases and high sensitivity to twist.52
Critical issue in aging studies of large format cells
First principles electrochemical models can adequately describe the electrochemical operation of the Li-ion cell, but the scientific understanding of the phenomena that governs the degradation in large format cells limiting its performance and calendar and cycle life are not yet fully understood30,53,54 When a cell is formed and put in operation the operating current and temperature of the cell, which can affect the cell kinetics and transport phenomena, can be controlled to optimize its performance. In large format cells the evolution of design parameters such as active material particle size, electrode thickness, porosity, and active surface area will also affect the transport and kinetic phenomena within the cell, resulting in performance degradation and loss of cycle life. A scientific understanding of the phenomena governing the degradation of these parameters and their effect on transport and kinetic phenomena in large format cells is necessary in achieving sustainable improvements in robustness, manufacturing cost, and calendar and cycle life.
Several material characterization techniques such as scanning probe microscopy, electron microscopy, X-ray diffraction and neutron-scattering and imaging have been used to study degradation in the battery materials.33,55–60 However, these studies are often focused on small and inappropriate formats such as coin-cells, giving access to analyze individual electrodes of the cell.61 Also, these techniques are used separately, and the results are not well coordinated. Such studies are very useful in addressing the intrinsic behavior of the active material, but the results of such studies cannot be directly scaled to the large format cells used in vehicle electrification.
Coin-cells have very low capacity and high area specific impedance and cannot be subjected to the levels of current and number of cycles common for large format cells. Electrode tortuosity, thickness, adhesion between the active material and current collector, amount of electrolyte, gas formation, etc. are different between coin-cells and large format cells, so the degradation mechanisms will not be exactly the same in the two systems. Thus, in large format cells the hardware including the design, geometry, and manufacturing processes will dominate performance, hence a detailed experimental framework is needed to comprehend the complex degradation mechanisms in large format Li-ion cells. Multi-scale characterization will help to understand the cause-and-effect relationship between the observed phenomena and the degradation pathways due to the design, geometry, manufacturing processes, materials and operating conditions.
As shown in Fig. 6a and Fig. 6b when a LiFePO4 based commercial cylindrical cell is disassembled and the jellyroll is unrolled, the length of each individual electrode is ∼1.5 m. As discussed earlier, in the LiFePO4 battery the active LiFePO4 material is synthesized as a nanomaterial. One cannot randomly pick an area on the long cathode strip and hope to see the effects of the aging mechanisms on the LiFePO4 nanoparticles. Exhaustive search over the entire electrode strips will be physically impossible with available microscopic characterization techniques. Thus to address this issue and still investigate the cascading effects of various physiochemical process on the electrode structure a multi-scale characterization plan is necessary for understanding the degradation mechanisms in commercial batteries. Techniques such as SEM, TEM, XRD etc., are used here to study various properties such as the morphology, phase transformation, electronic properties, etc. Results of these characterizations are coordinated to focus on a specific location on the electrode surface. Thus the results are analyzed in conjunction with each other and at different length scales based on the technique. As a result, these studies provide a comprehensive understanding of material degradation with spatial resolution.
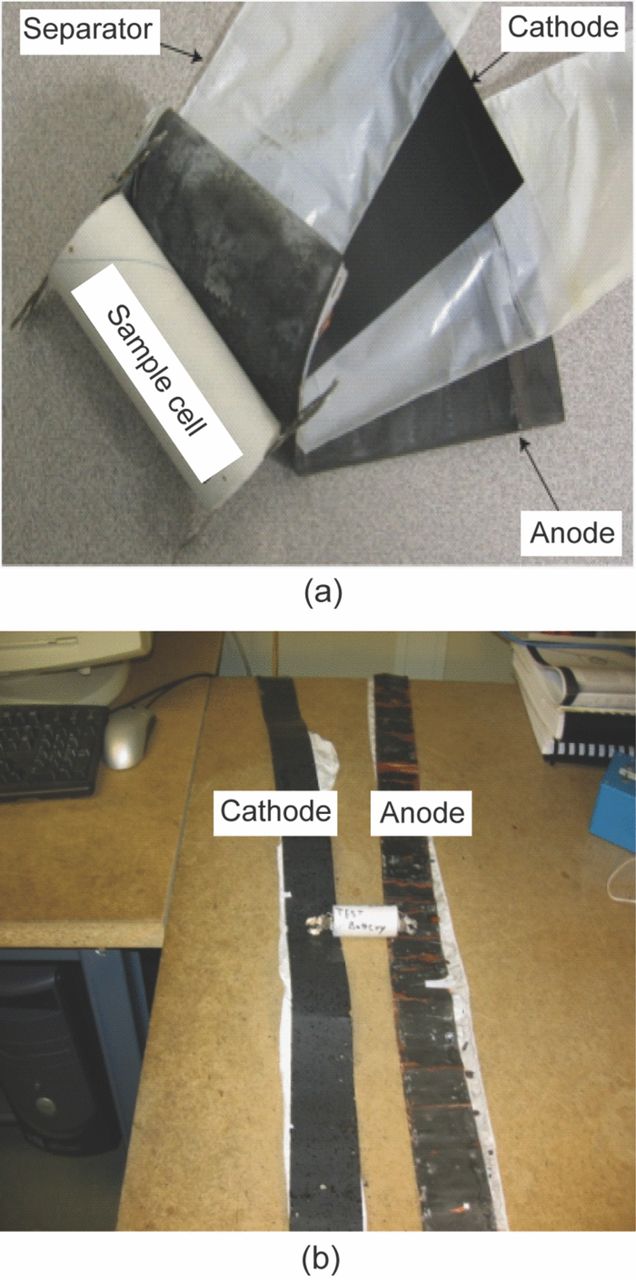
Figure 6. (a) A picture of a typical cylindrical cell. The cell is typically referred to as 26650 where the diameter of the cell is 26 mm and the length is 650 mm. The jelly roll of the cell components is also seen here. (b) A picture of the dissembled and unrolled components of the cell. The strip on the left is the cathode and the strip on the right is anode. The length of each electrode is ∼1.5 m long and 25 mm wide.
Several experimental techniques shown in Fig. 7 were chosen to address physical/morphological changes, electrical changes as well as chemical and structural changes in the cathode material. The techniques were spanned over different length scales to understand the effects of aging on these cathode design parameters. Thermography was chosen as the starting technique to scan the entire length of the cathode strip and identify the potential areas of degradation. It is assumed that changes in the thermal properties also affect the electrical properties of the material. Based on the thermal maps the samples were prepared for further analysis with SEM, AFM and TEM. The capacity curves and the internal resistance are the aging metrics at the system level. But to understand the effects of morphological changes on electrical properties of the material at micro/nano scale, characterization techniques such as SSRM and KPM available with AFM were included. Chemical and structural analyzes techniques were chosen to investigate the local chemical changes, the local Li environment and its bonding with neighboring elements in the LiFePO4 crystal structure, as well as to identify the effect of aging on the Li concentration profiles within the electrodes. The results of these characterization studies are discussed in section 4, 5, and 6. But before we present these results, in the next section we will discuss the preparation of aged cells for characterizing the degradation mechanisms.
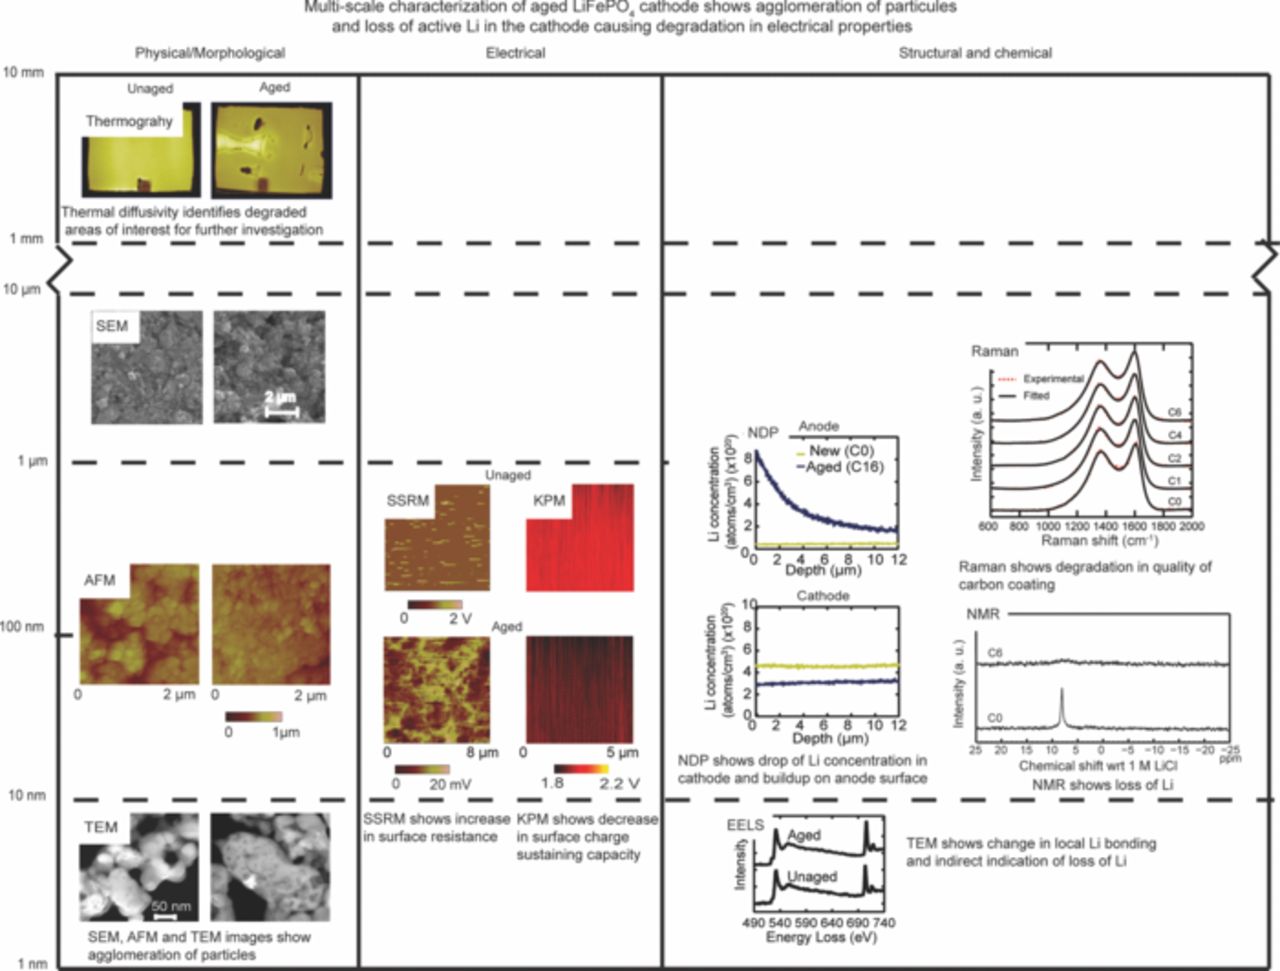
Figure 7. A chart displaying the various techniques used at different length scales for multi-scale characterization of the materials.
Aging Cycles for Li-Ion Batteries
Aging or cycling of the batteries for aging studies is very critical for material characterization. The aging cycles should be representative of an actual charge/discharge cycle a battery would experience in the vehicle. The operating temperature, SOC, DOD and the C-rate are generally considered to be the main factors affecting the aging of batteries. The general terminology for Li-ion battery packaging and operating parameters is given in Appendix
Typical driving cycles have been developed to represent the driving conditions experienced in the real world usage of the vehicle. These driving cycles are developed to quantify the fuel consumption and greenhouse gas emissions for different driving conditions. The typical driving cycles developed for the US are FTP-72 or Federal urban driving cycle (FUDS), FTP-75, US06, SC03, NYCC, and HWFET. Among these driving cycles the FUDS and US06 driving cycles are used to simulate driving in different routes. The FUDS represents driving on an urban route while US06 represents a more aggressive highway driving. Using these various cycles the fuel consumption and the greenhouse gas emissions can be measured for various types of trips. These driving cycles represent certain energy demand at the wheel. Thus it gives energy demanded from the primary source on the vehicle.
There are several different types of electric vehicles based on the primary and the secondary source on the power. In a purely EV the primary and the only source of energy is a battery. The battery operates in the charge-depleting mode and can only be charged by plugging into an external power source. Hybrid vehicles have two or more sources of power that are directly or indirectly coupled with the drive train. The primary source in hybrid vehicles is usually internal combustion engines (ICE) and the secondary source is the battery. In HEV the primary source is the ICE and the secondary battery source is used intermittently and is used in the charge-depleting and then charge-sustaining mode and the control strategy determines the range of operation of the battery. The PHEV combines the advantages of the EV and HEV. The battery can be used over a larger range and it can be charged directly by plugging into the external power source. The ability to charge the batteries through an external power source adds to the complexity of reproducing the aging cycle of the battery as the external charging would depend on several factors such as users choice of charging time, duration and location. Since the operating currents and the SOC ranges for the battery systems are different in these different types of battery electric vehicles, the performance requirements are also different as discussed in section 1.
A synthetic driving cycle for HEV application was developed by.62 The temperature and the SOC were obtained from the operating condition and the initial charge. The DOD and the C-rates were extracted from the real data. Figure 8a shows the real driving data in HEV application that was used in this study. The real current profile (I) in the actual cycle is normalized with the nominal capacity of the pack (Sc):
![Equation ([3.1])](https://content.cld.iop.org/journals/1945-7111/160/11/A2111/revision1/jes_160_11_A2111eqn5.jpg)
This normalized current profile is shown in Fig. 8b. This current profile is then discretized into 2-C length bins and the histogram is generated as shown in Fig. 8c. The number of bins is chosen to be as small as possible but also to capture the main aging effects. Then using the heuristic design based on the statistical distribution approach a synthetic aging cycle as shown in Fig. 8d, which is easy to implement in the laboratory, is generated.
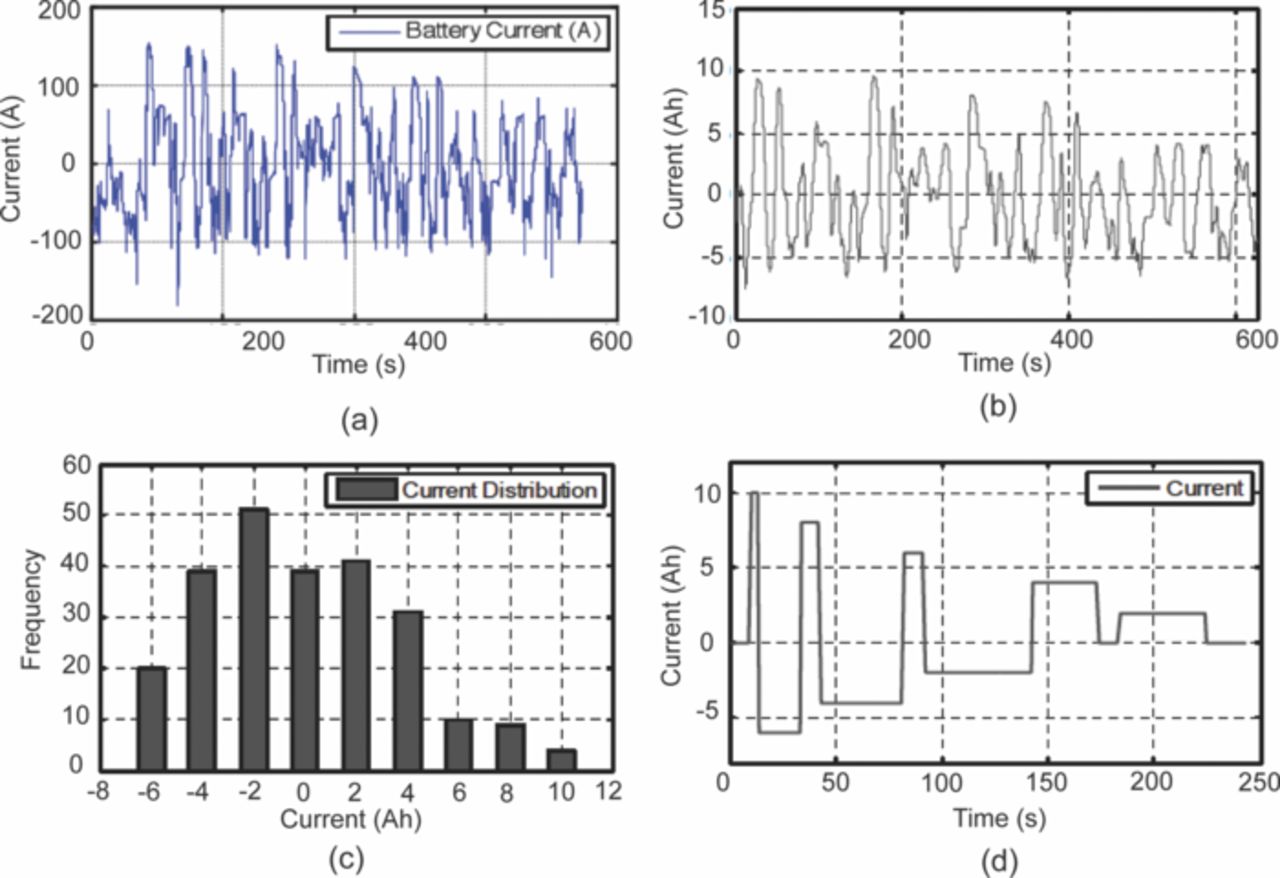
Figure 8. Synthesis of aging cycle from real life driving cycle. (a) Current profile for a battery pack during a real HEV driving cycle. (b) Current profile expressed in the terms of C-rate for a cell during a HEV driving cycle. (c) Current distribution histogram for the cell during a HEV driving cycle. (d) Synthesized current profile designed for aging the cell in the lab. This profile has same current distribution histogram as in (b) (adapted from Spagnol et al.62).
As stated earlier the batteries in EV are operated in charge depleting mode while batteries in the HEV and PHEV are operated in charge sustaining mode. Using this control and the synthetic aging cycle design Marano et al.63 were able to generalize the operating range for the batteries in various EVs. As batteries are the only source of energy in EV they operate at a much lower C-rate and a higher range of SOC. While in HEV the SOC range is smaller but the C-rate is high. PHEV operate within these two extremes with moderate SOC and C-rate. Thus aging cycles in these types of studies are carefully designed based on the vehicle applications. Also as temperature affects the operation of the batteries, it can be included as one of the parameters in the aging cycle.
Nagpure et al.64–69 have demonstrated multi-scale characterization studies on commercial LiFePO4 cells in their various published work. The cells that have been used in these studies were cylindrical cells. Though more recently prismatic cells have been used for electrification of automobile, these cylindrical cells were used in a replacement kit for Toyota Prius. The cells were cycled at a lower SOC and lower C-rate. Commercial lithium ion cells used in these experiments had a graphite anode and a cathode comprised of LiFePO4 nanoparticles (40 nm–50 nm). Graphite is bonded onto a copper substrate, and layers of LiFePO4 nanoparticles are bonded onto an aluminum substrate using a polyvinylidene difluoride (PVDF) binder. The anode and cathode strips, with a separator in between, are rolled and then packed into a can to form a cylindrical cell. The electrolyte used in this cell is a lithium hexafluorophosphate (LiPF6) salt in 1:1 ethylene carbonate and dimethyl carbonate. The cell has an operating voltage of 3.3 V and a nominal discharge capacity of 2.3 Ah. LiFePO4 has poor electronic conductivity (σ = 2 × 10⁹ S cm−1).70 To improve the conductivity, the nanoparticles are coated with carbon.71
Table VI describes the condition of the cells, which were used in their study. The effect of charging or discharging current rate (C-rate) was studied with cells # C1, C3, and C4 cycled from 0% to 10% state of charge (SOC) with a C-rate of 1C, 3C, and 4C, respectively (1C = 2.3 Ah). Two cells were cycled with higher C-rates and at higher SOC to study the effect of the SOC on the lithium concentration profiles. Cell C6 was cycled from 60% to 70% SOC with 6C rate. Cell C16 was cycled with the highest C-rate of 16C from 45% to 55% SOC. All the cells were cycled at 45°C. A cell that underwent only one complete charge-discharge cycle was established as the baseline cell in these studies (C0). The cycling of the cells was terminated when the cells reached ∼80% of their rated capacity. This protocol was found to be consistent with the automotive industry standard, which considers a cell to be dead when its capacity drops below 80% of the original rating.14
Table VI. Aging cycles.
| Sample | Aging Condition | Residual Capacity |
|---|---|---|
| C0 | New- No aging | 100% |
| C1 | 1C, 0–10% SOC, 45°C | ∼80% |
| C3 | 3C, 0–10% SOC, 45°C | ∼80% |
| C4 | 4C, 0–10% SOC, 45°C | ∼80% |
| C6 | ∼6C, 60–70%, SOC 45°C | ∼80% |
| C16 | 16C, 45–55%, SOC 45°C | ∼80% |
SOC - State of charge
The cells were completely discharged after they had reached the ∼80% of their rated capacity. The cylindrical cells, C0, C1, C3, C4, and C6 were opened in a glove box filled with Argon atmosphere. The oxygen level was maintained at ∼88 ppm and the dew point was ∼−34°C. The cell was unrolled, and the long anode and cathode strips were separated. Each electrode strip was then divided into six sections. Section # 1 is near the outer circumference and section # 6 is near the center of the cylindrical cell. Cell, C16 was opened in an ambient environment and the cathode and anode strip was divided into five sections.
Wang et al.,72 has also reported an on-going extensive accelerated cycle life study for graphite-LiFePO4 cells. Their test matrix includes three parameter, C-rate, DOD and temperature. The C-rate values chosen for the tests are C/2, 2C 6C and 10 C with 1C = 2Ah. At each C-rate the DOD values are 90, 80, 50, 20 and 10%. Two cells per C-rate and DOD combination are being cycled at temperatures −30°C, 0°C, 15°C, 25°C, 45°C, and 60°C. They have reported an empirical model for cycle-life based on the cycle life data obtained from these accelerated aging experiments. We will briefly discuss this model in section 7.
Safari and Delacourt73,74 have also used a cycling protocol typical of an EV application. In this profile the cell was first charged to 3.6 V with C/2 rate followed by a 30 min rest period and then discharged with a repeating power profile for 985 s and 10 min rest period in-between till the cell voltage dropped to 3 V. The power profile had 38 charging and 159 discharging peaks of 5 s each resulting in an average C-rate of ∼C/3.
Typical Aging Mechanisms in Li-Ion Batteries
The following is a review of the most commonly observed aging mechanisms across different lithium-ion cell chemistries. It is generally understood that the aging mechanisms causing performance degradation differ significantly for the anode and the cathode, which is the topic of active research. These effects together cause the degradation in performance of the cell. Each aging mechanisms has a varying degree of influence on the overall cell performance and it has been a challenge to isolate the contribution of individual effects on overall performance degradation. However, most capacity fade and impedance rise is attributed to the formation and growth of a solid electrolyte interphase (SEI).
Anode
Solid-electrolyte interphase
A side reaction that causes the decomposition of the reductive electrolyte and consumption of lithium ions takes place between the electrode and the electrolyte surface in the lithium-ion battery systems.30 The decomposition products are deposited on the electrode surface. This deposited layer is termed as a solid electrolyte interphase (SEI). The SEI layer consumes the active lithium, and increases the impedance of the anode causing the capacity and power fade of the cell at the system level. Though SEI can be formed at both the anode and the cathode, it is more prominent at the anode surface due to the low potentials (vs Li/Li+) reached during the charging of the cell that are beyond the electrochemical stability window of most electrolyte solvents. As SEI is composed of the electrolyte decomposition products, it is understood that the chemical composition and properties of the SEI layer are dependent on the anode surface and the electrolyte solvents. Several electrolyte decomposition reactions have been reported in literature.75 Since carbonate solvents are most common for the lithium-ion battery systems there exists several studies related to the reduction reactions and subsequent formation of the SEI layer for solvents such as propylene carbonate (PC), dimethyl carbonate (DMC), and diethyl carbonate (DEC) and ethylene carbonate (EC).74–79
SEI once formed during the initial cycling of the cell is considered to limit the further reduction of the electrolyte and the corrosion of the anode surface. But the SEI layer conversion, stabilization and growth takes place steadily throughout the life of the battery although at a lower rate than at the initial stages.30 The rate of the SEI growth is limited by the kinetics of the decomposition reaction or the diffusion of the solvent molecules through the SEI layer.11 In general the growth of the SEI layer is accelerated at the elevated temperatures and the lower potentials of the anode.
The SEI formation, and growth is generally viewed as the primary reason behind the performance degradation of the lithium-ion cell by causing the capacity fade and the rise in the internal resistance. Several modeling efforts have demonstrated the loss of capacity due the SEI growth during the operation of the cell under various conditions.76,80,81
Lithium plating
Lithium plating i.e. the process of deposition of the lithium metal occurs, at the anode surface as the anode potential crosses the threshold of the 0 V (vs Li/Li+).30,82–84 Apart from consumption of active lithium leading to loss of capacity, the lithium dendrites formed during the plating process can tear through the separator and cause a short circuit and immediate failure of the battery.
The lithium plating in case of the carbonaceous electrodes is caused when the rate of intercalation of the lithium ions into the carbonaceous electrode is too slow and/or the transport of the lithium ions to the electrode surface is very high. At temperatures lower than room temperature the diffusion of the lithium ions into the carbonaceous electrode is slow requiring a higher overpotential to maintain the given net current, and thus causing the lithium plating at the surface. Fang et al.,85 have demonstrated the temperature dependence of the overpotential in the negative electrode. Furthermore the lithium plating can also occur due to debalancing of the cell (e.g., excess of cathode material),86 geometric misfits30 and local polarization of the electrode.11,30,87,88
Cathode
Structural changes and mechanical stress
Lithiation and delithiation of the host structure during each cycle of the cell causes the molar volume change of the host structure. This volume change in the crystal structure leads to the structural changes of the anode and cathode. Such a structural change affects the performance of the cathode more than the regular carbonaceous type anode. The structural changes can induce mechanical stresses and strains in the nanoparticles of the active cathode material, which subsequently act on the composite cathode structure.30
During the lithiation and delithiation process some cathode oxides also undergo phase change. This phase change can cause the distortion of the crystal lattice further inducing mechanical stresses.30 The misfit strains at the phase boundaries lead to discontinuities causing the cracking of the nanoparticles.30 There have been several modeling efforts to understand the crack formation and propagation due to the mechanical stresses and strains in the cathode nanoparticles.89–96
Dissolution of active material
Aging due to dissolution of active material is mostly observed in the Mn based cathode material. Though it has been reported in Mn layered oxide and olivine structured cathode materials, it is most serious in the spinel structured Mn cathode, especially at elevated charged states and temperatures.30,97–108 The dissolution reactions proceeds as:
![Equation ([4.1])](https://content.cld.iop.org/journals/1945-7111/160/11/A2111/revision1/jes_160_11_A2111eqn6.jpg)
The divalent manganese ions dissolve in the electrolyte while the tetravalent manganese ions remain in the solid structure. The dissolution of Mn in the electrolyte has two-fold effect on the aging of the cell. First, the dissolution of Mn leads to capacity fade associated with the loss of active material. Second, the dissolved Mn ions migrate to the negative electrode and are deposited on the surface of the electrode and/or incorporated in the SEI. This enhances the electrolyte decomposition process causing the loss of charge in the lithiated carbonaceous anode.109,110 Vetter et al.,30 also mention the precipitation of Mn species such as MnF2, MnCO3 and various oxides on the cathode surface increasing the impedance of the electrode.
So far, only Park et al.111 and Cai et al.112 have modeled the dissolution process, but these studies accounted only for the loss of the active volume and neglected the effect of the dissolved Mn ions on the negative electrode. As interest in mixed electrodes containing Mn increases, more efforts to understand the effect of the Mn dissolution on the aging process will be needed.34–40
Multi-Scale Characterization of Cathode - Physical and Morphological
In this section the various techniques used to characterize the physical and morphological structure of the aged cathode materials are discussed. Physical and morphological studies will reveal any damage to the LiFePO4 cathode during the aging process. The characterization of evolution of main design parameters such as porosity, and particle size are discussed in this section. Thermography is used to scan the long cathode strips for any physical damage and bridge the gap between the millimeter to micro-nanometer length scales. The porosity analysis has been done with X-ray micro-computed tomography and finally the aging effect on particle size is analyzed down to its fundamental length scale.
Physical damage
Physical damage to the composite cathode structure can cause degradation in its performance. Stresses due to the packaging of the cell, cycling of the cell during operation, and heat generation can lead to physical damage such as delamination of the active material from the current collector. The areas with physical damage will be sources of inhomogeneities within the cell and lead to rapid degradation in performance.
Also, as discussed earlier one cannot randomly pick an area on the long cathode strip and hope to see the effects of the aging mechanisms on the LiFePO4 nanoparticles. Exhaustive search over the entire electrode strip will be physically impossible with available microscopic characterization techniques.
The physical damage of the long cathode strip can be analyzed with an imaging technique such as Thermography and Optical microscopy.
Thermography (mm)
Thermography is used to measure the variations in temperatures through thermal imaging of the object. Here thermography by flash method is used as the first step in the multi-scale characterization of the LiFePO4 cathode material. The flash method, which was introduced by Parker et al.,113 has been used extensively in the measurement of thermal characteristics such as thermal diffusivity, and thermal conductivity of various different kinds of materials. In this simple technique the front face of the sample with slab geometry receives a pulse of radiant energy coming from a laser or a flash lamp. The temperature rise of the opposite face is captured through high resolution, high frequency thermal imaging by an infrared (IR) camera. The average temperature rise in the sample is only few degrees above the initial value. This temperature rise curve is used for thermal characterization of the samples.114,115
Several authors have successfully applied this technique for several different materials. Lafond-Huot and Bransier,116 Luc and Balageas,117 Philippi et al.,118 Degiovanni et al.,119 and Krapez120 used it to study anisotropic materials. Batsale et al.121 and Ramond et al.122,123 used it to study complex heterogeneous media. Moyne et al.124,125 and Azizi et al.126 studied porous materials. André and Degiovanni,127 Hahn et al.,128 and Lazard et al.129 applied it to study semi-transparent materials. Coquard and Panel130 used it to study liquids or pasty materials. There are also several reviews published about the theoretical and practical applications of this technique by Righini and Cezairliyan,131 Degiovanni,132 Taylor,133 Balageas,134 Taylor and Maglić,135 Maglić and Taylor,136 Sheindlin et al.,137 Baba and Ono,138 and Vozár and Hohenauer.115,139
As large areas can be easily scanned with this technique, it becomes an ideal choice to scan the long cathode strips for any physical and/or morphological damages. Nagpure et al.65 have demonstrated the application of this technique in battery research by capturing 2D thermographs of the cathode strips harvested from unaged and aged commercial cells. The setup to capture the thermal maps of the samples is discussed in ASTM 1461 92 standard140 and is shown in Fig. 9. The main features of this setup are the flash lamp, sample mount, high-resolution IR camera, and data acquisition system. The high energy pulse required in this experiment was generated by Profoto, Acute 2, flash lamp with a 2400 W-s capacity. The flash lamp was operated to deliver a finite pulse of energy at 300 W-s. The sample mount was a custom made hollow box with a square slot of approximately 63.5 mm × 63.5 mm on one face. The flash lamp was centered over this slot. A circular hole of approximately 90 mm was cut on the opposite face. The IR camera lens was inserted through this hole and focused on the sample. The thermal maps were taken with an IR camera from Indigo Systems, Phoenix Mid-wave IR Camera, with a 320 × 256 pixel resolution and InSb focal plane array. The frequency of the camera is set at 346 Hz. The data acquisition system was built into the IR camera equipment.
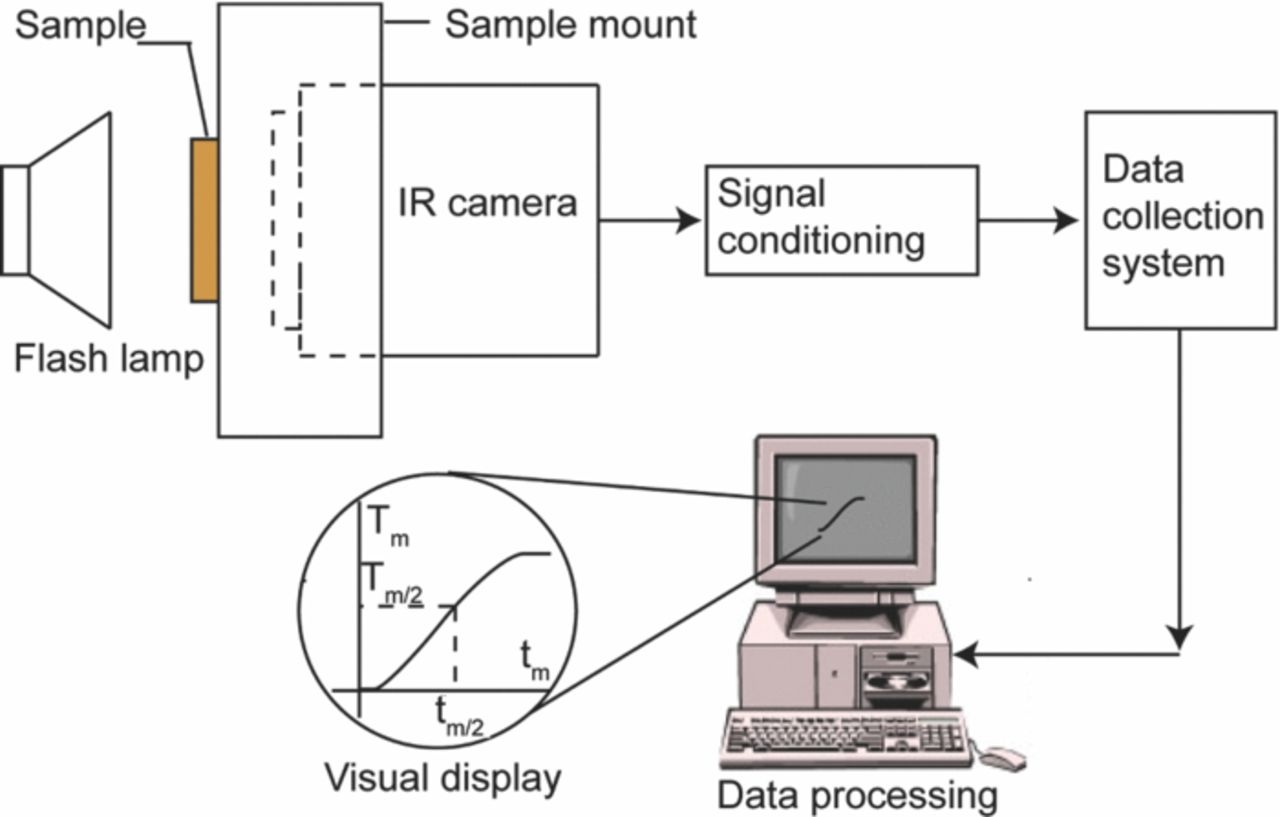
The long cathode strip was divided into five equally spaced sections each ∼65 mm (2.5 in) wide. The sample was mounted flushed on the face with the square slot on the sample mount. The center of the flash lamp coincides approximately with the center of the sample so that the heat pulse is uniformly incident on the sample. The IR camera lens was focused on the opposite face of the sample with the center of the lens aligned approximately with the center of the sample. The finite heat pulse from the flash lamp was incident on the front face of the sample. The heat gained by the sample from this pulse is conducted through its thickness to the rear face. As such the rear face of the sample is heated and its temperature increases. The IR camera captures this heat gained by the rear face at a frequency of 346 frames per second. The experimental setup was under ambient conditions and as such all the thermal maps were obtained under ambient conditions.
The thermal maps of the aged and unaged sample for all five sections (Fig. 10a), shown in Fig. 10, were taken when the temperature of the rear face of the sample reached the maximum value. In these thermal maps the dark spots represent the cold areas while the bright spots represent the hot areas. The dark spots are more prominent in the aged sample (right side) as compared to the unaged sample (left side).
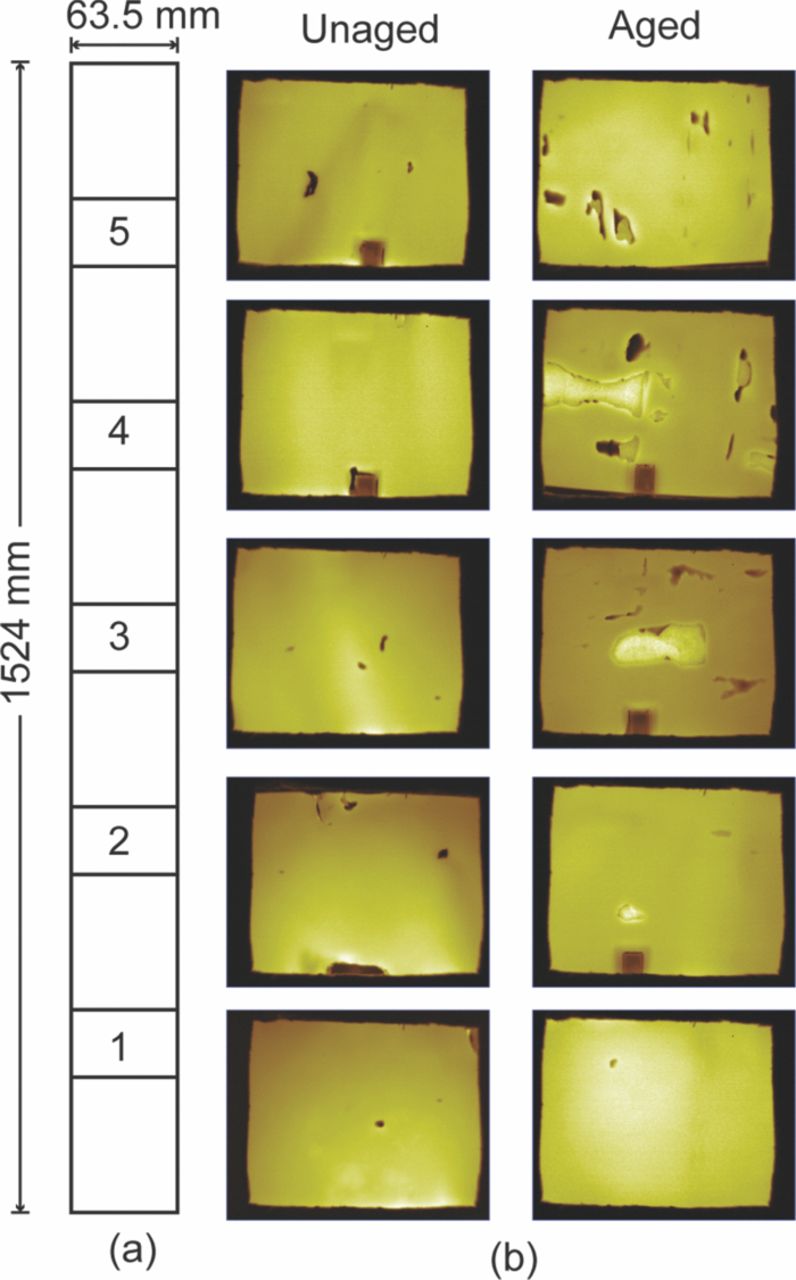
Figure 10. (a) Sectioning of the cathode for the thermal imaging. Section # 1 is near the core of the cylinder and section # 5 is near the out edge of the cylinder. (b) Thermal maps of unaged and aged cathode samples for all five sections.65
The dark spots are mostly in areas where the spalling of the cathode material from the current collector was observed. The spalling could be attributed to the disbonding, cracking or buildup of residual stress and strain between the current collector and the cathode material interface. The spalling could also be attributed to the shocks and vibrations during disassembling of cells and/or handling of the long cathode strip. Thus the reason for spalling could not be conclusively attributed to any specific damage mechanism. Since spalling was a result or effect of certain underlying damage mechanism the aging studies were focused on areas without any visible damage.
Thermal diffusivity was used as a damage metric in the areas without any visible damage (no spalling). Figure 11a shows the temperature rise of the rear face of the sample in terms of IR counts. The temperature rise shown here is for section # 4 of the aged and the unaged cathode samples shown in Fig. 11b. An area with a uniform IR intensity was randomly chosen in the thermal map of the aged and unaged sample for thermal diffusivity analyzes. The IR counts are obtained over this area from the instant the heat pulse was incident on the sample until the temperature of the sample reaches a steady state value. A baseline temperature was identified in these plots as the temperature just before the pulse is incident on the sample (Tini). Then the maximum temperature was measured as the steady state temperature of the rear face of the sample (Tmax). The half rise time (t1/2), i.e. the time required from the initiation of the pulse on the front face of the sample to the time at which the temperature of the rear face of the sample reached half the difference between Tini and Tmax, was calculated. The thermal diffusivity for the sample was then calculated using the following formula:140
![Equation ([5.1])](https://content.cld.iop.org/journals/1945-7111/160/11/A2111/revision1/jes_160_11_A2111eqn7.jpg)
where α is the thermal diffusivity (m/s), L is the thickness of the sample (m), and t1/2 is the half rise time (s). It is important to note that the Eq. 5.1 is not dependent on the absolute value of Tmax. Therefore, the observed differences in maximum IR counts between aged and unaged samples as seen in Fig. 11a are not important in these analyzes.
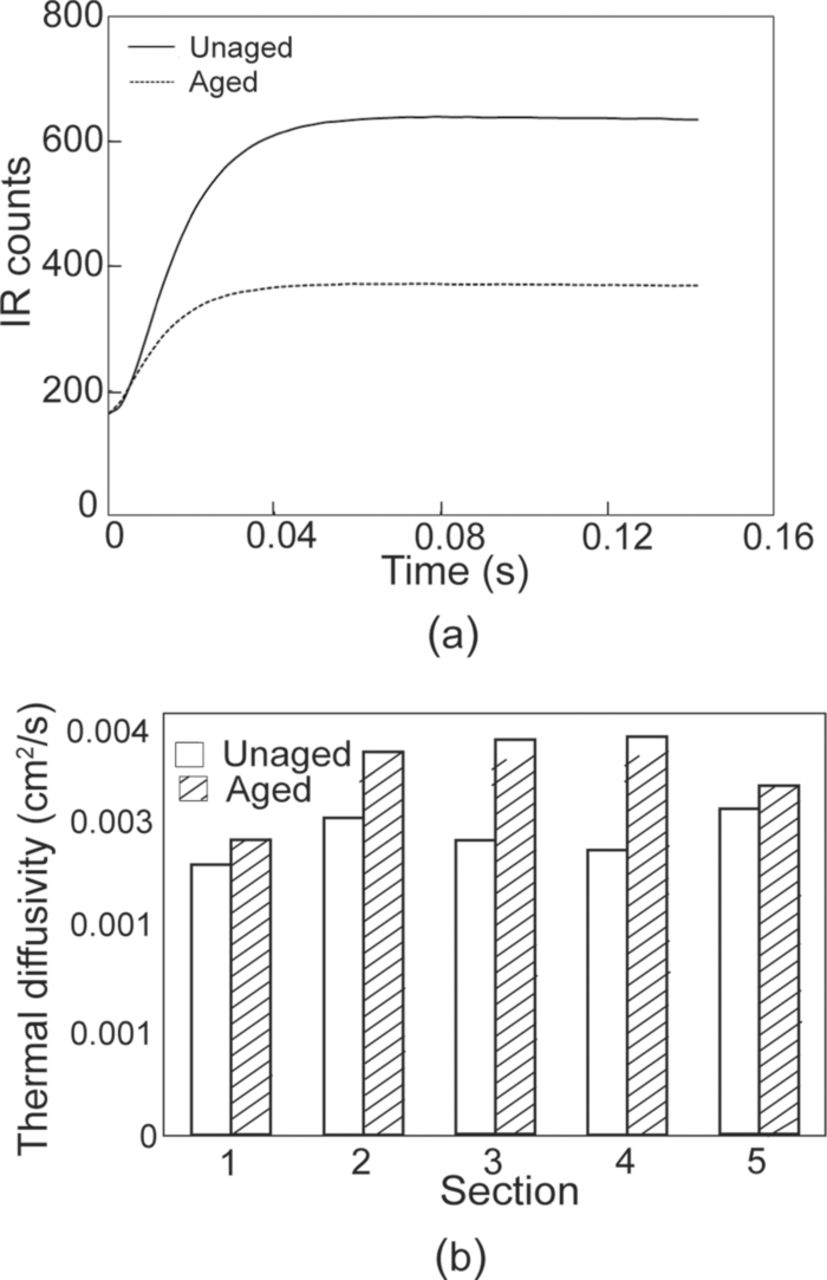
Figure 11. (a) Temperature rise curves for unaged and aged samples (section # 4). (b) Comparison of thermal diffusivity between unaged and aged samples.65
Figure 11b shows a comparison of the thermal diffusivity between the unaged and the aged sample over all 5 sections. As can be seen in this figure the thermal diffusivity of the aged sample was more than the unaged sample in all 5 sections. This indicates that the rate of heat conduction in aged samples is higher than the unaged sample, which can be attributed to the change in the porosity of the cathode material. The differences in the thermal diffusivity values between aged and unaged samples are significantly less in sections 1 and 5. These sections are near the core of the cylinder and near the outer edge of the cylinder, respectively. The differences in the thermal diffusivity are more prominent in sections 2, 3, and 4 of the samples. Nagpure et al.65 believed that the different rate of change in the porosity in various sections leads to the non-uniform change in the thermal diffusivity across the sections.
Theoretically, thermal diffusivity is given as the ratio of the thermal conductivity to volumetric heat capacity as follows:
![Equation ([5.2])](https://content.cld.iop.org/journals/1945-7111/160/11/A2111/revision1/jes_160_11_A2111eqn8.jpg)
where α is the thermal diffusivity (m2/s), k is the thermal conductivity (W/m-K), and ρCp is the volumetric heat capacity (J/m3K). The Eq. 5.2 is strictly applicable only to monolithic material. Since, the cathode material is a composite, Nagpure et al.65 associated the increase in thermal diffusivity with a change in k, ρ and/or Cp.
Figure 12 shows the schematic of a proposed mechanism explaining the increase in the thermal diffusivity of a LiFePO4 cathode due to aging.65 As a first order approximation the cathode can be considered as a porous medium. Also, it can be assumed here that the heat diffuses through the cathode only due to conduction. As the cathode ages the nanoparticles tend to coarsen by sintering. Due to this sintering of the nanoparticles, the effective surface area per unit volume decreases,141 with an associated decrease in the porosity of the cathode. The decrease in the porosity can also expose a larger area of the aluminum current collector. Since aluminum has high thermal diffusivity (8.418 × 10⁻⁵ m2s−1), the overall thermal diffusivity of the aged sample may show an apparent increase.142–144 It is interesting to note that the sintering of oxide particles takes place at high temperatures. The onset of sintering in the cathode material may be attributed to the high surface energy of the LiFePO4 nanoparticles Zhang and Miser145 has observed coalescence of oxide particles with no external heating. In general, as the porosity of the medium decreases, the thermal conductivity increases, and hence, the aged sample shows increase in thermal diffusivity.146,147
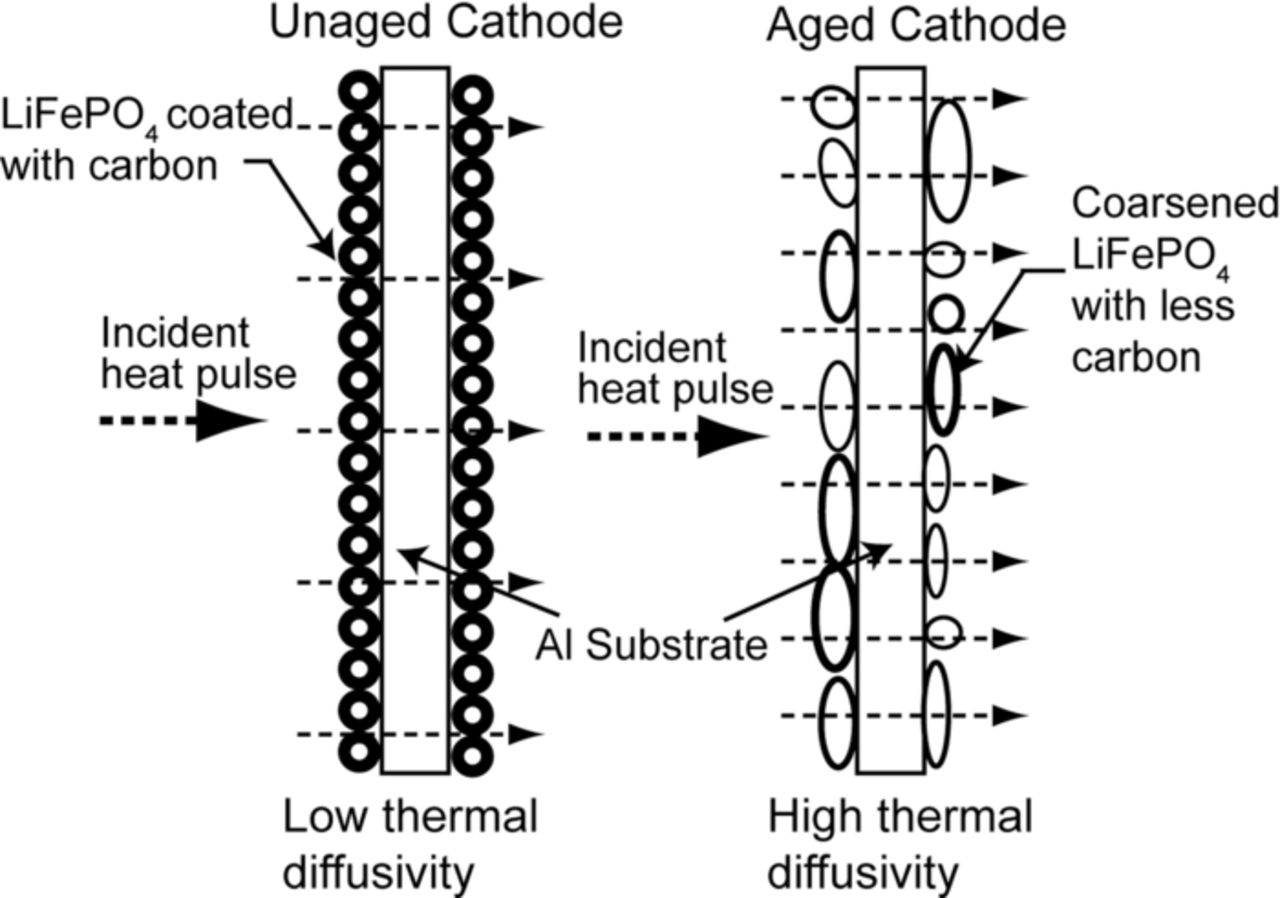
Figure 12. Schematic of a proposed mechanism explaining increase in the thermal diffusivity of a LiFePO4 cathode due to aging.65
In summary thermography bridges the gap between different length scales and proves to be an effective technique to relate the damage mechanisms of the cathode at mm length scale to micro/nanoscale. The thermal diffusivity increases as the cathode ages during the cycling of the batteries. The increase in the thermal diffusivity was attributed to the decreased porosity of the cathode samples due to the coarsening of the LiFePO4 nanoparticles. The 2D thermal maps and the thermal diffusivity calculations help in making samples for further micro/nano level characterization studies.
Digital microscopy (microns)
Advances in the lens design and manufacturing has helped the development of the high-resolution optical microscope. Issues such as optical aberrations, and blurring of the images have been overcome in modern optical microscopes. Coupled with these advances, the advances in digital imaging have led to the development of the digital microscope. In digital microscopes the eyepiece of an optical microscope is replaced with a charged coupled device camera. Digital microscopes provide added advantages of precise computer control and greater flexibility in image analysis and processing. They have been used regularly in the fields of biological sciences, nanotechnology, as well as material science and metallography. They are very useful in imaging the texture of samples for metallographic analysis.
Digital microscopy has not been used as widely as other techniques in the study of battery materials. Figure 13 shows the digital micrographs of the unaged and aged anode and cathode taken along the cross-section (thickness) of the electrode strips. They are very useful in understanding the basic construction and layout of the electrode strips. In Fig. 13a the middle vertical region represents the copper current collector. The graphite coating is seen on either side of this current collector. Similarly, in the case of Fig. 13b the middle shiny vertical region in the images is the aluminum current collector. The active material (LiFePO4) is coated on either side of this current collector substrate. Due to the dense packing of the active material the nanoparticles structure is not visible at the resolution available in these images. The edges of the current collector have been smeared off and the coating of the active material is not uniform on either side in the case of the aged sample. Using the digital image processing technique on these micrographs the thickness of the current collector and the coatings on each side is measured as ∼10 μm and ∼75 μm respectively. This data is a very useful input to the battery performance electrochemical models.148
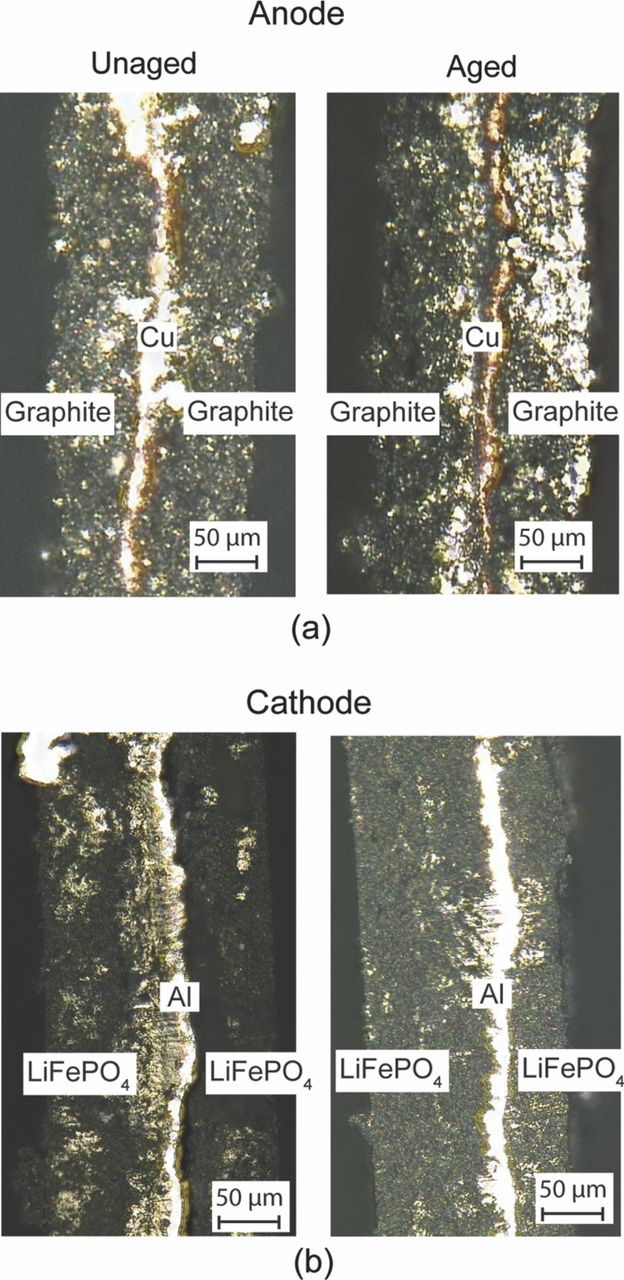
Figure 13. (a) Digital micrographs of unaged and aged graphitic anode across the thickness. (b) Analogous images of LiFePO4 cathode.
When lithium intercalates into the graphite anode it changes color, and this behavior has been used to characterize the graphite anode with optical microscopy. Maire et al.149 have used calorimetery in combination with optical microscopy to determine the local state of charge and lithium distribution with the anodes of the Li-ion cell. Harris et al.83 have used optical microscopy to study lithium transport in the anodes and have suggested that the transport phenomena could be controlled by liquid-phase diffusion. Qi and Harris150 have used optical microscopy to study the strains in the graphite anode during the lithiation process and explained the stiffening of the graphite upon lithiation.
In summary, digital microscopy contributes very little toward identifying the degradation mechanisms of the cathode material. It is unclear if the uneven active material coating thickness is a manufacturing defect or an aging effect. Nonetheless these studies provide important information about the physical dimension of the cathode and anode, which are useful in the electrochemical modeling of the battery performance.
Porosity analysis
The cathode is a porous structure to assist the percolation of electrolyte and to increase the surface area for the electrochemical processes. The change in porosity during the cycling of the battery can disrupt the ionic and electronic conductivity of the cathode structure. The change in porosity leads to change in the interface carbon coated nanoparticles and the electrolyte percolating through the pores of the composite cathode affecting lithium intercalation efficiency during cycling. Hence, characterizing and quantifying porosity becomes important in understanding battery performance and to improve the design of large format cells.
X-Ray tomography has been used to characterize battery graphite anodes of Lithium cobalt oxide batteries harvested from a Lishen 18650 cylindrical cell151 to study pore size distribution, pore interconnectivity and tortuosity. Channagiri et al.152 have used X-ray micro computed tomography (X-ray microCT) to characterize the evolution of porosity with aging in large format cells. Since the pores are in the nanometer to micrometer range and beyond the resolution of their X-ray microCT instrument they have used an indirect method to calculate the porosity within the samples. Grayscale values for each pixel on X-ray micro-CT images are proportional to the linear attenuation coefficient at that point of the object being scanned. The gray scale of the X-ray microCT images were calibrated based on the attenuation coefficient of air and LiFePO4 and FePO4 and the weight fraction of the pores (wP) within the sample was calculated using the following relation
![Equation ([5.3])](https://content.cld.iop.org/journals/1945-7111/160/11/A2111/revision1/jes_160_11_A2111eqn9.jpg)
where GS is the gray scale value in the image, GSL is the gray scale value for LiFePO4 and FePO4 and GSP is gray scale value of air.
In Fig. 14a–14d, the first four plots (a, b, c &d) are normalized integrated histograms representing porosity distribution at location 1 and location 5 for a given aging condition, while plots in Fig. 14e–14f are normalized integrated histograms representing the porosity variation at location 1 and location 5 with different aging conditions. The different porosity in location 1 and location 5 of the new unaged cell indicates the influence of packaging and building of the cell. Such variation can lead to inhomogeneities within the cell causing performance degradation. Channagiri et al.152 have attributed this variation within the new unaged cell to the stresses built during packaging of the cylindrical cell. They have attributed the change in the porosity in cells aged at a higher C-rate to the rapid cyclic volume changes at a higher C-rate that cause loss of contact between cathode nanoparticles and the carbon matrix during the cell aging process.
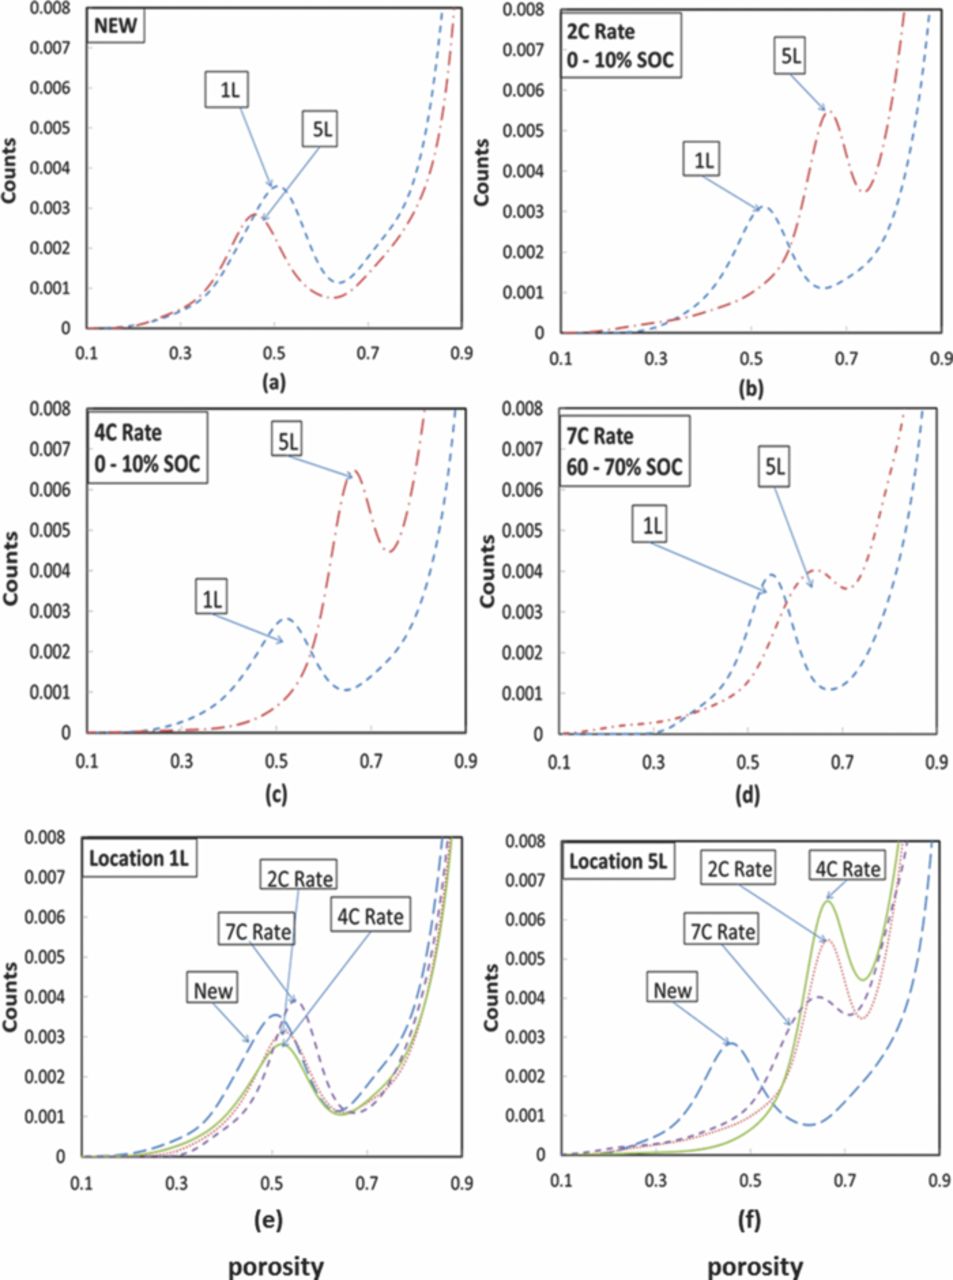
Figure 14. Normalized integrated histograms showing variation in porosity between location 1 and location 5 within a battery sample, demonstrating an increase in porosity away from the center of the battery (except in the unaged battery case) (a) C0, (b) C2, (c) C4 and (d) C7; Normalized integrated histograms showing variation at different locations for the set of batteries (e) location 1 and (f) location 5. No change in porosity is observed at location 1 while the porosity increases at location 5 with aging at different C-rates.152
Particle size
The diffusion length and diffusion time depends on the particle size of the active LiFePO4 cathode samples. Change in the particle size during the aging can cause change in the diffusion kinetics affecting the rate performance of the cell. The particle size has been analyzed using micro and nanographs generated with electron microscopy and scanning probe microscopy.
The samples for the particle size analysis were made using the thermal images obtained in the thermography study. The areas where thermal conductivity changed but no visual damage to the cathode structure was shown are the areas of interest for particle size.
Scanning electron microscopy (SEM) (microns)
SEM is widely used as a non-destructive tool for characterization and analysis of materials. The focused high-energy electron beam incident on the sample generates signals that are analyzed for the morphology. A SEM with electron back scattering detector can also be applied to study the crystal structure, chemical composition, and material orientation. SEM is widely used in lithium ion battery research to produce high magnification images of the nanostructured active materials. It is often used to understand the morphology of the synthesized cathode material and to verify the nanostructure of the material.71 SEM can be used to identify the major physical and or morphological structures in the active materials. Such studies can reveal any particle cracking, particle separation, and particle agglomeration.153
Figure 15 shows the SEM micrographs of the samples harvested from the unaged and aged cells obtained by Nagpure et al.65 The SEM micrographs reveal the coarsening of the nanoparticles in the aged samples as compared to the unaged sample. The particles in the unaged sample are of the order 40–50 nm while in the aged sample the particles are of the order 240–350 nm. As can be seen in the Fig. 15, in commercial batteries the active material is densely packed on the current collector. Thus higher resolution and magnification SEM images would be necessary to analyze the particle size and its distribution on the cathode surface to study the effect of the coarsening on the overall performance characteristics of the battery.
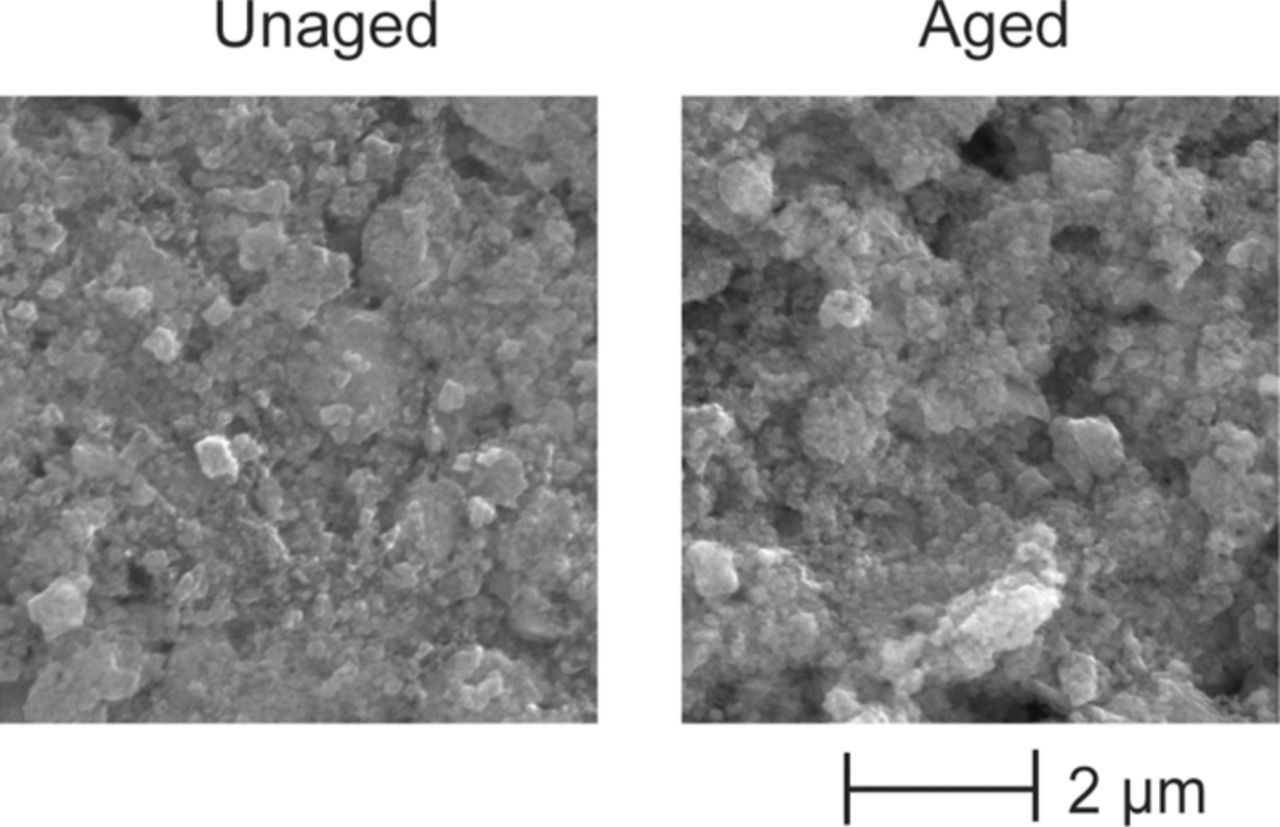
Figure 15. SEM micrographs of unaged and aged LiFePO4 cathode samples extracted from section # 4 [Nagpure et al., 2010].
The coarsening of the particles leads to a decrease in the effective surface area of the particles affecting the rate of the reaction. The change in the particle size would also affect the diffusion kinetics of the lithium ions during charging and discharging cycles. The coarsening phenomenon can also lead to the disbonding of these particles from the aluminum substrate causing physical failure or cracking of the active material and to the increase in the internal resistance due to loss of contact. The coarsening can also lead to the separation of particles, leading to the loss of contact between particles.
Atomic force microscopy (AFM) (μm-nm)
Since its development by Binnig et al.,154 AFM has played a vital role in surface characterization of various different materials such as semiconductors, insulators, bio-materials, etc. A sharp tip at the free end of a flexible cantilever scans the surface of the sample to measure the surface topography of the sample.155
A brief review of the AFM techniques used in Li-ion battery research has been pro- vided by Nagpure and Bhushan.156 This technique provides surface morphology maps of the cathode samples with micron to nm resolution. These maps are useful in studying the grain coarsening phenomena.66,157 Figure 16 shows the AFM surface height image of the LiFePO4 cathode sample harvested from the unaged and aged cells. As can be seen from the images, the LiFePO4 nanoparticles tend to coarsen in the aged samples as compared to the unaged samples. The same phenomenon was observed with SEM micrographs at micron length scales. The AFM surface height images have higher spatial resolution than the SEM micrographs. Hence they might be more useful in statistical quantification of the particle size distribution. Along with this standard measurement, AFM modules are also helpful in measuring surface electrical properties.
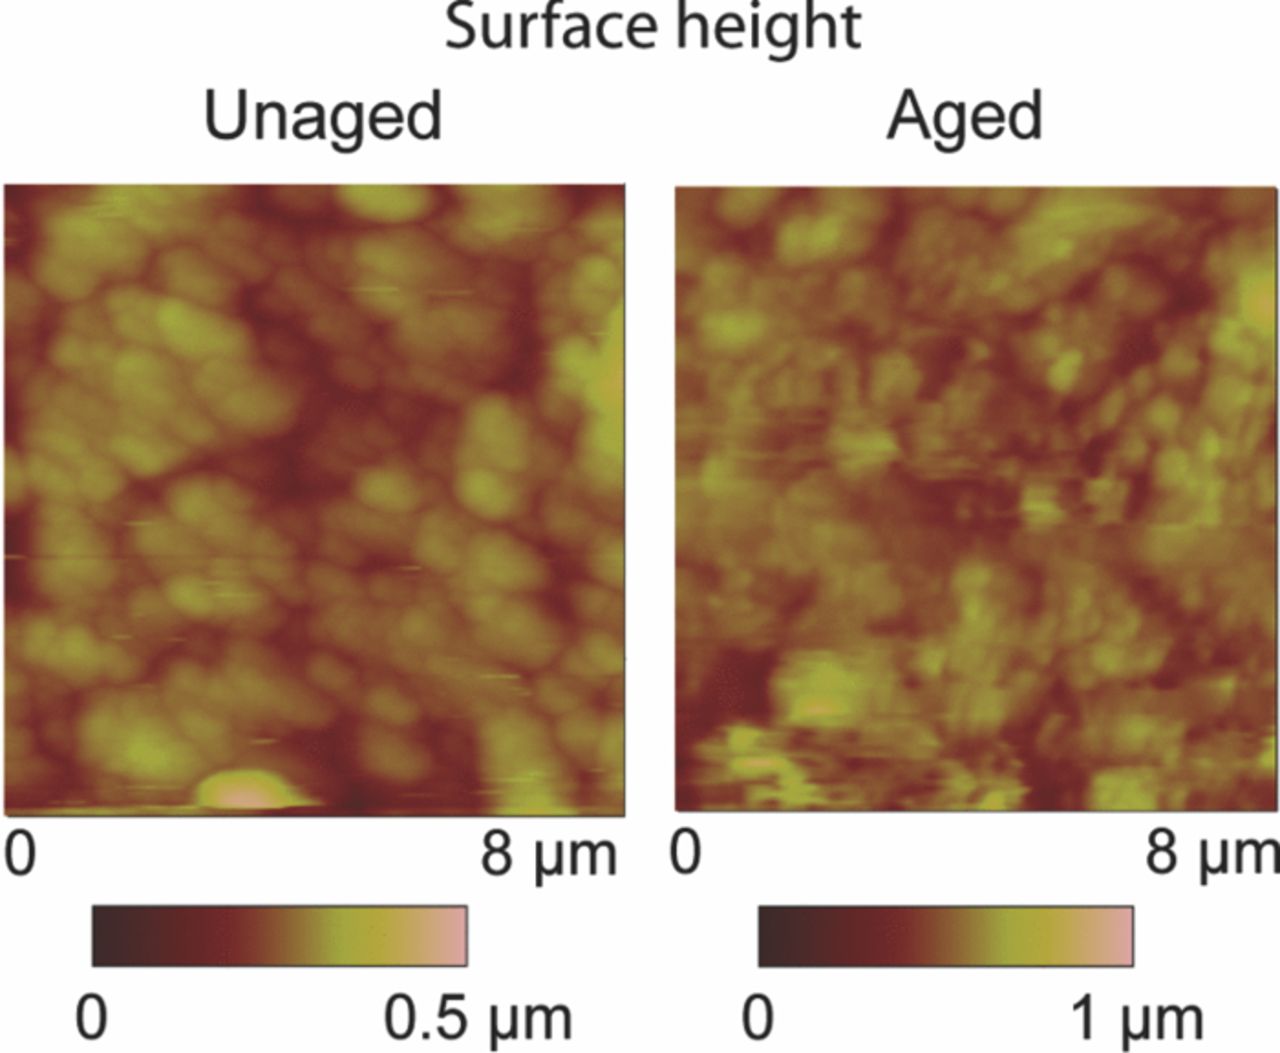
Figure 16. Surface height maps of a LiFePO4 cathode sample harvested from unaged and aged cells (adapted from Nagpure et al.64).
Transmission electron microscopy (TEM) (nm)
TEM is a highly effective and versatile electron microscope technique to image, analyze and characterize the materials at length scales of the order of nanometers.158 Some of the application of TEM in lithium ion battery research has been for studying nanoparticle morphology, and phase change in the nano particles.159–161 In a multi-scale characterization plan TEM is used to provide high-resolution images of the cathode samples for understanding the particle morphology at nanometer length scale.
TEM, though very useful for high-resolution imaging, requires a very careful sample preparation, which should be thin so that they are electron transparent. The TEM samples were prepared on a FEI Helios 600 -Dual beam, focused ion beam system (FIB). The TEM samples were extracted from the surface through the thickness of the sample using lift-out technique. The lift-out technique used here has been discussed in Giannuzzi et al.162 and Giannuzzi and Stevie.163 The steps followed in the lift-out technique used by Nagpure et al.68 are shown in Fig. 17 and briefly discussed here. A clean area is found on the sample and imaged with the ion beam (1). Then Pt is deposited on the surface using a very small current of 2.8 nA (2). The sample is turned by 20deg in one direction, and the area around the Pt deposit is milled away using a milling current of 9.3 nA. A similar step is repeated to mill the area on the other side of the Pt deposit (3). The sample is then turned by 7°, and a trench is cut along the depth of the sample (4) to extract the TEM foil. In step 5 the omniprobe is attached to the foil, and the foil is pulled from the rest of the sample. The foil is then welded onto a TEM Cu grid (GRD-0001.01.01) using Pt (6) and detached from the omniprobe. Finally, the foil is further thinned to approximately ∼200 nm using the ion beam to make it electron transparent.
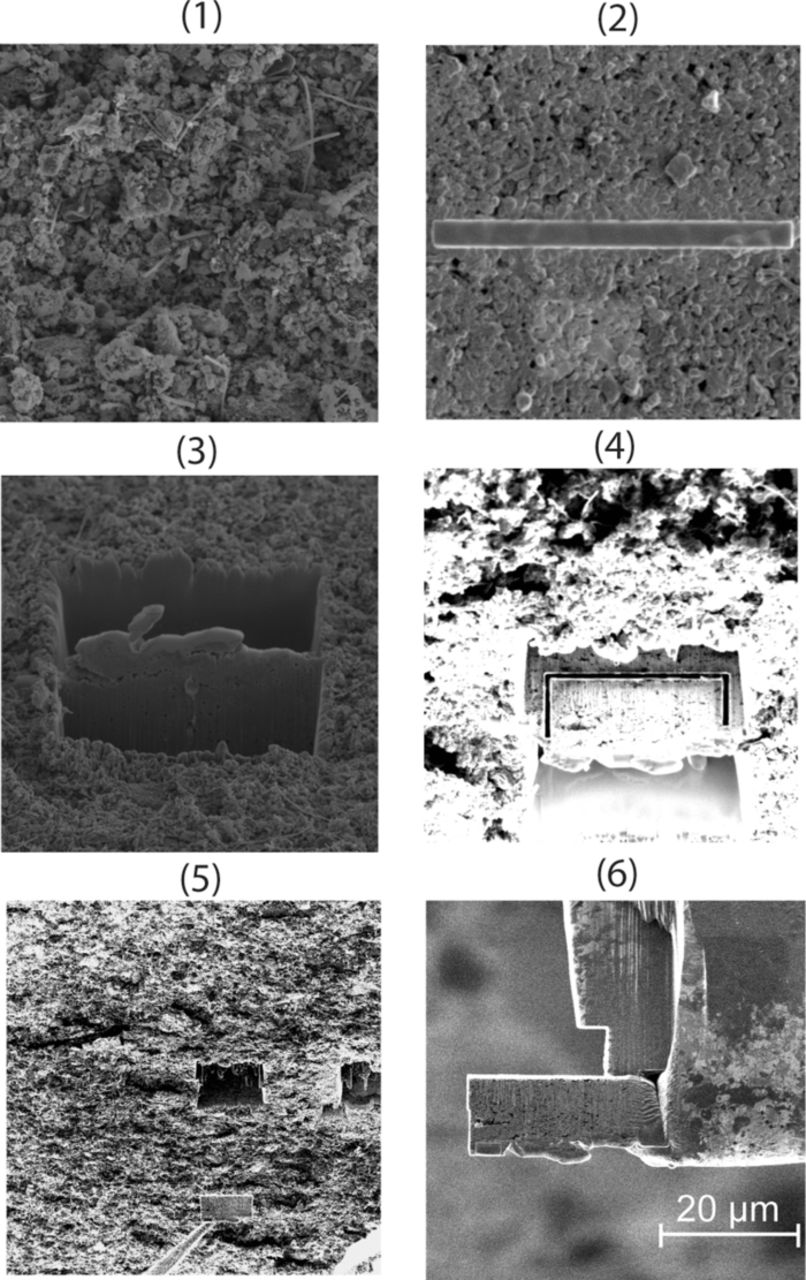
Figure 17. Steps showing TEM sample preparation using FEI Helios 600 dual beam focused ion beam system (FIB).68
Morphologies and nanostructures of the LiFePO4 samples are shown in the TEM images (Fig. 18). They have the same global morphologies. Particles of the aged sample were bigger than the particles of the unaged samples. The samples have several layers of nanoparticles and, as such, contrast exists among the overlapping particles. This makes particle size analysis difficult, but the coarsening phenomenon is clearly visible in Figure 18b. Good statistical analysis of the coarsening and the particle size variation can only be achieved with a more subtle TEM sample extraction process that would allow quantitative measurement of the relative fractions of agglomeration and sintering, without destroying the configurations observed in the Figure 18.
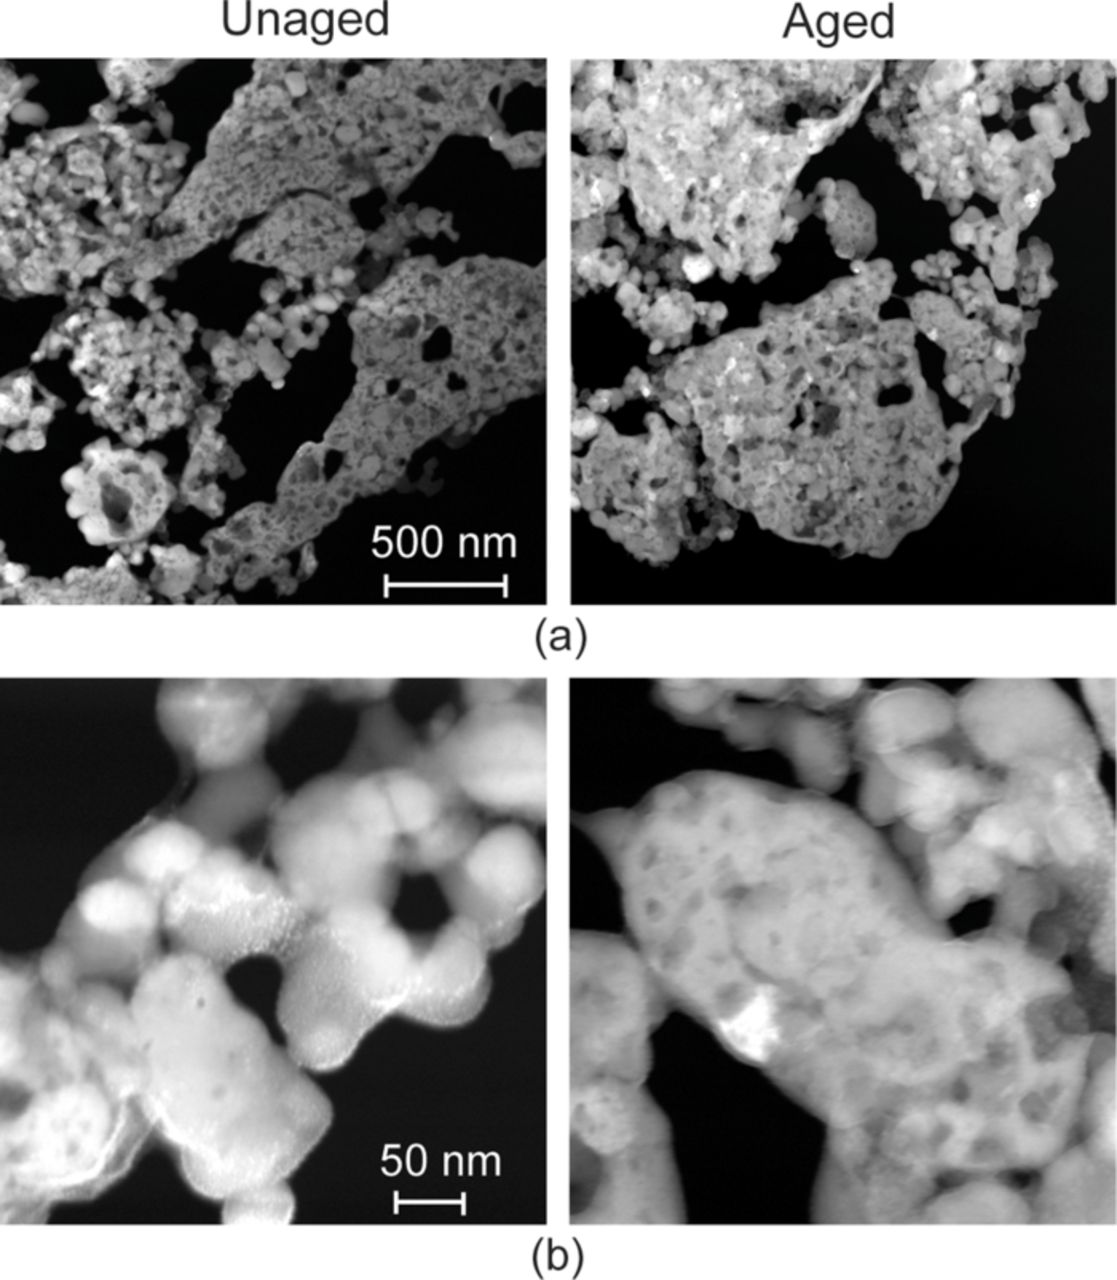
Figure 18. (a) TEM images of unaged and aged LiFePO4 cathode samples at lower magnification (b) TEM images of unaged and aged LiFePO4 cathode samples at higher magnification. The images are from the central area in (a).68
Recently, in situ TEM methodology was developed for studying the processes and aging effects that cannot be captured by ex-situ studies. The critical part of such studies was to operate the LI-ion system inside the ultra-high vacuum column of a TEM. To mitigate this situation, the liquid electrolytes are replaced with either the ceramic or polymer electrolytes to construct an all solid-state "nano-battery". The electrode/electrolyte interface can then be easily probed with TEM. Significant research efforts are underway for developing such in situ TEM techniques to probe the electrochemical behavior of the materials at nanoscale. Some of the earlier work in this area has been published by Brazier et al.,164 Huang et al.,165 Wang et al.,166,167 and Yamamoto et al.168 But these studies were focused on anode materials for lithium batteries. As such authors would leave this up to the reader to investigate it further, but would point out that such a study is also viable and important for the cathode materials within the lithium ion batteries.
Summary
The electrodes within the commercial battery have been characterized by several different techniques for physical and morphological changes with resolutions ranging from mm to nm. Techniques including thermography, SEM, AFM and TEM prove very helpful in characterizing the long cathode strip from mm to nm length scales.
The thermal maps along with the thermal diffusivity measurement bridges the gap between different length scales and proves to be an effective technique to relate the damage mechanisms of the cathode at mm length scale to micro/nanoscale. The samples for micro/nano studies are extracted based on the degradation observed on 2D thermographs. The thermal diffusivity increased as the cathode ages during the cycling of the batteries. The increase in the thermal diffusivity was attributed to the decreased porosity of the cathode samples due to the coarsening of the LiFePO4 nanoparticles.
The physical/morphological studies reveal the main aging effect as the coarsening of the LiFePO4 nanoparticles. A schematic of the coarsening phenomena is shown in Fig. 19. The average particle size increases during aging of the battery. The coarsening of the nanoparticles is visible in the SEM micrographs, AFM surface height images, as well as high-resolution TEM images.
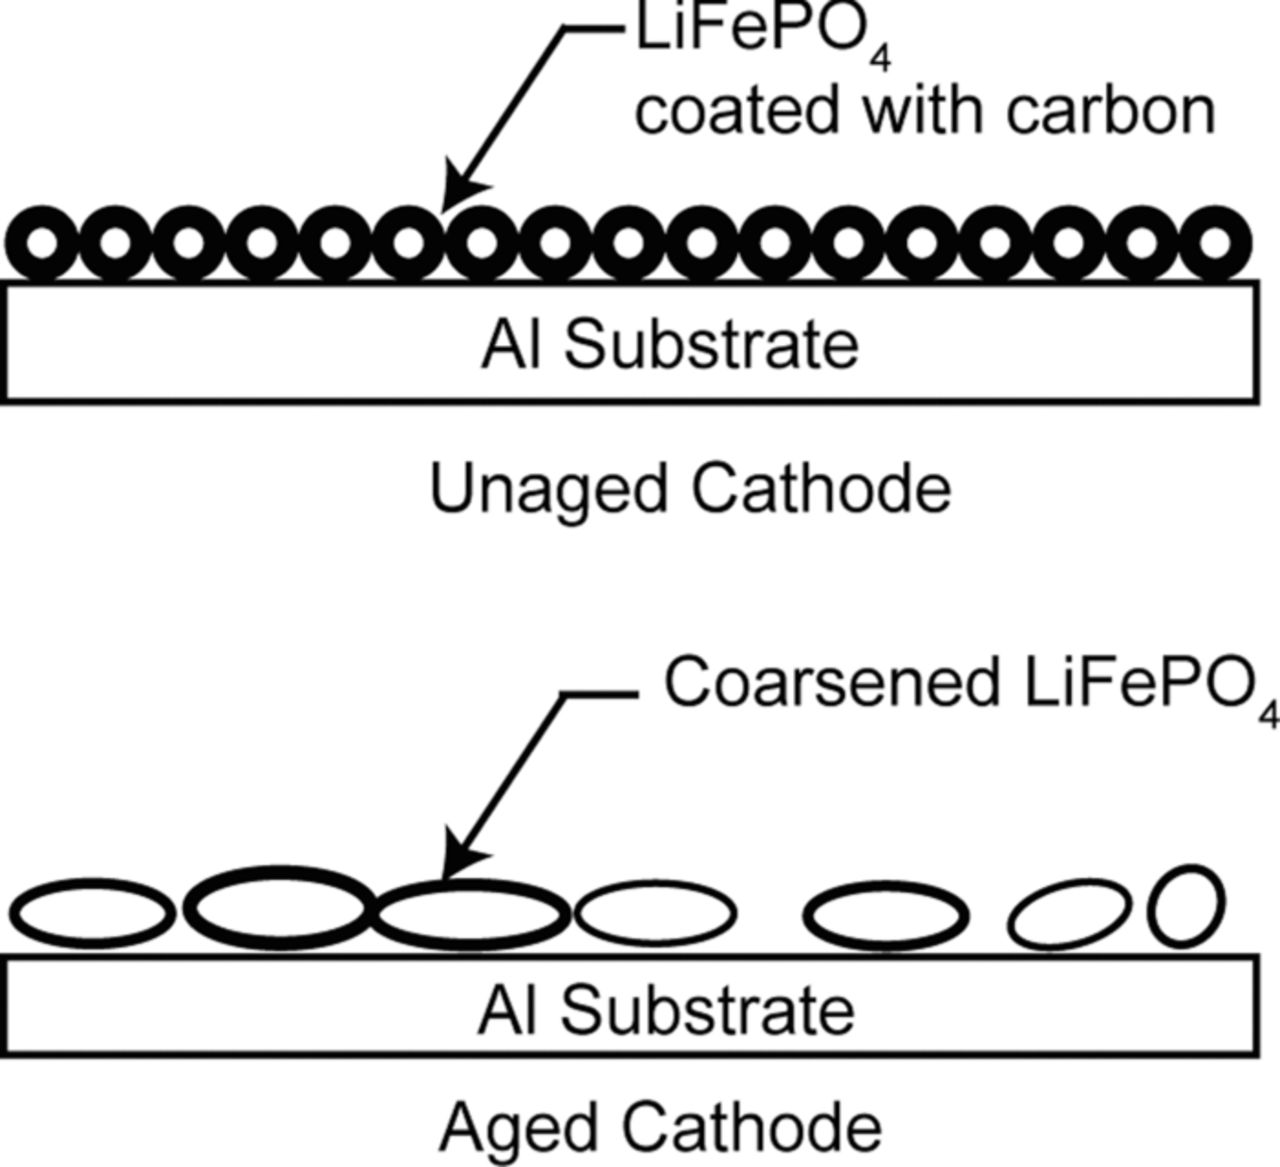
Figure 19. A schematic showing coarsening of the LiFePO4 nanoparticles during aging of the battery (adapted from Nagpure et al.64).
The coarsening has several effects on the performance of the battery. The coarsening of the particles leads to a decrease in the effective surface area of the particles affecting the rate of the reaction. Change in the particle size would also affect the diffusion kinetics of the lithium ions during charging and discharging cycles. The coarsening phenomenon can also lead to the disbonding of these particles from the aluminum substrate, causing physical failure or cracking of the active material and an increase in the internal resistance due to loss of contact. The coarsening can also lead to separation of particles, leading to loss of contact between the particles.
Multi-Scale Characterization of Cathode – Electrical and Electrochemical
In this section the various techniques used to characterize the electrical performance of the aged cathode materials are discussed. The physical/morphological characterization showed the coarsening of the LiFePO4 nanoparticles in the aged cathode samples. The effects of this coarsening phenomenon on the electrical properties of the cathode material are studied through different scanning probe techniques. At the system level the charge/discharge curves and the change in the internal resistance are used as the metrics to characterize the electrical performance of the batteries.
Capacity fade and resistance increase
At the system level the performance of the cell can be directly measured by comparing the capacity and the internal resistance of the cells at beginning of life and the end-of-life. During aging of the cell periodic capacity test are done at low C-rates. The internal resistance increase is the measurement of the power fade due to the aging of cells.
Continuous cycling of a battery leads to capacity fade and to an increase in the internal resistance. The capacity and the internal resistance are used as the metrics for measuring aging at the system level. Figure 20a shows typical discharge curves of a LiFePO4 based Li-ion battery cycled at 16 C-rate between 45 and 55% SOC. As seen in this figure, as the battery ages the knee of the discharge curve is approached much earlier than expected. Thus the total current drawn from the battery is less as compared to the beginning of the life. Similarly, as seen in the Fig. 20b the internal resistance of the battery calculated from the open circuit potential, the loading current and the voltage drop due to the load increases during continuous cycling of the batteries.
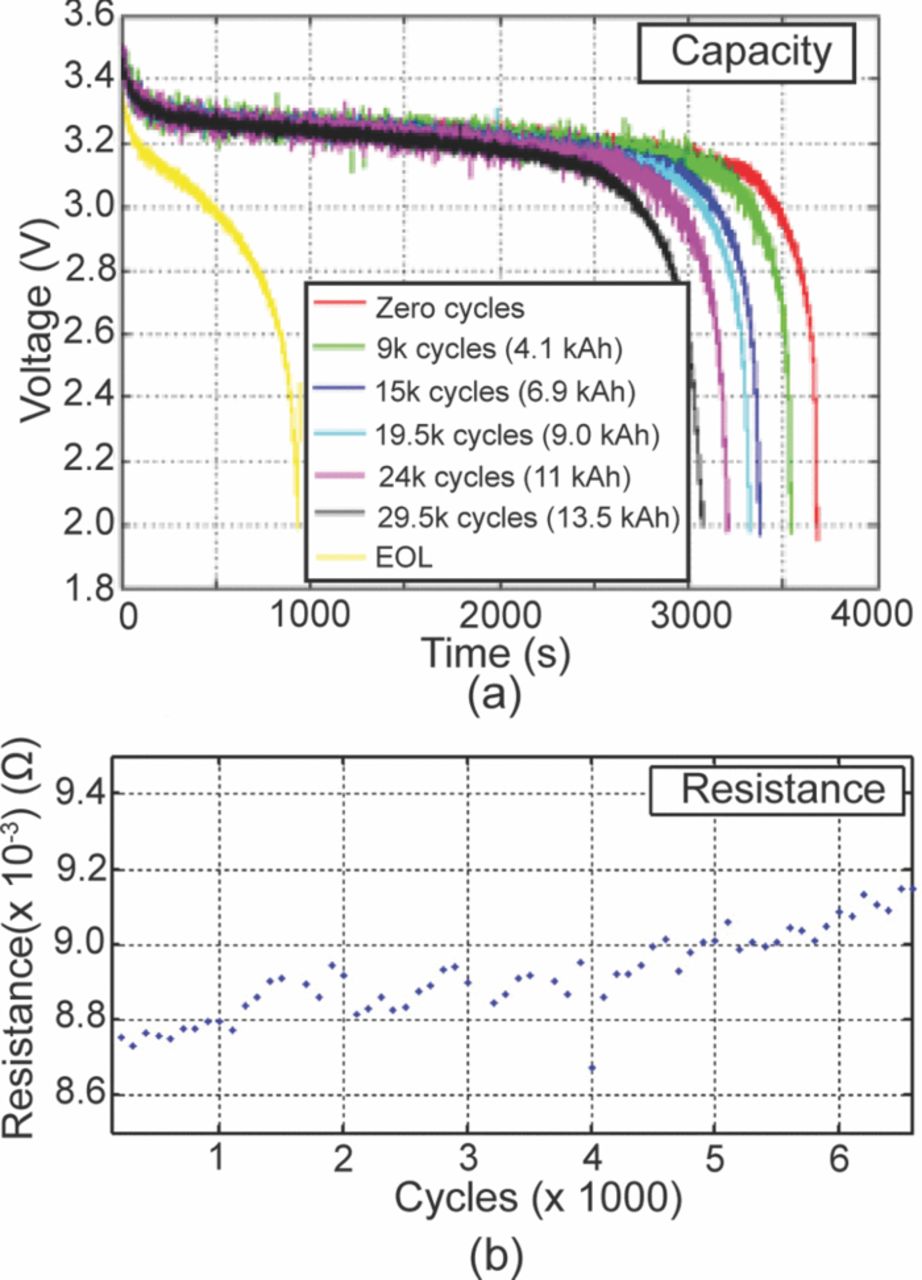
Figure 20. (a) A typical set of discharge curves (voltage versus time) is shown. The knee of the voltage curve is approached faster as the capacity of the cell decreases. (b) Internal resistance increases with aging of the cells.
In Fig. 21 the capacity and the internal resistance of the batteries C3 and C4 are plotted against the cumulative Ah. The cumulative Ah is the total Ah used during charging and discharging of the cell. The data shows the drop in capacity and the increase in the internal resistance during the cycling of the batteries, and thus measures the performance of the batteries according to the system level aging metrics. The drop in the capacity of the C4 battery is at a slightly higher rate as compared to the C3. Also the overall increase in the internal resistance of the C4 battery seems to be higher than the C3. Thus the higher C-rate has a negative effect on the performance of the batteries and the batteries tend to age faster at higher C-rates.
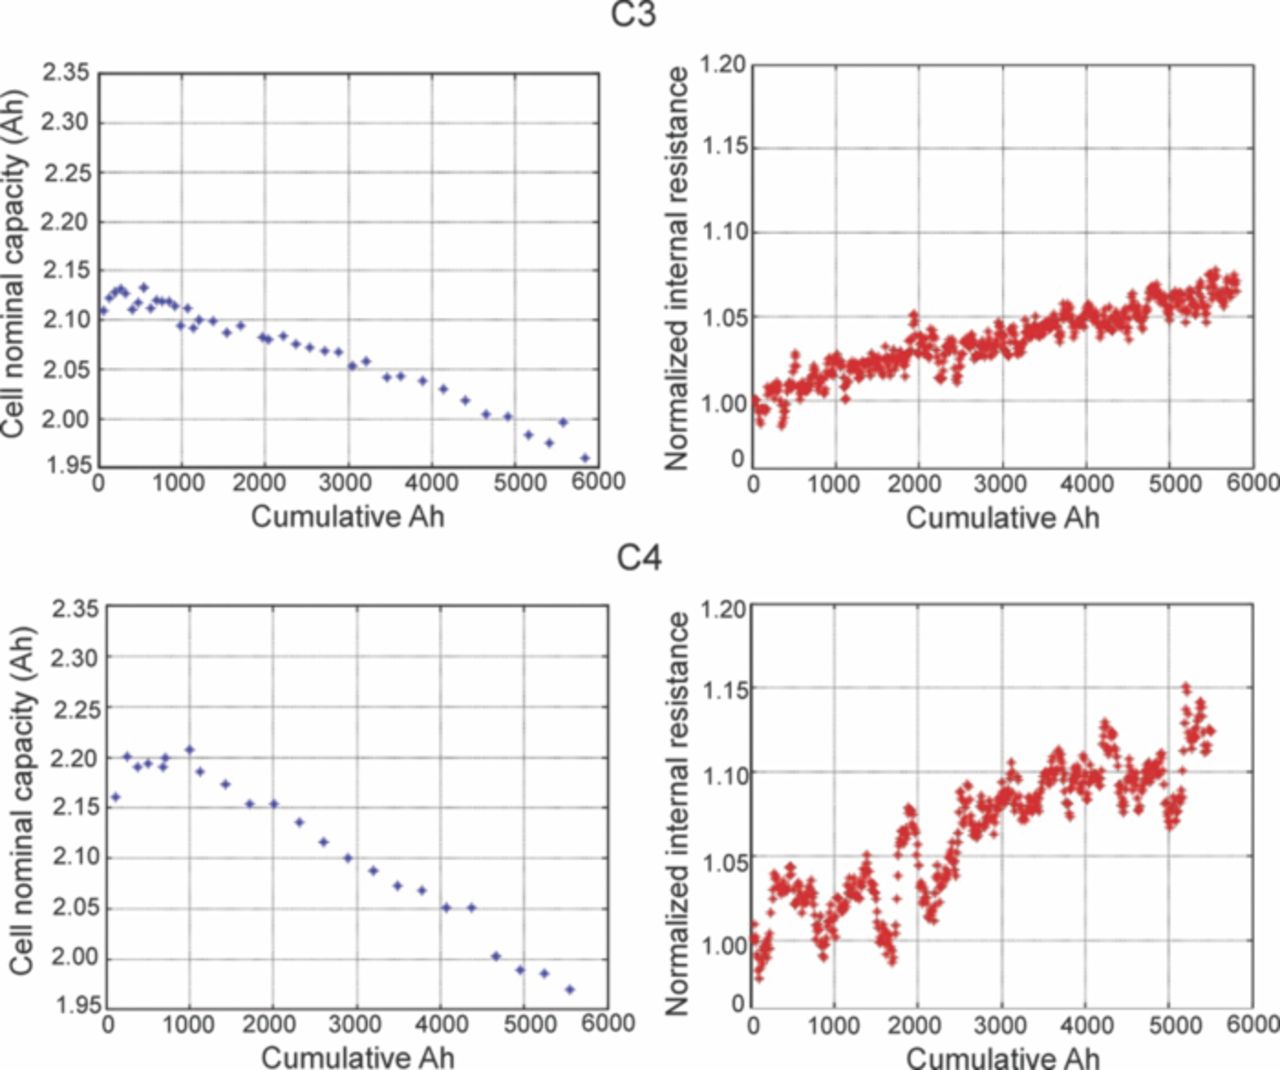
Figure 21. Capacity drop and resistance increase in cells C3 and C4 for multi-scale characterization studies.
Surface electrical properties
Here we summarize the change in the surface electrical properties such as surface resistance, surface conductivity and surface potential measured with scanning probe techniques. They show the effect of aging at the micro-nano meter scale in the composite cathode structure.
Surface resistance
Advances in AFM instrumentation has led to the development of a technique known as scanning spreading resistance microscopy (SSRM).155,169 The SSRM module used in AFM measures the surface resistance between the conductive tip and the sample while the tip is scanned in contact mode across the sample surface. The most important application of the SSRM technique can be found in the mapping of carrier concentration inside a semiconductor device.170 In contrast to SSRM, there also exists a method called current sensing AFM (CSAFM) to measure the surface current between the conductive tip and the sample. This has been previously used in lithium ion battery research. A review of AFM techniques used in electrical characterization of battery materials has been presented by Nagpure and Bhushan.170
The nanoscale surface resistance measurements were taken by Nagpure et al.156 with a Nanoscope IIIa Dimension 3000 AFM equipped with the SSRM application module. The conductive SCM PIT (Veeco Instruments) probes used in this study were coated with platinum-Iridium on front and back side and had a nominal tip radius of 20 nm. A known DC bias voltage of +1 V was applied between the sample and the conductive tip, and the current was monitored using a logarithmic current amplifier built into the SSRM sensor, as shown in the schematic in Fig. 22.
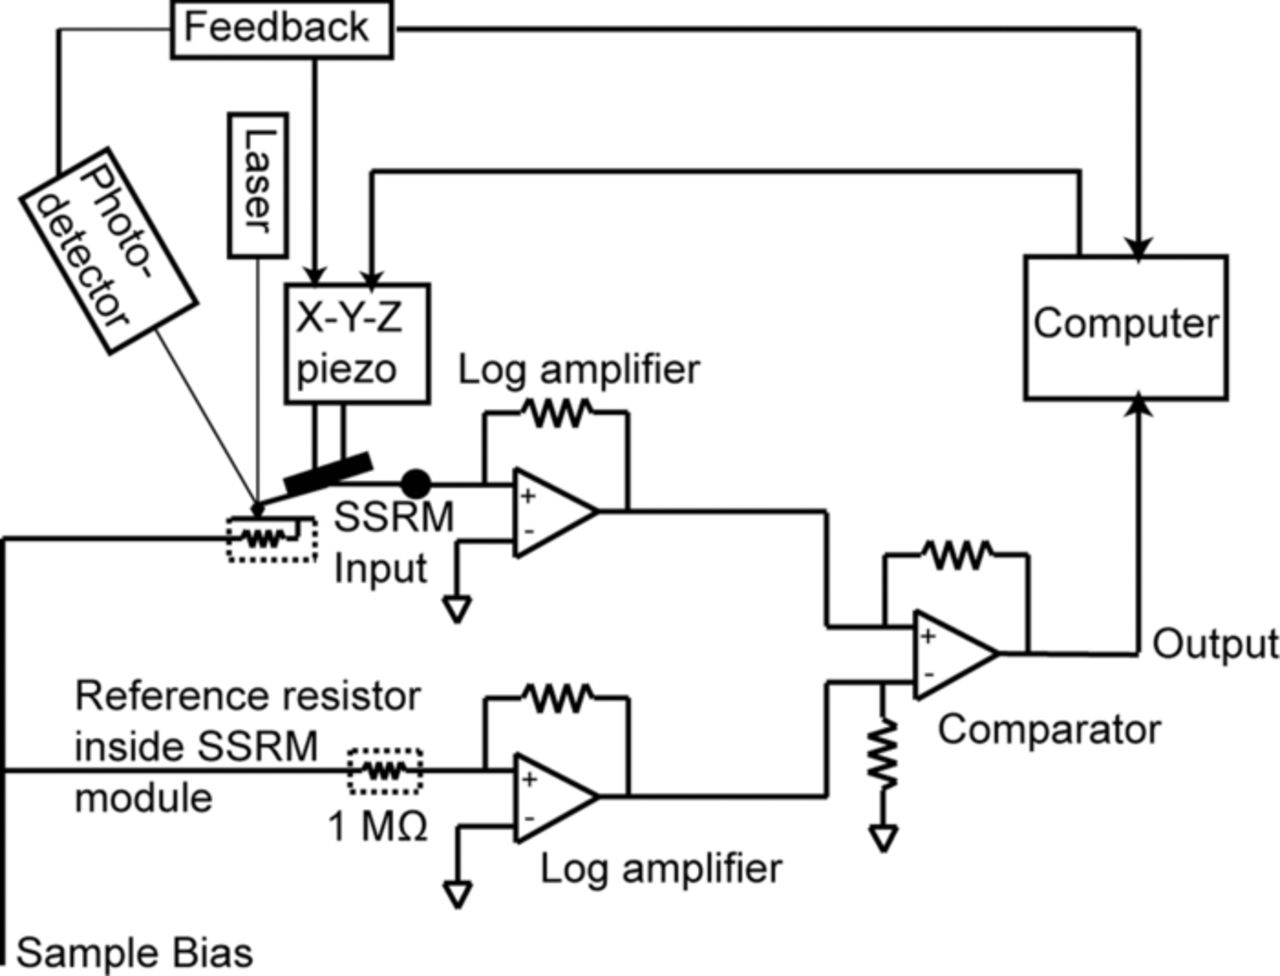
Figure 22. Schematic of the AFM-based resistance measurement technique where the surface height is measured in contact mode, and the resistance is measured by the current resulting from the applied sample DC bias voltage. (The schematic is for Dimension AFM (Veeco Instruments, Inc.) (adapted from Anonymous171).
The module applies the same bias to the 1 MΩ reference resistor mounted inside the module. The resistance is then measured by a comparator that compares the current flowing through the sample to the current flowing through the reference resistor. The output of the SSRM module is in volts. The module is calibrated by connecting several resistances of known value in the module instead of the tip-sample. For example, if 1 MΩ resistance is connected instead of the tip-sample, the output of the comparator is 0 V as the same current flows from the sample resistance and the reference resistor. Thus a 0 V output corresponds to a 1 MΩ resistance between the tip and the sample. When a positive bias is applied between the tip and the sample, the output voltage is inversely proportional to the surface resistance while it is directly proportional to the surface resistance if a negative bias is applied. The total resistance between the tip and the sample depends on the contact resistance, the spreading resistance, and the bulk resistance. One of the resistances dominates the total resistance depending on the contact force applied on the tip, the applied bias and the condition of the sample material. Depending upon the material, when a high enough contact force and a suitable bias is applied, a stable electrical contact is established between the tip and the sample, and the total resistance measured will be the surface resistance dominated by the contact resistance and the spreading resistance.171
Figure 23 shows the SSRM surface resistance image of the LiFePO4 cathode sample harvested from the unaged and aged cells. As the module configuration when +1 V is applied between the tip and the sample, the higher voltage reading represents lower surface resistance. The surface resistance scale on the unaged sample is 0–2 V, while the scale on the aged sample is 0–20 mV. The lower voltage output in the case of aged samples indicates higher surface resistance as compared to unaged sample. Thus surface resistance increases as the cells are aged.
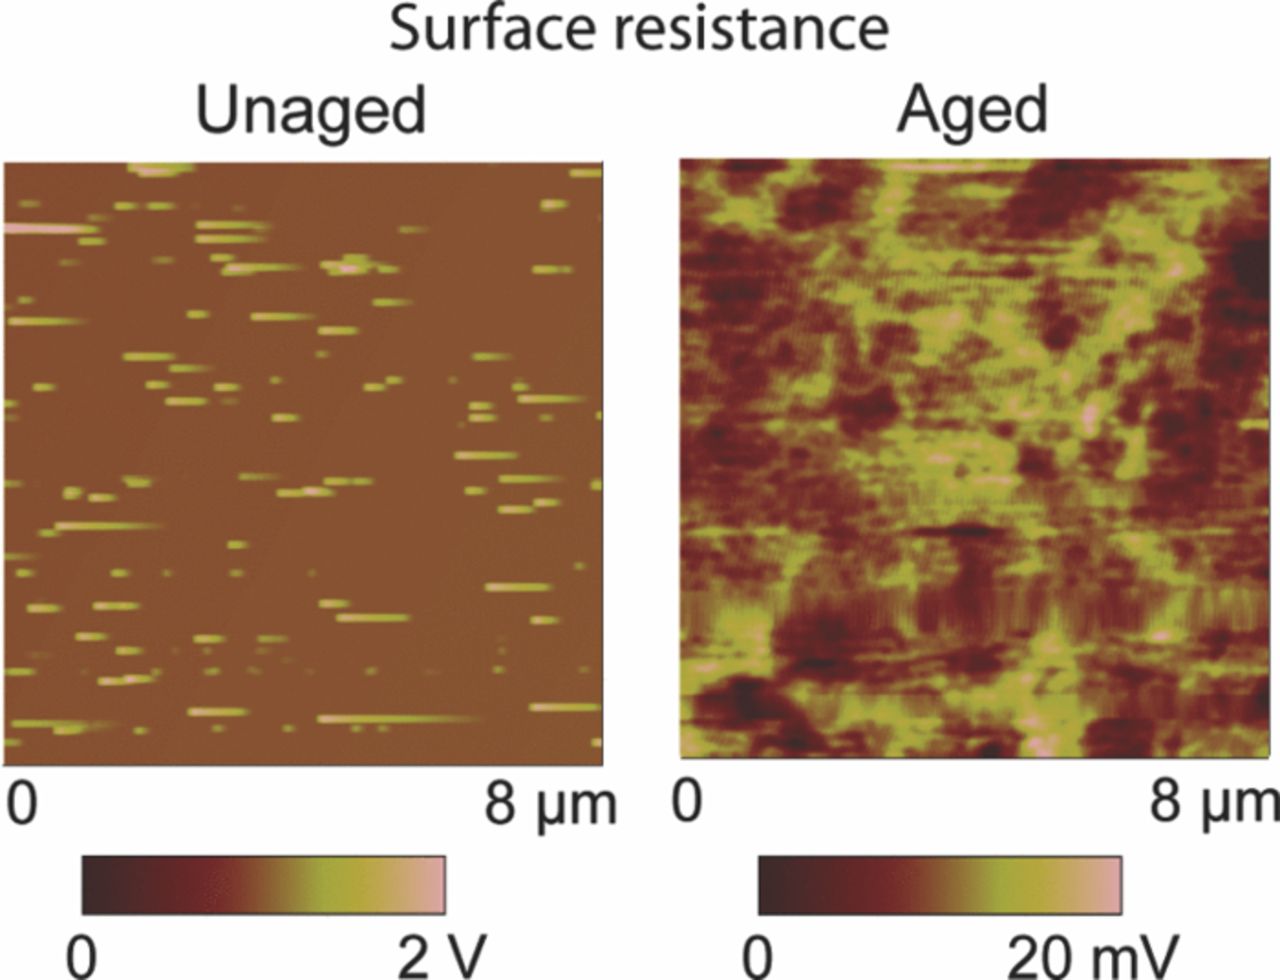
Figure 23. Surface resistance maps of a LiFePO4 cathode sample harvested from unaged and aged cells. A + 1 V DC bias is applied to the sample (adapted from Nagpure et al.64).
Based on their results, Nagpure et al.64 have proposed a mechanism that leads to the increase in the surface resistance of the LiFePO4 cathode sample, shown in Fig. 24. When the tip scans over the surface of the sample a circular contact is formed between the LiFePO4 nanoparticles and the tip. As mentioned earlier, the LiFePO4 nanoparticles have very poor conductivity (σ = 2 × 10⁻⁹ S cm−1),70,71 and hence to increase their conductivity, they are coated with carbon.7 In the case of the unaged sample the total surface resistance measured is the resistance of the carbon-coated LiFePO4 nanoparticles (Ru). Due to the coarsening of the nanoparticles the overall resistance increases to (Ra).
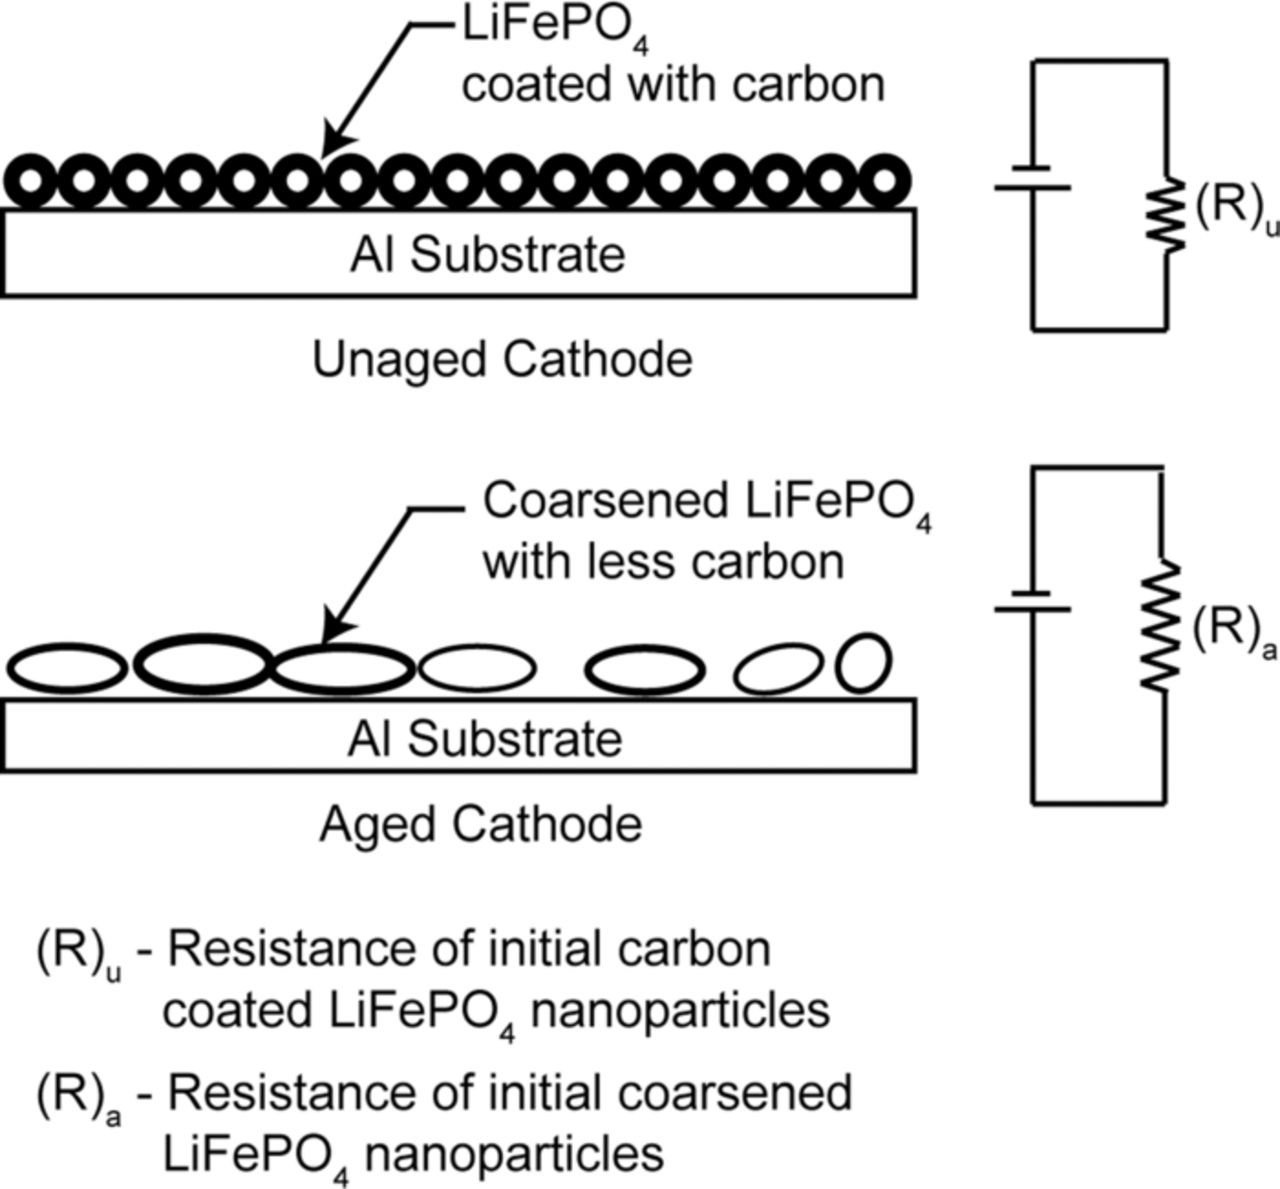
Figure 24. Schematic of a proposed mechanism explaining increase in the surface resistance of a LiFePO4 cathode due to aging (adapted from Nagpure et al.64).
The coarsening may also causes loss of the carbon coating, which leads to a further increase in the resistance of these particles. In addition to this, the total surface resistance of the aged sample could increase due to the additional resistance from the nano crystalline deposit (NCD) formed on the cathode surface. The NCD is formed due to the chemical reactions taking place at the surface of the cathode. Further experiments are needed to investigate the details of the NCD on the LiFePO4 cathode surface, but it was observed by Zhang et al.172 and Kostecki and McLarnon32 on LiNi0.8Co0.2O2 cathode surface.
Surface conductivity
Ramdon and Bhushan157 have used the current sensing capabilities of AFM to determine the effect of differences in surface morphology on the surface conductance of unaged and aged cathodes. They used Agilent 5500 AFM equipped with a current sensing preamplifier having a sensitivity of 1 nA/V. The experiments were conducted in the contact mode of the AFM with the tip coated with conductive material. CSAFM involves a bias voltage applied between the sample and the tip, which creates a current, and this current is used to construct a conductivity map. The voltage used in their experiment was 3 V.
Figure 25 shows the results of their experiment. There were greater occurrences of higher conducting regions within the sample for both 5 μm × 5 μm and 2 μm × 2 μm for the unaged cathodes. In the aged sample it was observed that the overall conductivity was lower and only the edges of some particles showed conductivity.
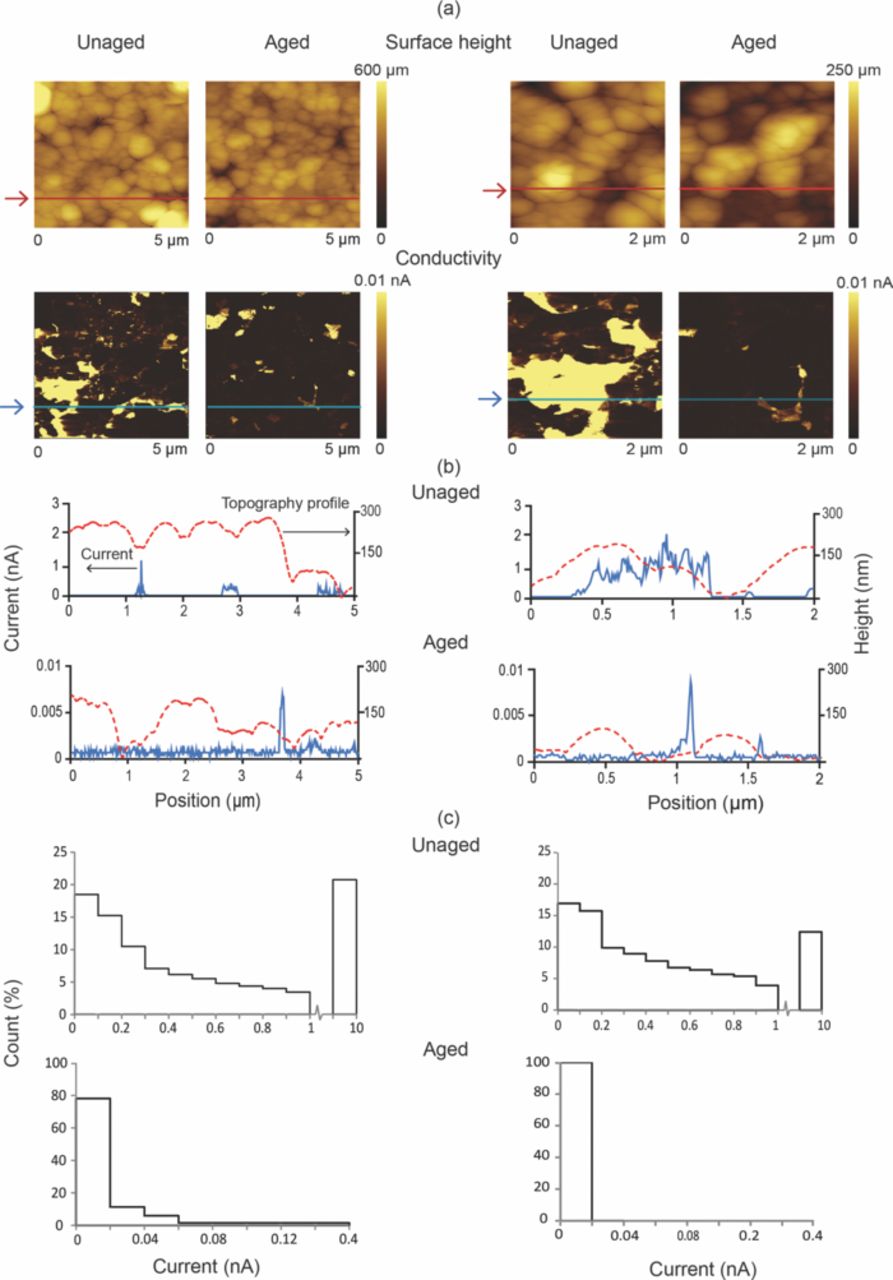
Figure 25. A 5 μm × 5 μm (left) and 2 μm × 2 μm (right) comparisons of unaged and aged LiFePO4 cathode samples. (a) Surface height and conductivity maps for unaged and aged. Arrows indicate line where sections were taken. (b) Profile of surface height and current overlay of both unaged and aged. (c) Histogram of the distribution of the current in the conductivity maps of both unaged and aged.157
Fig. 25b shows a profile extraction that was done for the unaged and the aged cathodes, and it can be seen that there are higher currents in the unaged sample going up to 2 nA for that section as compared to the aged with the highest reading being 0.01 nA. The 2 μm profile of the unaged sample showed that the particles had higher current reading as compared to the aged samples that had very low conductance. The histogram in Fig. 25c shows the current data extracted from the current maps. The unaged sample showed that 20% of the values fall between 1 to 10 nA while the other 80% are distributed from 0 to 1 nA. The majority of the aged cathode current values were between 0 and 0.1 nA. They have attributed the change in the surface conductivity to the active material losing contact with the current collector, poor conductivity of the PVDF binder, and the rearrangement of the carbon additive.
Surface charge/potential
Another technique of interest is Kelvin probe microscopy (KPM), which has been used in a variety of applications to measure surface potential. Because of the sensitive nature of silicon to charge buildup and subsequent discharge which can damage small silicon parts, surface potential measurements have been of interest in the semiconductor industry. The technique has also been used successfully to detect wear precursors from wear at very low loads using AFM based Kelvin probe methods.155,169,173
The use of the Kelvin probe method was extended to the study of Li-ion batteries by Nagpure et al.66 The KPM technique is based on the contact potential difference method for measuring the electronic work function (EWF).174 Since EWF is strongly influenced by the surface chemical composition and Fermi level of the material KPM can detect the structural and chemical changes of the surface and provide vital information about the onset of damage. Using KPM large areas of the entire cathode electrode can be scanned quickly giving spatial information of its surface. In this study, KPM was used for the first time to characterize aging of the cathode surfaces by measuring the change in the surface potential that can be attributed to physical and chemical changes of the surface.
Nanoscale surface potential measurements have been made by Nagpure et al.66 to study aged cathode samples. A schematic of this instrument with KPM setup is shown in Fig. 26. The KPM measures the surface potential of the samples in interleave mode. Along one scan line on the sample, in first pass, the surface height image is obtained in tapping mode. In second pass the tip is lifted off the sample surface and a surface potential map is obtained. Both images are obtained simultaneously.175 During the first pass, the cantilever is mechanically vibrated by the X-Y-Z piezo near its resonance frequency. The amplitude of the tip vibrations (not shown) is maintained at a constant value by the feedback loop as the tip scans the surface of the sample. The signal from the feedback loop is used to construct the height map of the sample surface (Fig. 26a). During the interleaved scan, the X-Y-Z piezo is switched off. Instead, an AC signal is applied directly to the conductive tip that generates an oscillating electrostatic force on the tip. The tip is scanned along the surface topography line obtained in the tapping mode with a certain lift off the sample (dotted line in Fig. 26a).
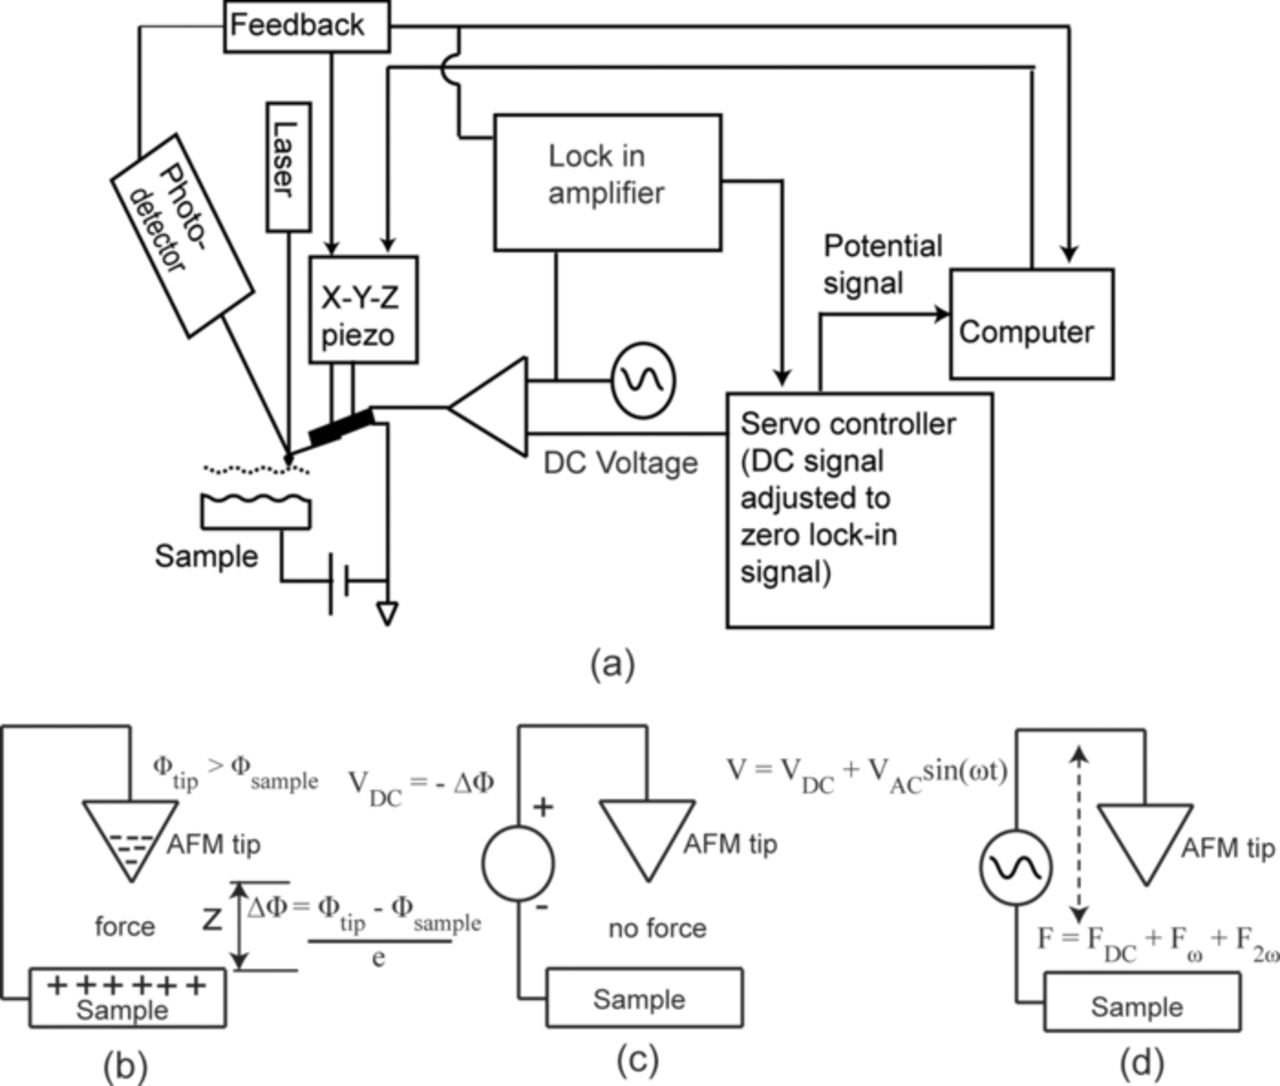
Figure 26. (a) Schematic of the two pass interleave scan method used in KPM (adapted from Rice175). (b) Electrostatic potential and interaction force between a conducting tip and a sample (for illustration Φtip > Φsample is assumed), (c) external DC voltage applied to nullify the force, and (d) external AC voltage with adjustable DC offset is applied to the tip which leads to its vibration (adapted from Bhushan and Goldade176).
To briefly describe the operating principle of KPM, consider a tip and sample interaction as seen in Fig. 26b–26d. When the tip and sample are electrically connected (Fig. 26b) electrons flow from the material with the lower work function to the material with the higher work function. Due to the difference in the work function of the electrically connected tip and the sample, an electrostatic contact potential difference (or surface potential difference) is created between the tip and the sample.174 The value of this surface potential (ΔΦ) is given by the following equation
![Equation ([6.1])](https://content.cld.iop.org/journals/1945-7111/160/11/A2111/revision1/jes_160_11_A2111eqn10.jpg)
where Φtip and Φsample are work functions of the tip and the sample, respectively, and e is the magnitude of the charge of one electron. ΔΦ will be affected by any adsorption layer and the phase of the material near the surface. Electrostatic force is created between the tip and sample under the influence of this surface potential difference and the separation dependent local capacitance C of the tip and sample. This force is given by
![Equation ([6.2])](https://content.cld.iop.org/journals/1945-7111/160/11/A2111/revision1/jes_160_11_A2111eqn11.jpg)
where z is the distance between the tip and sample.
Along with ΔΦ, in the operation of the KPM a compensating DC voltage signal (VDC) and AC voltage signal, VACsin (ωt) (Fig. 26c and Fig. 26d), is applied directly to the tip. Thus the electrostatic force between the tip and the sample becomes:
![Equation ([6.3])](https://content.cld.iop.org/journals/1945-7111/160/11/A2111/revision1/jes_160_11_A2111eqn12.jpg)
The cantilever responds only to the forces at or very near its resonance frequency. Thus, only the oscillating electric force at ω acts as a sinusoidal driving force that can excite oscillations in the cantilever. The DC and the 2ω terms do not cause any significant oscillations of the cantilever. In tapping mode, the cantilever response (RMS amplitude) is directly proportional to the drive amplitude of the tapping piezo. Here in the interleave mode the response is directly proportional to the amplitude of the ω term.175 The servo controller applies a DC voltage signal equal and out of phase with ΔΦ so that the amplitude of the tip becomes zero (F = 0). This compensating signal from the servo controller creates the surface potential map of the sample.176
The conductive AFM tip is necessary for the KPM experiments. The tips used in these experiments had an electrically conductive 5 nm thick chromium coating and 25 nm thick platinum coating on both sides of the cantilever (Budget Sensors, Model # Multi75E-G). The resonant frequency of the tips was 75 kHz, and the radius was less than 25 nm. The interleave height was optimized to 150 nm for a good surface potential signal.
The surface potential maps of the unaged and aged LiFePO4 cathode samples are shown in Fig. 27. The maps were collected by applying +1.0 V and +3.3 V from the external DC voltage source. Maps for samples without an externally applied voltage are shown for comparison. Within each surface potential map for both the unaged and aged sample, Nagpure et al.66 observed no large difference in the contrast, suggesting an almost uniform dissipation of charge over the surface of the samples under the externally applied voltage. This indicates that under the external source the sample tends to charge uniformly even in an aged condition. The uniform charging is good for the cell as it avoids large local currents and subsequent damage to the cathode.
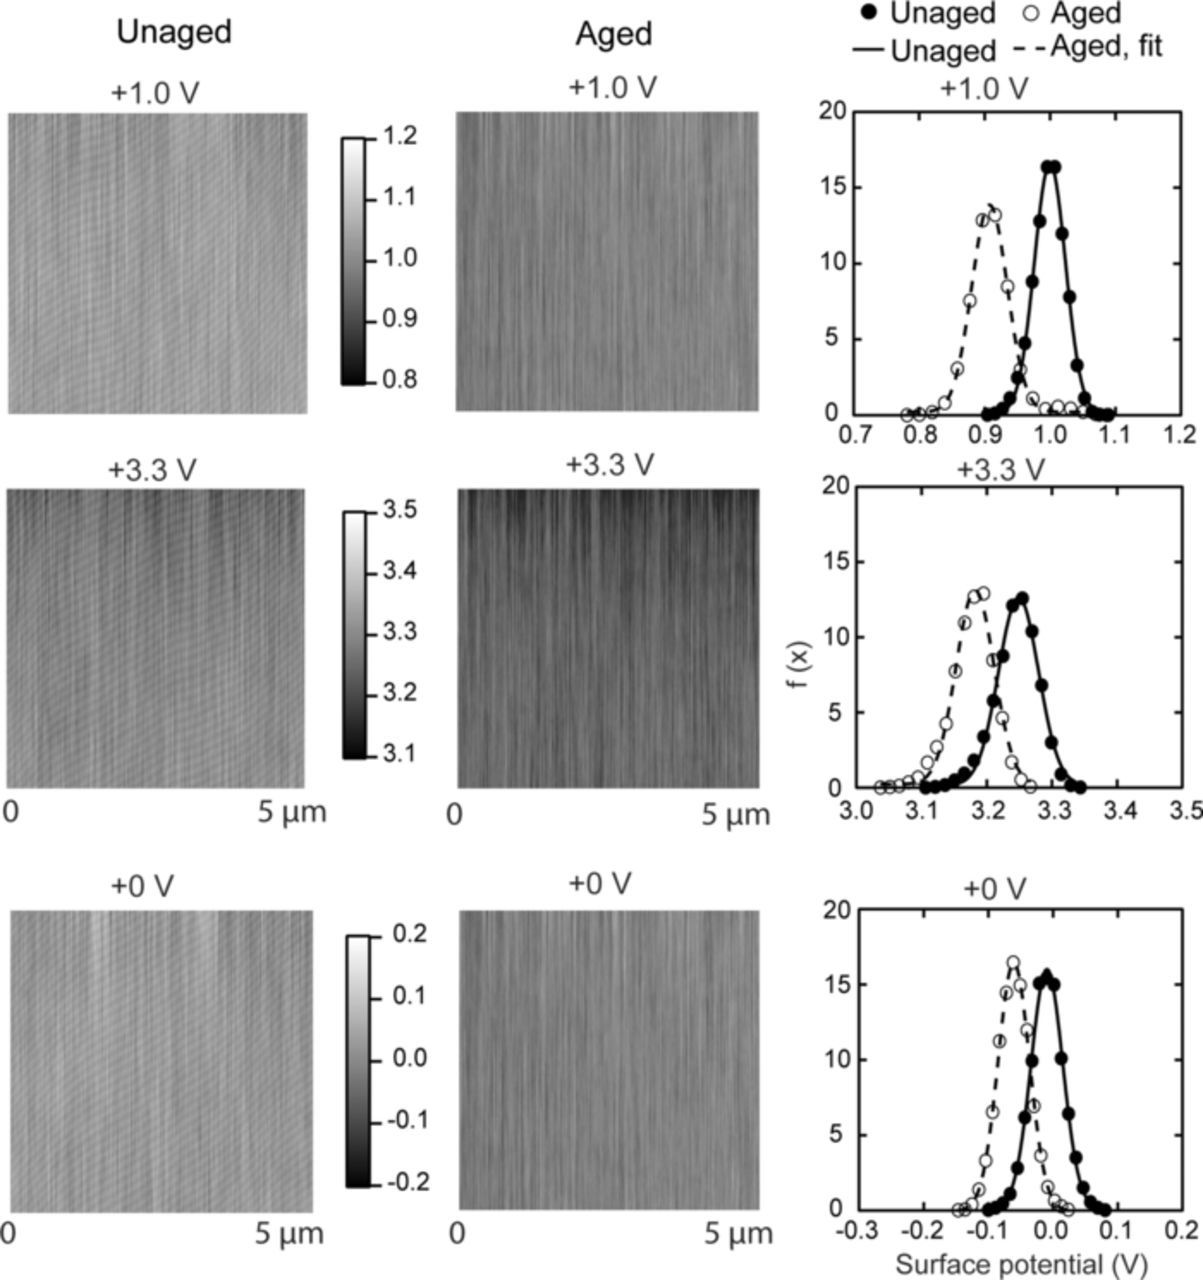
Figure 27. Surface potential map of the unaged (left column) and the aged (middle column) LiFePO4 cathode samples with external voltage of +1.0 V and +3.3 V. The data for a sample without any external voltage is shown for comparison. The right column shows the normal probability density distribution of the surface potential values obtained for the unaged and aged samples. The mean value of the surface potential decreases after aging (adapted from Nagpure et al.66).
The surface potential image discussed above is generated by a matrix of 256 × 256 data points. The last column of Fig. 27 also shows the distribution of these data points in unaged and aged cathodes. For each case a histogram is created with 17 equally spaced bins. The bin size was optimized using Sturges rule,177
![Equation ([6.4])](https://content.cld.iop.org/journals/1945-7111/160/11/A2111/revision1/jes_160_11_A2111eqn13.jpg)
where k is the number of bins, and n is total number of data points. Then a normal probability density function as shown below is used to fit the data.178
![Equation ([6.5])](https://content.cld.iop.org/journals/1945-7111/160/11/A2111/revision1/jes_160_11_A2111eqn14.jpg)
where μ is the mean, and σ is the standard deviation of the data points. The unaged sample had mean values of the surface potential almost equivalent to the external applied voltage. The mean values of surface potential on the aged sample are lower than that of the unaged sample. Thus, even though the externally applied voltage was the same for the unaged and aged samples the charge sustained on the surface of the aged cathode is less than that sustained on the unaged cathode.
The surface potential measured using KPM is the difference between the work functions of the tip and sample surface. Since the same kind of tip is used in these experiments, the work function of the tip is constant in each surface potential map. Figure 27 shows the change in the work function of the aged sample as compared to the unaged sample. The work function is the property of the structure near the surface of the sample along with the chemical potential of the surface. The decreased surface potential in the aged sample is the indication of the surface modification and could occur due to one or all of the factors discussed below.
A phase change of the cathode material occurs from LiFePO4 to FePO4 and back to LiFePO4 during respective charging and discharging cycles of the battery. During charging, the Li-ions from the LiFePO4 cathode are intercalated in the graphite anode. During discharging, the Li-ions move out of the graphite anode and are intercalated back in the cathode. The olivine structured LiFePO4 has a different work function than that of the metastable FePO4. The change in the surface potential map of the aged sample indicates that one of the phases might be growing in the cathode sample during the battery aging. Andersson and Thomas179 have demonstrated this phase change as a source of initial capacity loss using neutron diffraction data. Based on their experiments they have proposed a radial model and a mosaic model for the phase change between LiFePO4 and FePO4. In either of their models they have suggested unconverted inactive regions of LiFePO4 entrapped by the FePO4 phase. They concluded that, in reality, the superposition of the essential features of the two models might be occurring.
Summary
The electrical properties of the LiFePO4 based Li-ion batteries were studied at different scales. The capacity drop and internal resistance were used as the system level metrics. As the battery approached the EOL the knee in the discharge curve was approached rapidly. The batteries cycled at higher C-rate tend to age faster.
SSRM was used to measure the change in the surface resistance. The aged sample showed much higher surface resistance as compared to the unaged sample. The loss of performance can be attributed to the coarsening phenomena observed in the physical/morphological studies. The coarsening phenomenon can lead to the disbonding of the nanoparticles from the aluminum substrate causing loss of contact between the active material and the current collector, leading to an increase in the internal resistance. The coarsening can also lead to separation of particles, leading to the loss of electrical contact between particles. The coarsening phenomena can also cause the degradation in the carbon coating leading to a further drop in the electrical performance of the cathode.
KPM was used to measure the change in the surface potential. The aged sample showed a less charge sustaining capacity as compared to the unaged sample. The loss in the ability of the cathode to retain the applied charge can also be attributed to the coarsening phenomena. In this case, due to the larger particle size the overall distance traveled by the applied charge is increased, thus leading to the loss of capability to sustain the applied charge within the applied time.
Multi-Scale Characterization of Cathode - Structural and Chemical
In this part, the chemical and structural changes in the cathode material due to the aging of the batteries are examined. The long range structure of the LiFePO4 nano particles is characterized with X-ray diffraction. Then Raman spectroscopy is used to characterize the carbon-coating of the cathode material. The electron energy loss spectroscopy was used to understand the changes in the local structure of the LiFePO4 nanoparticles due to aging of the batteries. Electron based techniques fail in characterizing the Li in the cathode material. Hence two neutron techniques are added to the scheme of the multi-scale characterization. The local lithium environment was probed with the nuclear magnetic spectroscopy. Finally, neutron depth profiling was used to measure the lithium concentration in the unaged and aged samples of the cathode material.
Characterization of carbon coating
Raman spectroscopy is a unique analytical tool for identifying and characterizing the elements within the sample. It is a non-destructive tool and requires very minimal sample preparation. The atmospheric CO2 and H2O do not interfere with the Raman signal, so no special atmospheric conditions are necessary during the experiments. Several different researchers have used Raman spectroscopy to characterize different types of carbon in different forms such as crystalline, non-crystalline, and amorphous carbons.180–184 Saito et al.185 have used Raman spectroscopy to analyze the single-wall carbon nanotubes.
Recently Raman spectroscopy has been used to analyze the carbon coating of LiFePO4 nanoparticles used in lithium-ion batteries. The studies have been conducted to understand the effect of carbon coating on the electrochemical performance of LiFePO4 based lithium-ion batteries. In the studies done by Doeff et al.186 they showed that the structure of the residual carbon present on the LiFePO4 powder affects its electrochemical performance and the better performance is dependent on the quality of the carbon rather than the quantity of the carbon. Similarly, Cho et al.187 have used RS for studying the effect of the coating thickness on the capacity of LiFePO4 composite cathodes. Julien et al.188 characterized the carbon-film coating on the LiFePO4 nanoparticles and discussed the Li+ diffusion through the carbon coating. Wilcox et al.189 used RS to study the factors, in particular the synthetic additives, which can affect the quality of the carbon coatings. Also, the effects of the thermal treatments on the performance of the carbon coating using RS have been studied by Maccario et al.190 RS is very useful in characterizing the carbon coating of LiFePO4 nanoparticles for two main reasons. One, carbon has a strong scattering with two E2g modes predicted to be Raman active.189 Second, the penetration depth of light inside the LiFePO4 particles is very small, thus the first coating layer can be easily probed with RS.188
In the multi-scale characterization plan RS was used to analyze the carbon coating on the LiFePO4 nanoparticles in several commercial cells aged with different C-rates.69 As mentioned earlier, it is a common practice in the production of lithium-ion battery electrodes to add carbon, either by use of carbon additives to the LiFePO4 matrix or by surface coating of LiFePO4 particles with thin layers of carbon to improve the electronic conductivity. Degradation in the quality of the carbon coating can lead to decreased electronic performance of the cathode.
Labram, an integrated confocal Raman microscope system, made by ISA Group Horiba was used to analyze the carbon-coating. Since the positions of the Raman bands are dependent on the wavelength of the incident laser, a He-Ne laser with 512 nm excitation wavelength was used in these experiments for comparison of our data with the published literature. The laser power was adjusted to 2.5 mW and the laser spot size was at ∼5 μm. RS experiments were conducted under ambient conditions at room temperature. The data acquisition time was set at 10 s for all the samples. The commercial software package included in the Labram system was used for background subtraction and baseline correction.
Figure 28 shows a typical Raman spectra obtained on sample C0 (solid dark line). The Raman spectroscopy of a disordered carbon shows two distinct peaks. The peak at ∼1600 cm−1 is referred to as G (graphite) peak and the peak at ∼1350 cm−1 is referred to as D (disordered) peak. The G peak is attributed to the optically allowed E2g zone-center mode of crystalline graphite while D peak is attributed to the disorder allowed zone-edge modes of graphite.182,188
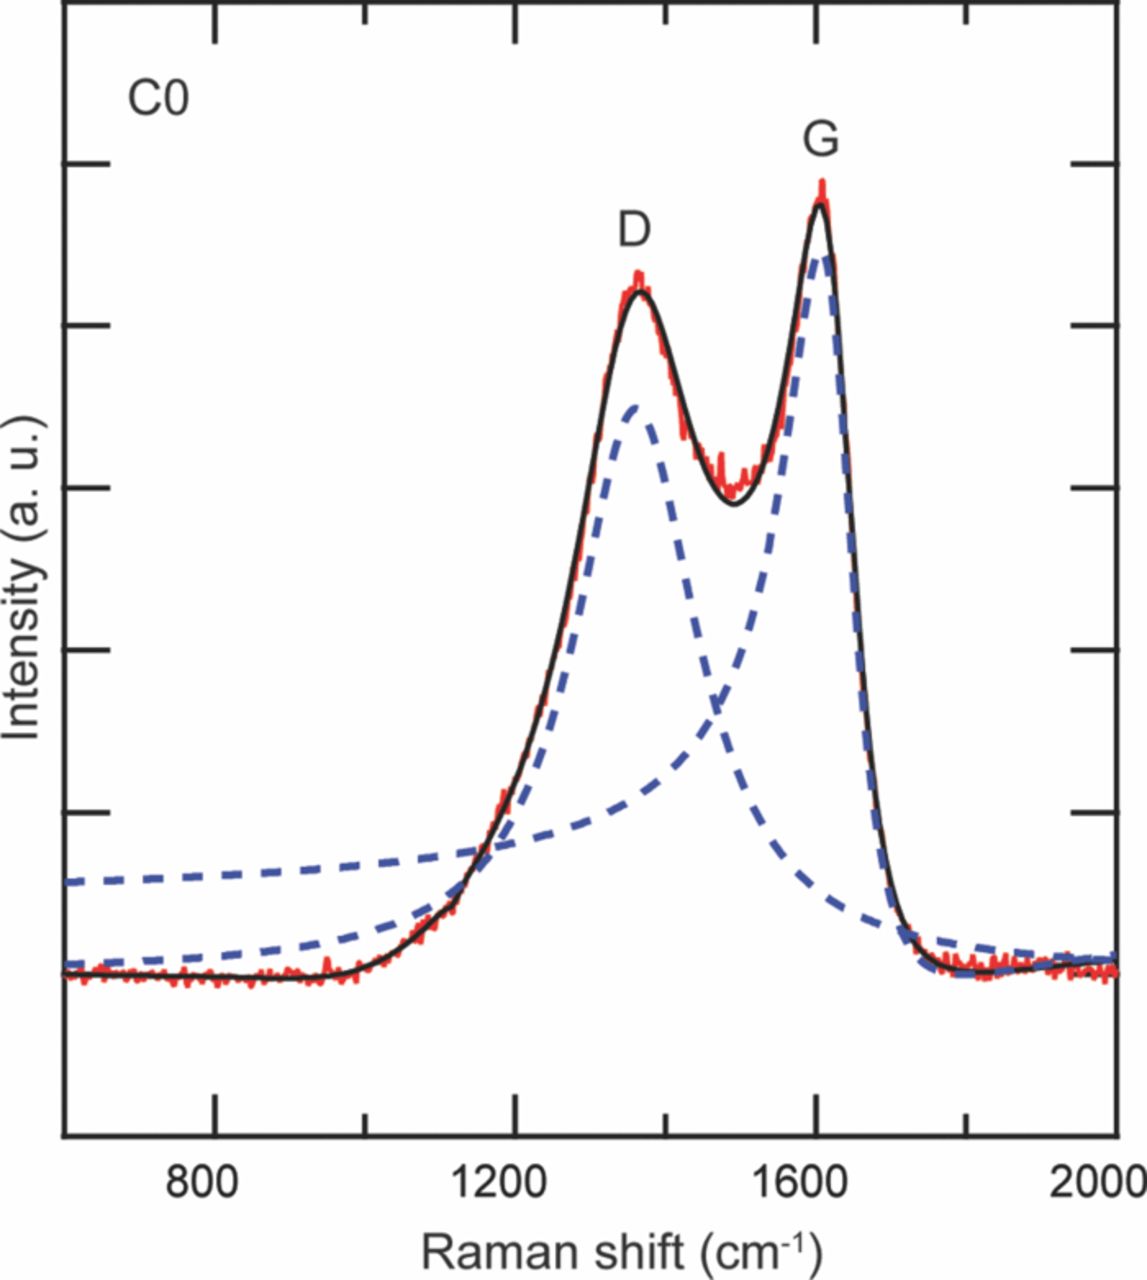
Figure 28. Deconvolution method used for fitting of experimental Raman spectra. The method is demonstrated with the experimental Raman spectra (dots) for C0 battery. The data is deconvoluted in two peaks (dotted line) and then fitted (solid line). The D peak is fitted with Lorentzian and G peak is fitted with Breit-Wigner-Fano (BWF) line shape.69
The Raman spectra are deconvoluted according to these two characteristic D and G peaks. As can be seen in Fig. 28 the Raman spectra were satisfactorily deconvoluted with Breit-Wigner-Fano (BWF) plus Lorentzian scheme. A BWF line is used for the G peak and a Lorentzian line is used for the D peak. The BWF line shape is given by
![Equation ([7.1])](https://content.cld.iop.org/journals/1945-7111/160/11/A2111/revision1/jes_160_11_A2111eqn15.jpg)
where I0 is the peak intensity, ω0 is the peak position, Γ is assumed as the full width at half maximum (FWHM) and Q− 1 is the BWF coupling coefficient. Due to the coupling of a discrete mode to the continuum BWF line has an asymmetric line shape.184,191 A Lorentzian line shape given by Eq. 6.2, which belongs to the same family as BWF is used for the D peak:
![Equation ([7.2])](https://content.cld.iop.org/journals/1945-7111/160/11/A2111/revision1/jes_160_11_A2111eqn16.jpg)
The deconvolution of the Raman spectra based on BWF + Lorentzian scheme is shown for the data obtained for sample C0 in Fig. 28.
Figure 29 shows the fitted Raman spectra for all the samples using the de- convolution method described above. The deconvolution procedure satisfactorily fits the experimental Raman spectra for all the samples. The two characteristic D and G peak are observed in all the samples. Note that the positions of the Raman bands are dependent on the incident laser wavelength, so for quantitative comparison between spectra given here, the excitation wavelength of 512 nm was maintained in this study. The data shows a uniform coating of carbon on the LiFePO4 particles with highly disordered carbon. The relative intensities of the D and G band are associated with the increased carbon disorder similar to disorder in microcrystalline graphite.186,192
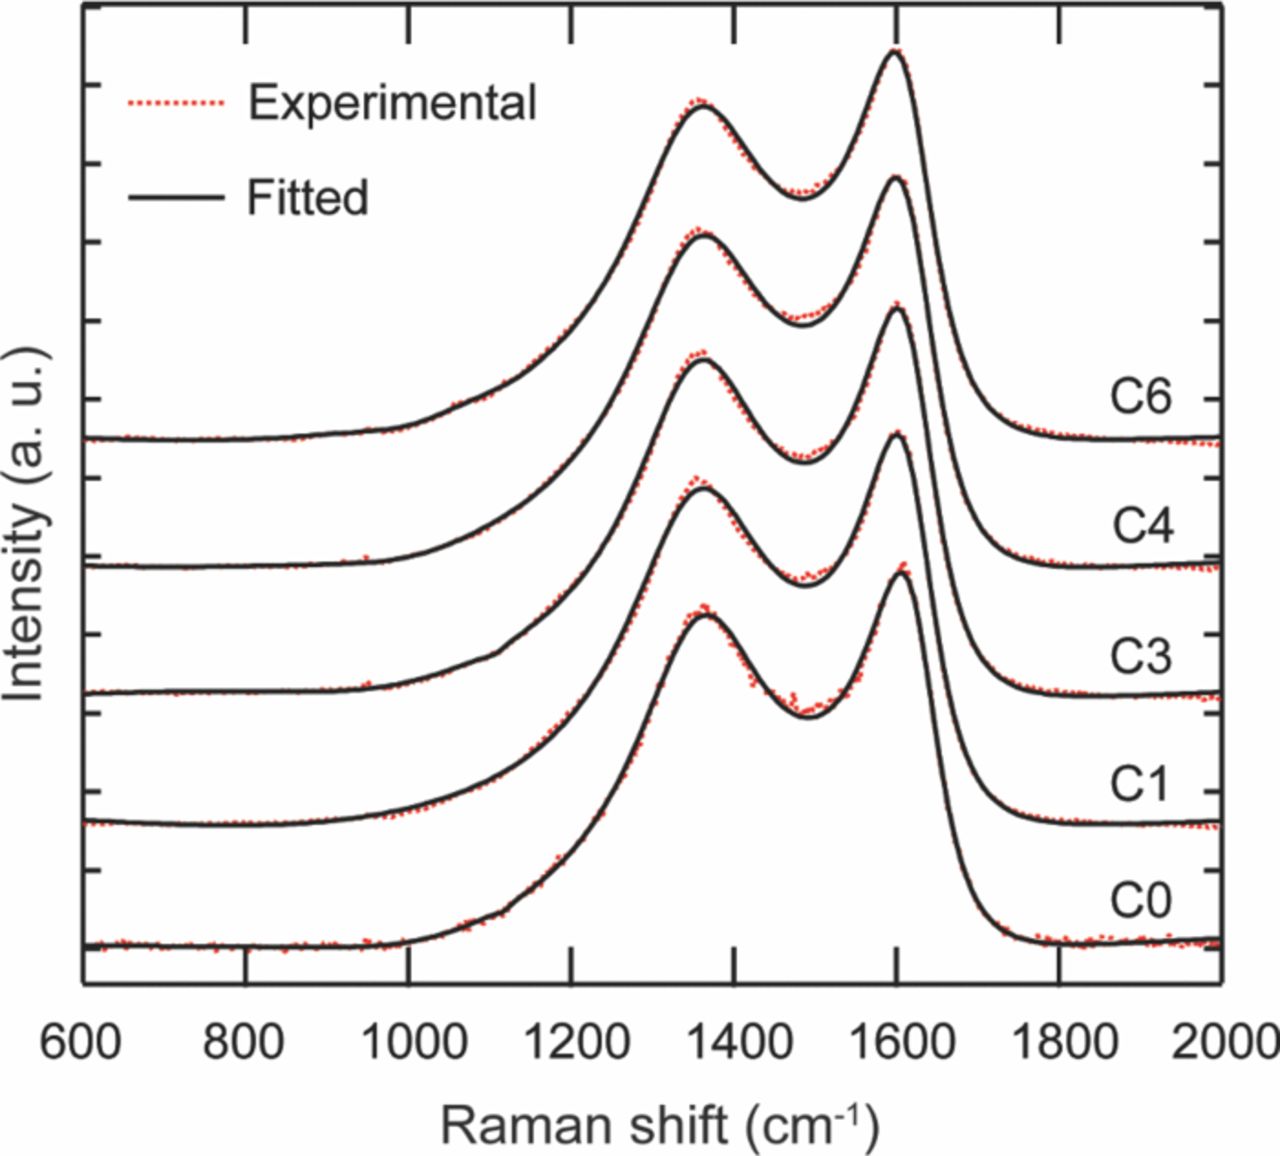
According to Doeff et al.186 the electrochemical performance of the carbon coated LiFePO4 cathode is not only dependent on the quantity of the carbon but also on the quality of carbon. The quality of the carbon coating in the different samples is compared by comparing the intensity ratios of the D and G band (ID/IG). Usually a lower ID/IGratio is desired in a good quality LiFePO4 cathode. As can be seen in Figure 30, ID/IG ratio increases with increasing C-rate. According to Tuinstra and Koenig193 the in-plane correlation length ID/IG is related to the ID/IG ratio, which quantifies the mean basal-plane diameter of graphite parallel to (001).190 The following modified Tuinstra-Koenig relation gives the value of La,
![Equation ([7.3])](https://content.cld.iop.org/journals/1945-7111/160/11/A2111/revision1/jes_160_11_A2111eqn17.jpg)
where C(λL) is a variable scaling coefficient depending on excitation wavelength λL and given by
![Equation ([7.4])](https://content.cld.iop.org/journals/1945-7111/160/11/A2111/revision1/jes_160_11_A2111eqn18.jpg)
where C0 = −126 Å and C1 = 0.033.194 As the ID/IG ratio increases from 0.76 to 0.81 the in-plane correlation length ID/IG calculated using Eq. 7.3 and Eq. 7.4, drops from 5.64 to 5.27 nm for cells C0 through C6. The increasing trend of the ratio and decreasing trend of the in-plane correlation length suggest the lower amounts of graphite clusters in very highly disordered carbon. Thus the higher ID/IG ratio here indicates poor quality carbon in cells aged with a higher C-rate.189 This leads to poor electronic properties of the carbon coating and contributes to the increased ohmic resistance of the cell. Thus the overall electrode performance is affected in cells aged with a higher C-rate. The composite cathodes cycled with a higher C-rate have poor electronic conductivity. The higher ID/IG ratio could be the result of the thermal effects and the strain developed in the matrix due to the volume change of the active material during each charging and discharging cycle.
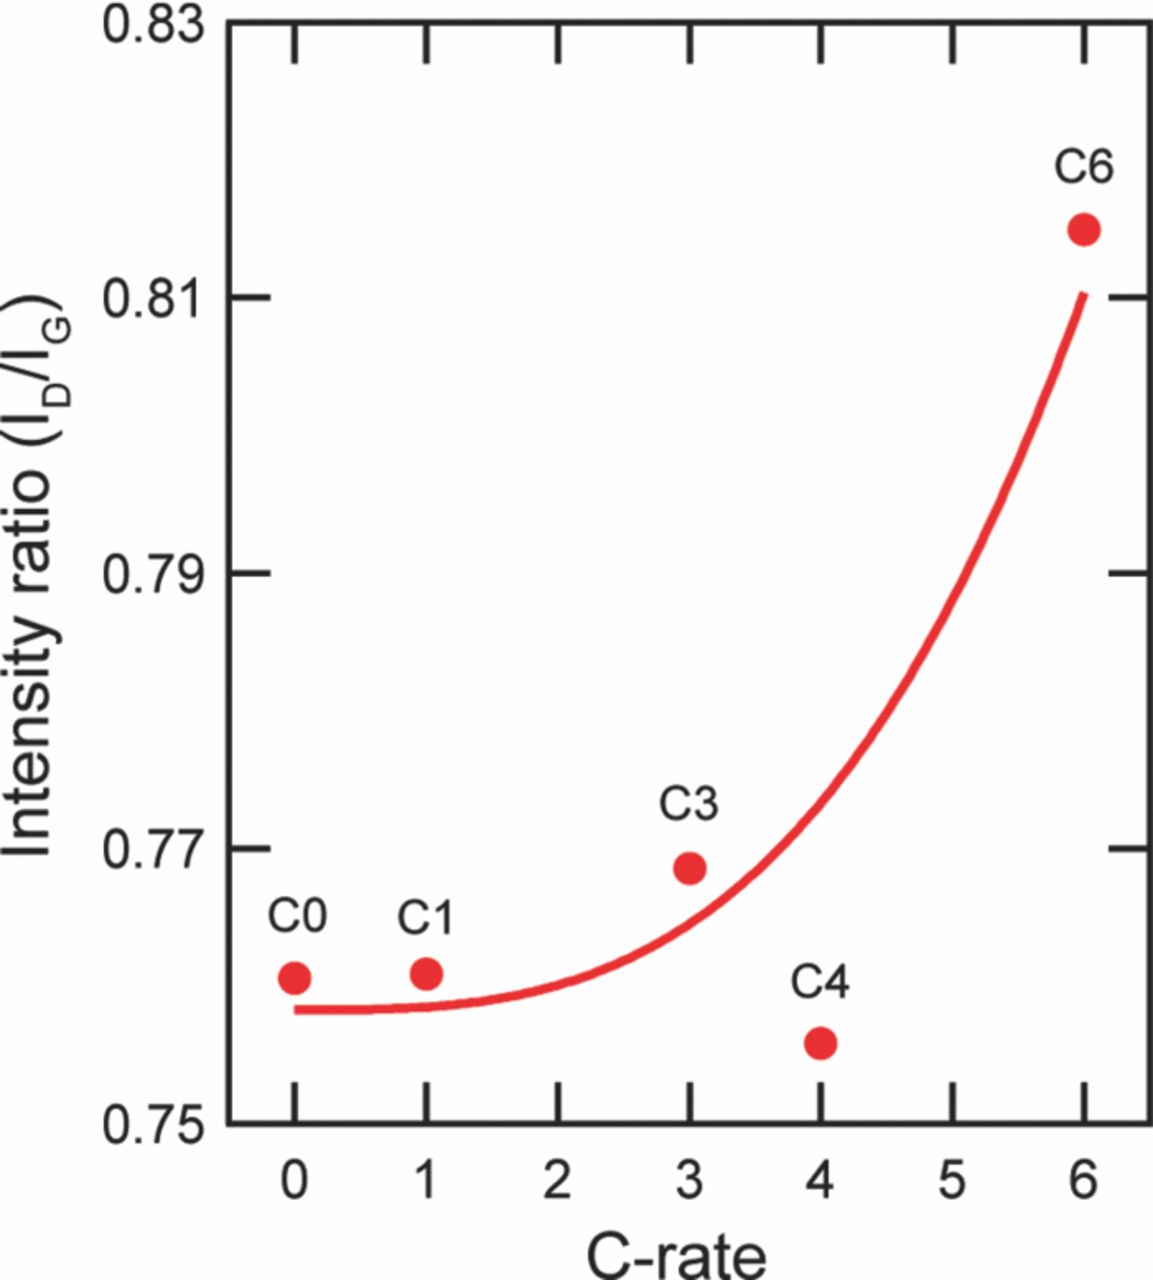
Figure 30. Intensity ratio analyzes (ID/IG). The intensity is calculated as the area under the respective curve. The intensity increases with the C-rate indicating poor quality of carbon leading to loss of electrical conductivity in batteries cycled at higher C-rate.69
In summary RS was used to analyze the carbon coating of aged LiFePO4 nanoparticles. According to the Raman studies the carbon coating degrades in quality as batteries are aged at higher C-rates. The higher ID/IG ratio in the case of batteries cycled at a higher C-rate indicates poor quality carbon leading to a loss of electrical conductivity and a subsequent decrease in the performance of the battery.
Phase and local structure analysis
The phase and the local structure analysis of the cathode samples is necessary to understand the chemical structure change due to the aging of the cells. The X-ray diffraction is good in analyzing the long-range structure of the material. The electron energy loss spectroscopy will provide a localized analysis of the change in the electronic bonding between the host active material matrix due to the change in the phase observed with XRD.
X-ray diffraction (XRD)
X-ray diffraction is a non-destructive technique mainly used for studying long range structural ordering of materials and phase identification. It is also used for quantitative analysis of phases, residual stress measurement, crystal structure and three-dimensional material properties. In lithium ion battery research it has been used for ex-situ phase identification of the cathode materials after being charged and discharged. Recently in situ XRD has been demonstrated to analyze the crystalline structure of the cathode material during charging and discharging cycles.195
Li et al.195 have used Rietveld fitting and quantitative phase analysis to analyze the phase fractions. The two-phase fitting was performed using LiFePO4 and FePO4 as end-members and the structural data given by Anderson et al.196 and Channagiri et al.152 The results of quantitative phase analysis demonstrate an increase in FePO4 phase fraction with aging at a given location on the cathode as seen in Fig. 31. The increase in FePO4 phase with aging was explained by considering separation at the Carbon-LiFePO4 interface with aging. This separation would result in fewer regions of the cathode where a three phase boundary is present (Active material/Carbon/Electrolyte), reducing the efficiency of Li intercalation into the solid nanoparticles. The change in the volumetric concentration of the active material would be a very important input parameter in the electrochemical and performance models of the Li-ion batteries.
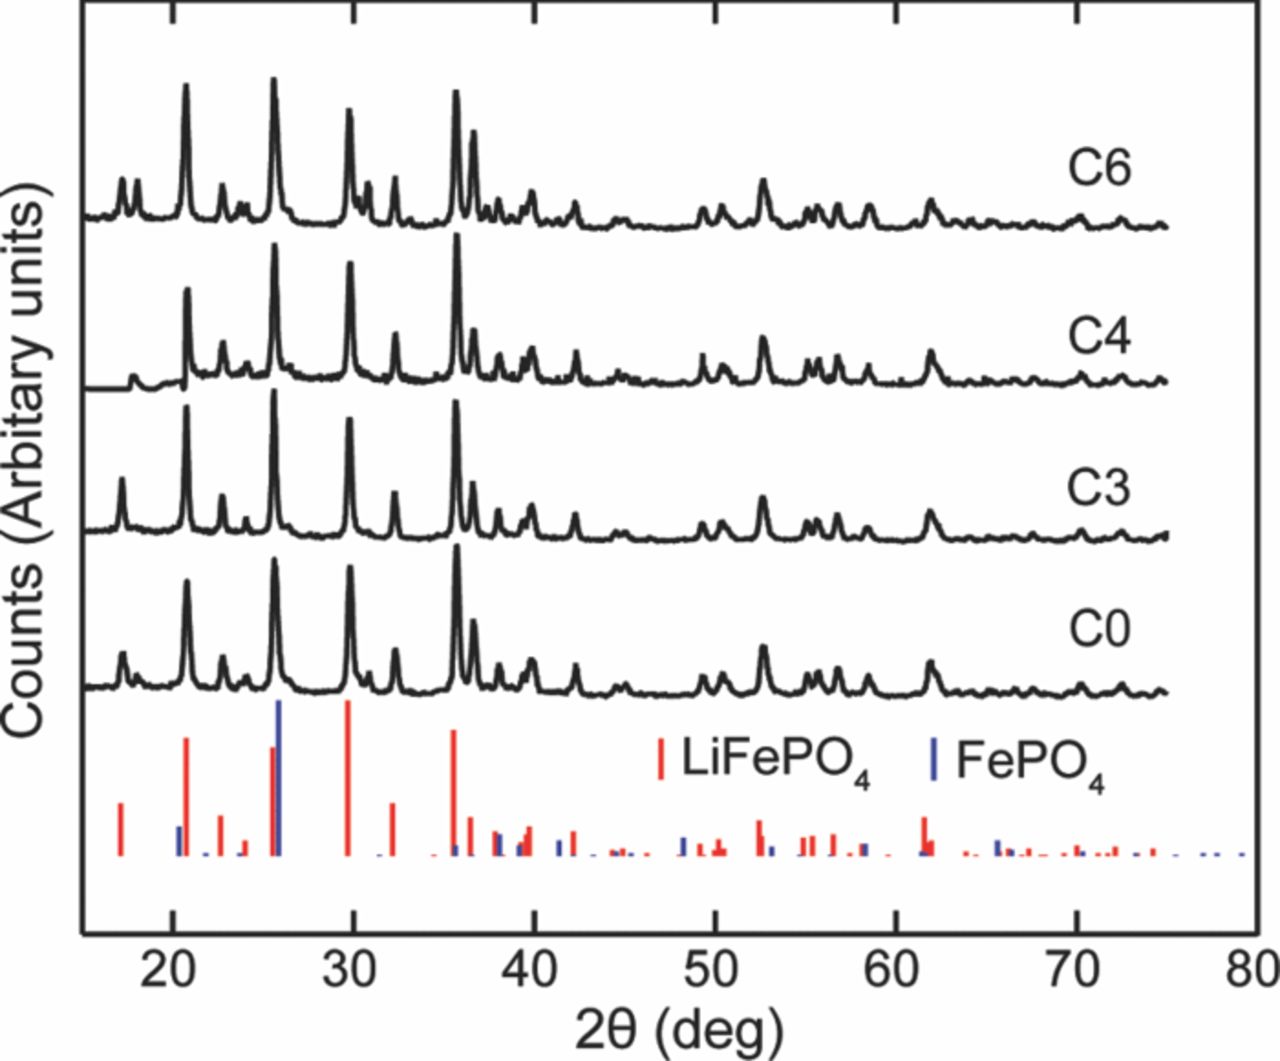
Figure 31. XRD spectra of unaged and aged samples. Both the samples show presence of LiFePO4 and FePO4 phases.
Electron energy loss spectroscopy (EELS) (nm)
Electron energy loss spectrometry (EELS) is based on the analysis of the energy distribution of electrons that have interacted inelastically with the specimen. These inelastic collisions carry information about the electronic structure of the specimen, which helps in understanding the electronic bonding between the various elements of the specimen. EELS studies can also help identify the thickness of the sample. The technique can be applied to any amorphous as well as crystalline sample. The EELS spectrum is gathered with the help of a magnetic prism spectrometer that is often interfaced into TEM.197
So far, in lithium ion battery research, EELS has been used to study the local electron structure of the host material, the intercalation/deintercalation process of the Li within the host material and the subsequent phase changes.58,160 In the multi-scale characterization plan EELS was included to analyze the local electronic bonding of the Li with its neighboring atoms and to identify the changes in these electronic bonding schemes between the LiFePO4 cathode samples harvested from the unaged and aged batteries. Such studies were conducted along with the high-resolution TEM imaging studies reported in morphological studies by Nagpure et al.68 The sample preparation process has already been discussed earlier.
Figure 32 shows the microstructure and the corresponding EELS measurements for the unaged and aged samples. The areas were chosen for a single particle analysis. Due to the uncertainty in establishing the absolute value for the energy loss scale all the spectra were aligned at O K edge (532 eV). All the spectra were normalized to the intensity of the O K edge peak. As shown in Fig. 32b, a significant difference in the shape of the O K edge peak is observed. The peaks in the data were fitted with a Gaussian function. The O K edge peak is at 532 eV, with a pre-peak at ∼528 eV found in the aged sample which is almost negligible in the unaged sample. Figure 32c shows changes in the Fe L2,3 edge with aging. It can be seen in this figure that the main difference between the aged and unaged sample is the position of the Fe L2,3 edge. The onset of the Fe L2,3 edge for the aged sample is ∼2 eV higher than for the unaged sample. The EELS measurements were conducted from the periphery to the core of the LiFePO4 particle in both the unaged and aged sample. But note that in Fig. 32b and 32c not all spectra are shown, and only a representative of the phenomena is presented. As can be seen in Fig. 32b, the intensity of the O K edge pre-peak is higher at the core than at the periphery of the large particle in the aged sample. Thus the ratio of the pre-peak to the main feature of O K edge peak was less at the core of the larger particle in the aged sample than at the periphery. It is also interesting to note that if the EELS spectra are obtained at the core and the periphery of a large particle in the aged sample, there is a shift of the Fe L2,3 edge to a higher energy.
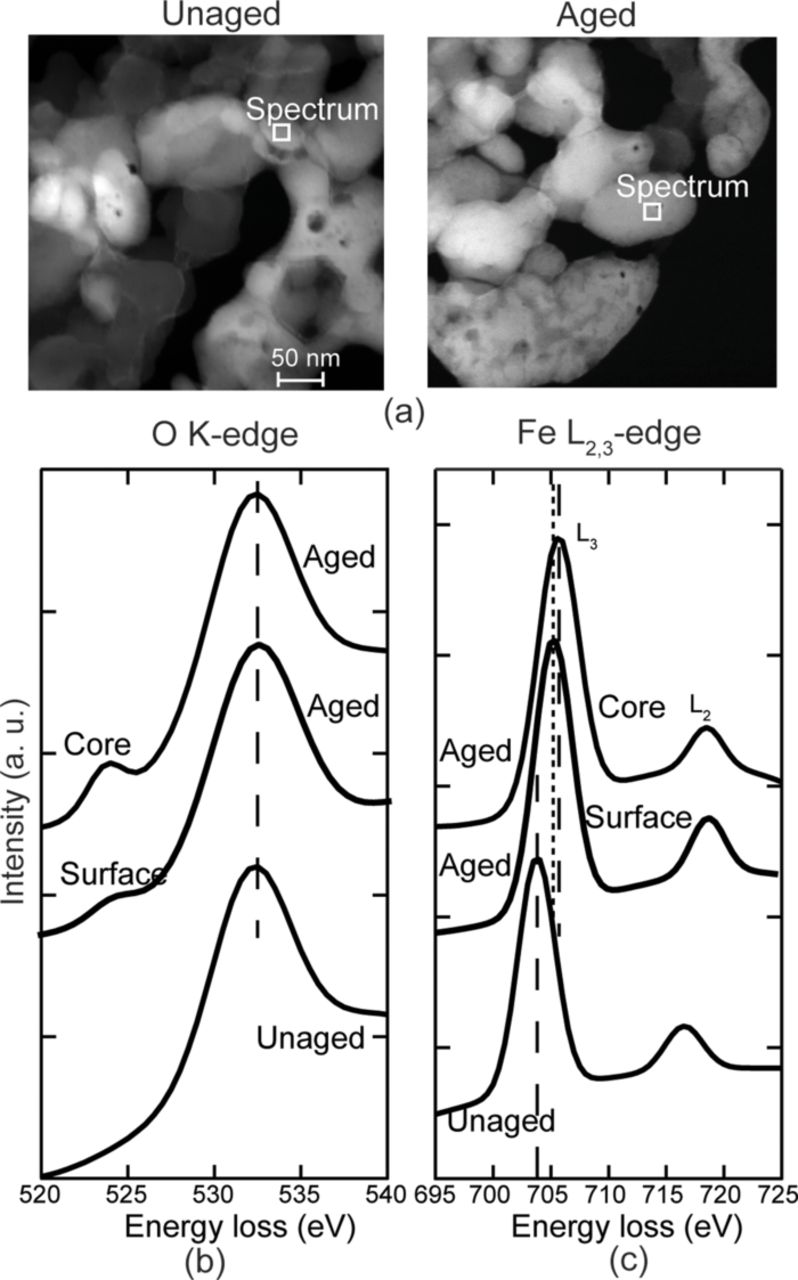
Figure 32. (a) TEM images of unaged and aged LiFePO4 cathode samples showing the location of EELS spectrum (b) and (c). (b) O K edge of the unaged and aged LiFePO4 cathode samples. There exists a pre-peak in the case of the aged sample suggesting a change in the density of states of O. (c) Fe L2,3 edge of the unaged and aged LiFePO4 cathode samples. The edges shift to the right in case of the aged sample. The EELS data was normalized with the O L2,3 edge peak. The individual spectra were offset vertically in order to present the details.68
The differences in the shape of the O K edge and the position of the Fe L2,3 edge have been explained in previous spectroscopy work by Laffont et al.160 and Miao et al.58 The pre-peak at the O K edge and the shift to higher energy of the Fe L2,3 edge observed in the aged sample is characteristic of a highly delithiated LiFePO4 (a charged cell), while the spectra observed in the unaged sample is characteristic of a well lithiated LiFePO4 (a discharged cell). Since in this study both samples were discharged before disassembly, it is believed the phenomena observed here is due to the aging of the cells. The measurements suggest that the core of the larger, coarsened LiFePO4 particle in the aged sample has a different lithium composition than the periphery. It is thus believed that during aging the LiFePO4 nanoparticles sinter together resulting in coarsening of the particles. This coarsening is expected to increase the Li-ion diffusion length through the particles, and thus the transformation of nanoparticles during discharging of the cell from FePO4 back to LiFePO4 is expected to be incomplete, leaving an FePO4 (or low Li-concentration) core and a LiFePO4 shell around the core in large particles. As the cell ages the FePO4 (or low Li concentration) core increases and the LiFePO4 shell decreases. This leads to the conclusion that the aging has caused significant compositional changes in the LiFePO4 nanoparticles. The active lithium is lost from the host cathode material, thus reducing its capacity. The diminished levels of Li in the cathode can be expected to lead to a compromised capability of the overall cell to recharge.
The electronic structure calculations were performed on supercells containing six formula units of LixFePO4 with x = 0, 0.25, 0.5, 0.75, and 1 for detailed analysis and interpretation of the experimental results. The structural data for the starting materials in these calculations were adapted from Tang and Holzwarth.198 LiFePO4 forms an orthorhombic olivine structure with a slightly distorted hexagonal close packed oxygen array belonging to the symmetry group Pnma,199 listed as no. 62 in the International Tables for Crystallography.200 Figure 33 shows the crystal structure of this material with one unit cell constructed with Materials Studio. The O atoms are located at the tetrahedral sites around each P atom. The divalent Fe ions form an octahedral arrangement with the O atoms. The Li atoms are located in channels along the b axis of the orthorhombic structure.198
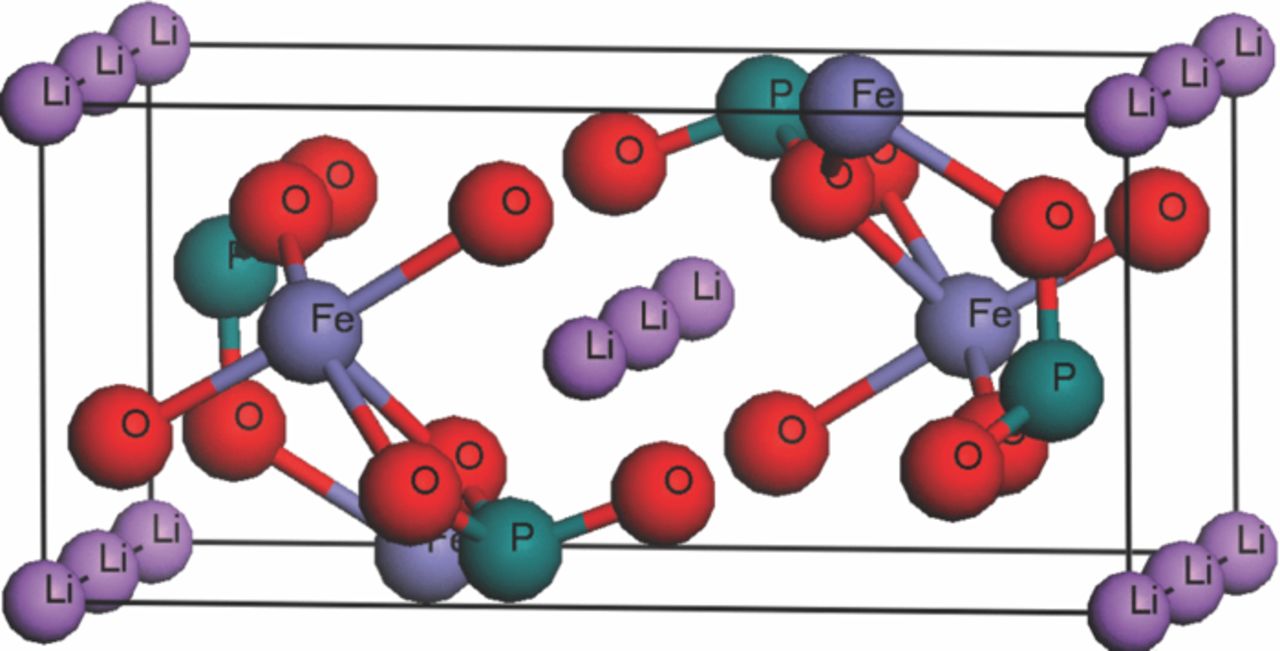
Figure 33. Crystal structure of LiFePO4 showing one unit cell constructed with Materials Studio.68
The density functional theory (DFT), as implemented in the Vienna Ab-initio Simulation Package (VASP)201,202 was employed to perform the electronic structure calculations within the generalized gradient approximation (GGA) with a PW91203 type projector augmented wave (PAW) potentials using a cutoff energy of 500 eV, enhanced by a coulombic term U204 to include strong correlation effects (GGA + U) for the Fe d orbitals. Within this framework the exchange term U is combined with the coulomb term U and (U − J), an effective value of U referred to as Ueff, is used. A value of 4.3 eV was chosen for Ueff following Miao et al.58 All the calculations here have been performed for the ferro-magnetic configuration for consistency. An energy convergence of better than 10−6 eV was achieved when relaxing the geometry. The initial and relaxed lattice parameters for structures with varying lithium contents calculated with the GGA + U approximation are shown in Table VII.
Table VII. Initial lattice parameters and relaxed lattice parameters for structures with varying lithium content obtained by generalized gradient approximation (GGA) with PW91 type of pseudopotentials, enhanced by a U term to include strong correlation effects (GGA+U). The structural co-ordinates were adapted from Tang and Holzwarth198 for FePO4 and LiFePO4, while the intermediate structures were created by subsequently removing lithium from LiFePO4 structure.68
| a-lattice(Å) | b-lattice (Å) | c-lattice (Å) | ||||
|---|---|---|---|---|---|---|
| Compound | initial | relaxed | initial | relaxed | initial | relaxed |
| FePO4 | 9.81 | 9.946 | 5.79 | 5.891 | 4.78 | 4.866 |
| Li0.25FePO4 | 10.33 | 10.041 | 6.008 | 5.947 | 4.69 | 4.861 |
| Li0.5FePO4 | 10.33 | 10.203 | 6.008 | 5.993 | 4.69 | 4.806 |
| Li0.75FePO4 | 10.33 | 10.324 | 6.008 | 6.026 | 4.69 | 4.787 |
| LiFePO4 | 10.33 | 10.418 | 6.008 | 6.067 | 4.69 | 4.745 |
Following Duscher et al.,205 the Z + 1 approximation method has been applied to simulate the electron energy loss near edge structure (ELNES). The ELNES onset was set up at the Fermi energy of the different structures. This approximation has been shown to model core hole excitation spectra in oxides well if dipole selection rules are used (change in orbital angular momentum quantum number by one).205,206 Integration for the angular momentum resolved conduction band density of states (DOS) has been performed using the tetrahedron method with Blöchl corrections for 6 formula unit supercells created from the geometrically relaxed unit cells, with a 4 × 4 × 4 Monkhorst-Pack k-point mesh for Brillouin zone sampling for the supercells.207
Figure 34 shows ELNES for the O K edge and Fe L2,3 edge obtained by the first-principles calculations. A small pre-peak for the O K edge is found for FePO4, which is not found in structures with LixFePO4 (x > 0). This is in agreement with the observed experimental trend presented in Fig. 32b. For the Fe L2,3 edge (Fig. 34b) a peak shift toward higher energies can be observed with decreasing lithium content, which has also been observed in the experimental results (Fig. 32c). For FePO4 with no lithium, the calculated EELS shows a reverse shift in the Fe L2,3 edge, in agreement with Miao et al.,58 which the band structure calculations suggest could potentially be due to the fact that Li acts as a donor in FePO4, causing a shift in the Fermi level.
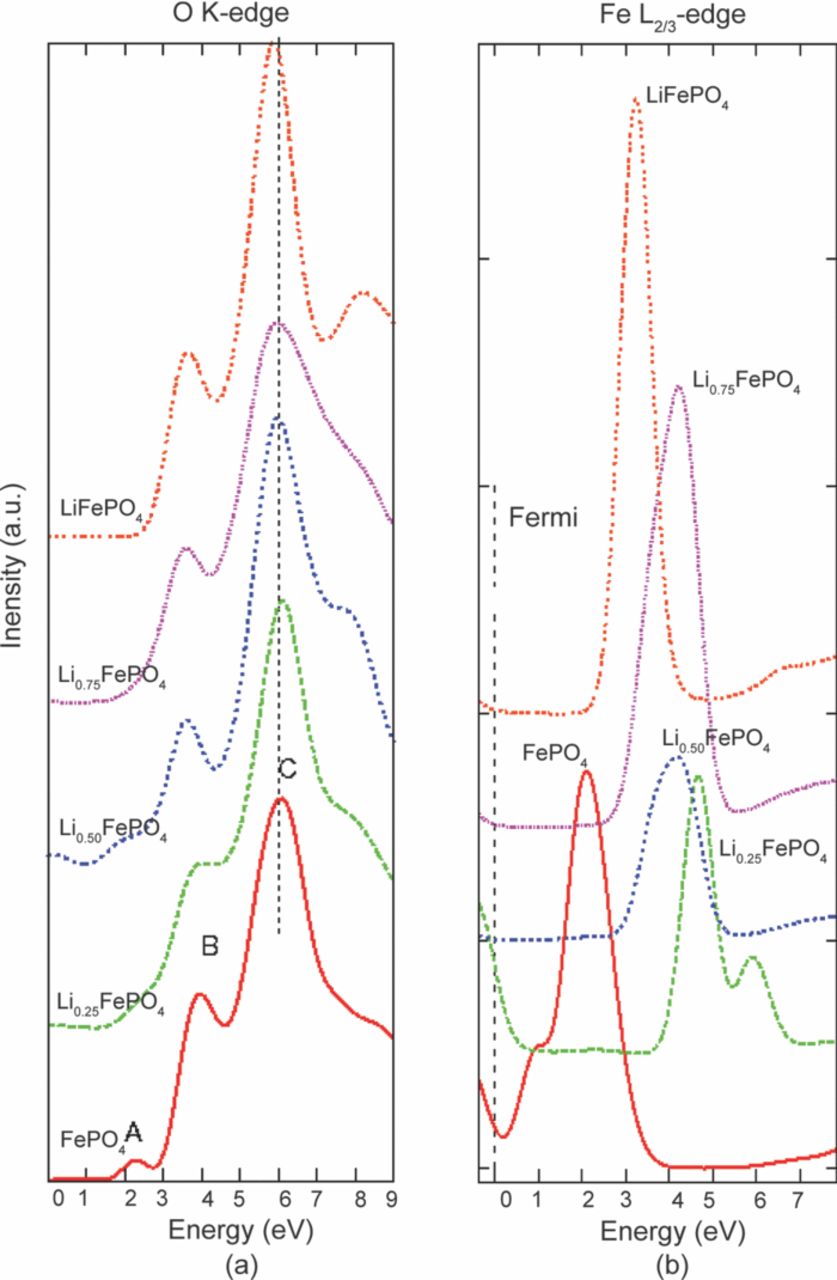
Figure 34. (a) The O K edge electron energy loss near edge structure (ELNES) calculated within the Z+1 approximation and dipole selection rules using the Vienna ab-initio simulation package (VASP). (b) Analogous calculation of the Fe L2,3 edge ELNES. The energies are set at the Fermi energy, which is 0 eV on the x-axis. The ELNES intensities were normalized to the O K edge peak. The individual spectra were offset vertically in order to present the details.68
Figure 35 shows O p states, Fe d states, and P s and p states and their hybridization based on band structure calculations. In a perfectly ionic state the O ions in FePO4 could be expected to have a valence of 2 with fully filled 2p states. Covalent bonding, however, leads to hybridization between the Fe 3d, O 2p, and P 3s and 3p states, giving rise to empty states (above the Fermi level) with some O 2p states. This can be seen from Fig. 35, where the atom resolved DOS, obtained from first-principles calculations, has been plotted for three compositions: FePO4, Li0.5FePO4, and FePO4. In all three compounds the valence band just below the Fermi level (region 1 in Fig. 35) has major contributions from the O 2p states with some Fe 3d states. The conduction band just above the Fermi level (region 2 in Fig. 35), on the other hand, is dominated by Fe 3d states with small contributions from O 2p states. Moving to higher energy bands (>10 eV, region 3 in Fig. 35), antibonding states are found with O 2p, 3s, and 3p states. In FePO4 the contribution of O 2p states in region 2 is significant and gives rise to the pre-peak A observed in the simulated O K edge EELS spectra, shown in Fig. 34a, due to transitions from the 1s core orbital of oxygen. The O 2p states present in region 3 gives rise to peaks B and C seen in Fig. 34a, after core hole corrections which shift these states toward lower energies by approximately 3 eV.
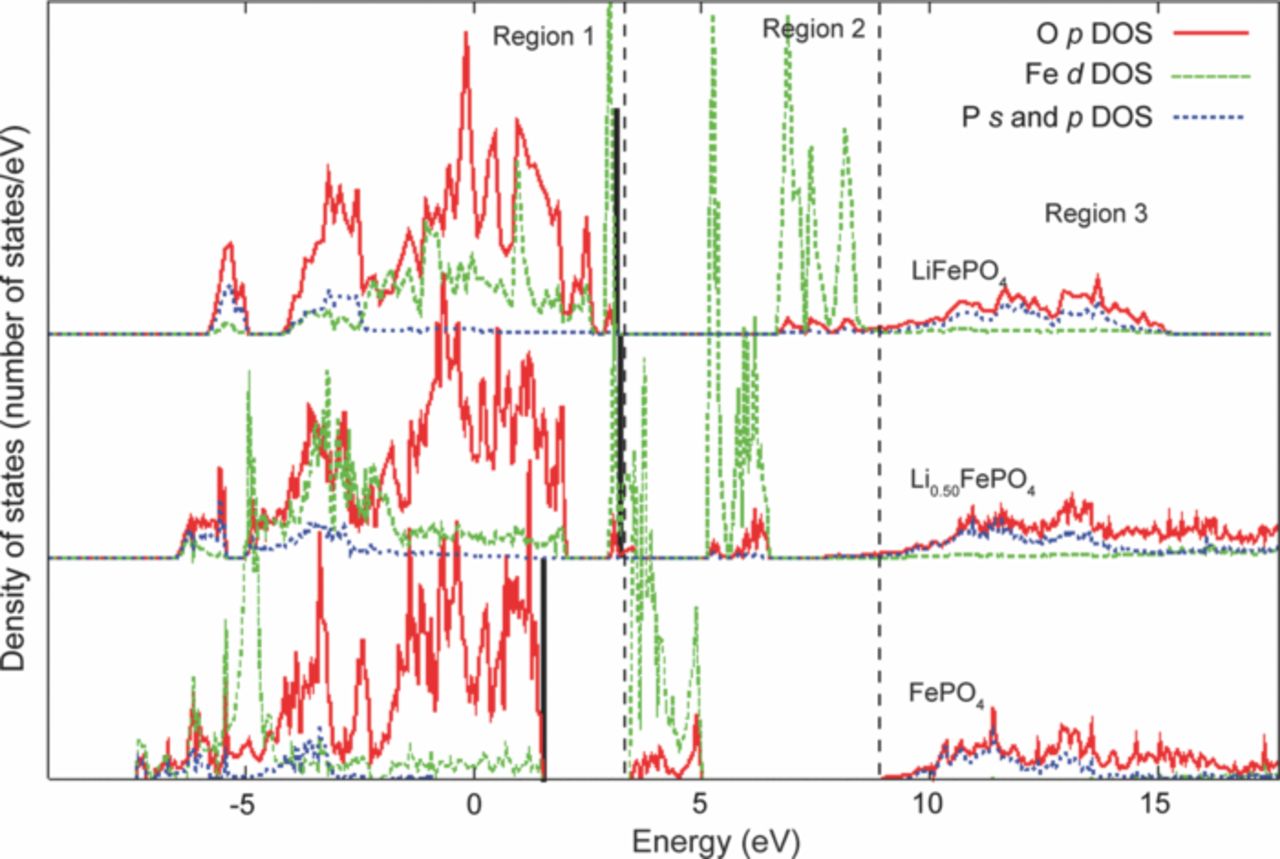
Figure 35. O p states Fe d states, and P s and p states and their hybridization showing how the states move with Li concentration and thus give rise to variations in the intensity of O K edge pre-peak. The black line is the Fermi level given by Vienna Ab-initio Simulation Package (VASP).68
While Li addition does not affect the positions of peaks B and C, it does lead to a continuous decrease in the intensity of pre-peak A, as observed in both the experimental (Fig. 32b) and simulated (Fig. 34a) O K edge EELS spectra. This can be attributed to the following two causes. Firstly, on addition of Li the Fe 3d states shift to higher energies (from ∼3–5 eV in FePO4 to ∼6–8 eV in LiFePO4) because of the reduction in the oxidation state of Fe from Fe3+ to Fe2+ (region 2 in Fig. 35). Secondly, it leads to a continuous decrease in the extent of hybridization between Fe 3d and O 2p states, such that the contribution of O 2p states in region 2 becomes negligible in LiFePO4. This analysis is similar to the arguments put forward by Kinyanjui et al.,208 who studied only the end compounds. Based on the decrease in intensity of pre-peak A with Li addition, the pre-peak is expected to be completely absent for Li concentrations greater than ∼75%. Similarly, in the case of Fe L edges the intensities of the sharp lines themselves scale with the number of unoccupied 3d states of the Fe atom. In the aged sample the shift is ∼2 eV. According to the first principles simulations presented, this would correspond to a reduction in Li content of ∼80%. Thus, the FePO4 core and LiFePO4 shell, co-exist within large particles, and as the cell ages the FePO4 (low Li content) core expands while the LiFePO4 shell decreases.
The energy at the Fe L2,3 edge peak obtained from first-principles calculations was plotted against the Li concentration in LixFePO4 in Fig. 36. The shift to higher energy in the location of the Fe L2,3 edge peak follows a linear trend with an approximate slope of −1.9 eV with increasing Li concentration. Considering the experimental shift of ∼2 eV between the unaged and aged samples, this would indicate a Li loss of ∼80% in the aged sample. Since complete Li depletion from LiFePO4 would lead to a downward rather than the observed upward peak shift, the calculation here indicates that the aged sample is not completely Li depleted, but rather remains at a low Li content of ∼20%.
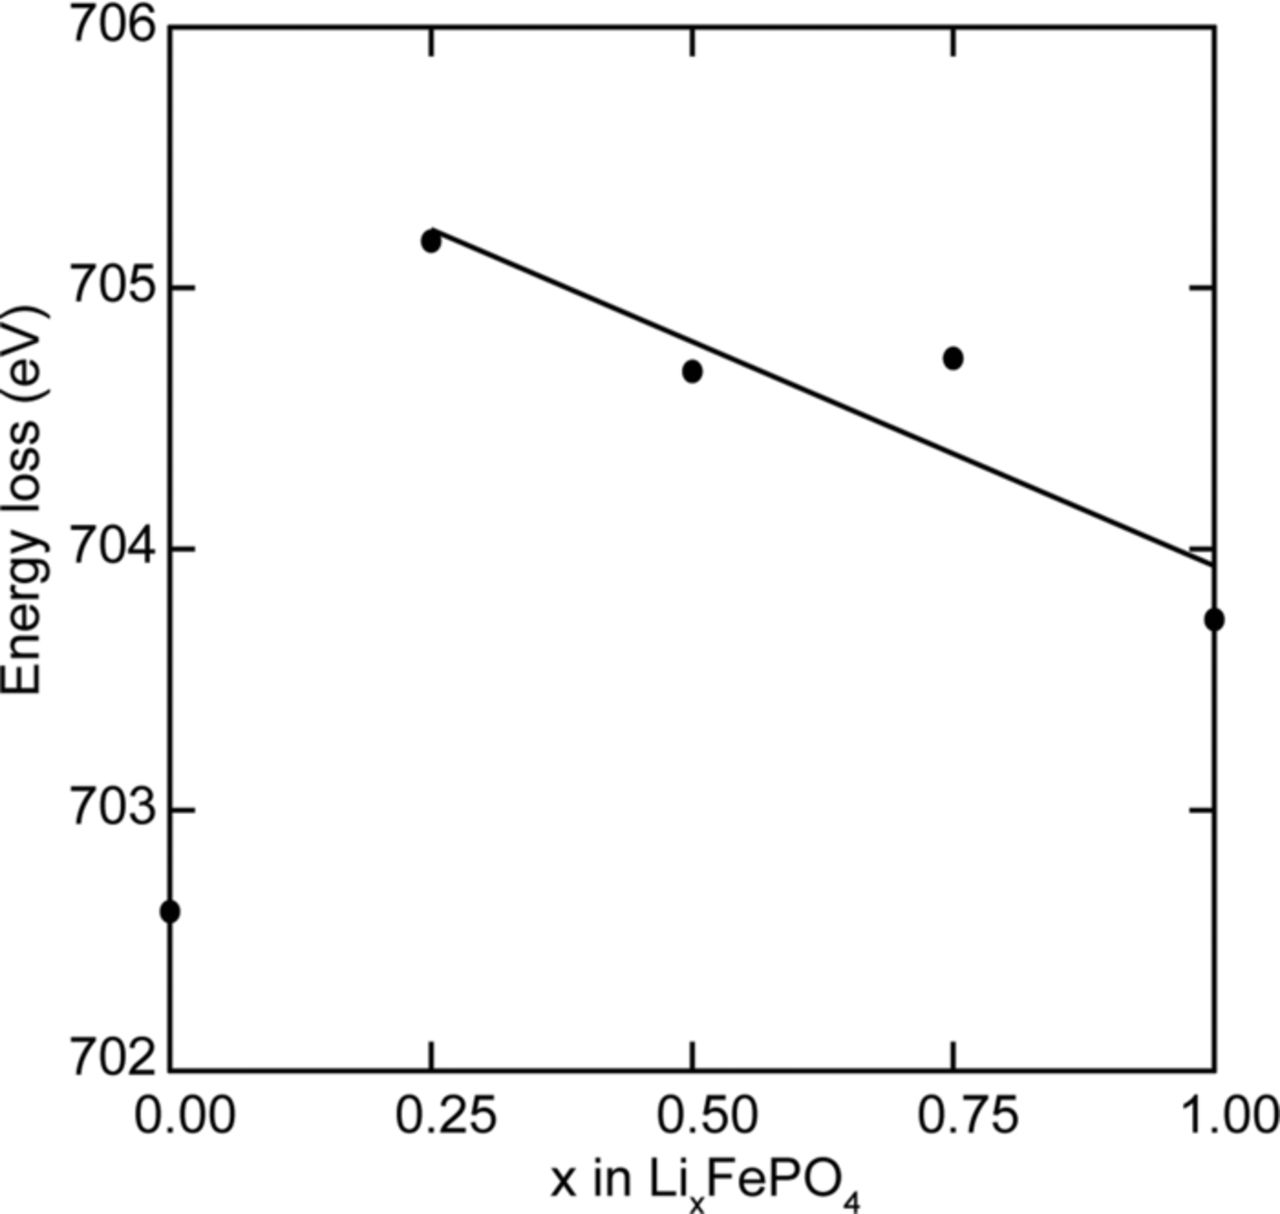
Figure 36. Calculated energy at the Fe L2,3 edge peak vs. Li concentration in LixFePO4. The data fits a straight line with slope −1.9 eV. Based on this plot it is estimated that the aged sample was Li0.2FePO4.68
To summarize, the EELS measurement showed that the density of states for O changes as the cell ages. This was evident in the presence of the pre-peak in the case of the O K edge. The increase in the ratio of the pre-peak to the O K edge peak in the EELS data from the core to the surface of the large LiFePO4 particle indicates different lithium composition within the particle. There is also a shift of almost 2 eV for the L2,3 edge of Fe in the aged sample. At a certain age of the cell the particles start to coarsen. The ion diffusion length is expected to increase in the coarser particles, and this is expected to lead to an incomplete transformation between LiFePO4 and FePO4 while charging and discharging. The FePO4 core is expected to expand in subsequent cycles, thus reducing the capacity of the host cathode material.
The experimental results were analyzed with the help of simulated ELNES spectra for the olivine structure (space group Pnma) of LixFePO4 with x = 0, 0.25, 0.5, 0.75, and 1. The nature of the O pre-peak was confirmed by comparing the position of the O 2p bands arising due to strong hybridization among the O p states, Fe d states, and P s and p states with the Fermi level position. The Li loss was quantified by these calculations as 80%, suggesting a strongly Li depleted, but not completely Li free, core region in the coarsened particles.
Loss of cyclable lithium
Loss of cyclable lithium is considered as the main reason for capacity fade in Li-ion batteries.73,74,209,210 In lithium-ion batteries, Li is the most important element as it is directly involved in the electrochemical process during the charging and discharging cycles of batteries. Hence, understanding the Li concentration, as well as the local crystallographic and electronic structure of Li within the host LiFePO4 structure, is critical to predicting the performance of the lithium-ion batteries in terms of operating voltage, residual capacity, and rate capability. In the previous section loss of Li was demonstrated through indirect measurements with EELS. The common electron spectroscopy techniques fail to identify and qualitativly measure lithium within the sample. The energy dispersive spectroscopy (EDS) technique, which is commonly used to identify the atomic percent of the elements in the component, fails to detect Li. The EDS detectors are very sensitive to impurities. To avoid repeated exposure of the detectors to atmosphere, they are maintained under a vacuum and are separated from the column vacuum in the electron microscope by a beryllium window. The thin beryllium window on the EDS detector absorbs low energy X-rays and thus prevents the use of EDS in the detection of elements with an atomic number less than five. EELS provides an indirect method to probe the lithium and its local environment within the sample. The EELS studies have showed the change in the density of states of O in the aged LiFePO4 cathode sample and the subsequent loss of Li from the host LiFePO4 structure. XRD techniques are useful in identifying the phases of the LiFePO4 material present in the cathode and long-range structural data. However, it lacks the ability to provide local crystallographic and electronic structure of lithium within the sample.
Therefore neutron based techniques such as neutron imaging, neutron depth pro- filing (NDP) or NMR, etc. prove vital in studying lithium within the sample because neutrons have high penetration power and detectors do not require any special protection from the environment.59,211 Among these neutron techniques, NMR can play a vital complementary role to study cathode materials in lithium-ion batteries as it directly probes the local Li environment.212 NMR and NDP have been used in characterizing the lithium content in the electrode samples harvested from aged large format Li-ion cells.
Nuclear magnetic resonance (NMR)
Solid state NMR is extremely useful for studying the local structure in ordered and disordered materials. Solid state Li NMR in particular is very useful due to its high sensitivity toward the atomic and electronic environment at the lithium site within the host cathode structure.213 NMR can distinguish between the metallic and semiconductor behavior of the materials. While probing the local and electronic environment of the nuclear probe it can also monitor the electronic structure of the surrounding cations.212 In NMR spectroscopy it is also possible to quantify the species taking part in battery charging and discharging, and monitor the effect on the local structural changes of these species as the function of the aging of the battery. Due to its sensitivity toward the local electronic structure it can also distinguish between diamagnetic and paramagnetic behavior of materials. Most of the materials used as cathode in lithium-ion batteries show paramagnetic behavior in charged and discharged state.214
The naturally abundant 7Li isotope (93%) has larger quadruple and gyromagnetic moments as compared to the less abundant 6Li (7%) isotope. The quadruple interactions result from the interactions between the quadruple nucleus and the electric field gradient at the nucleus. The quadruple interactions of 6Li are smaller compared with 7Li but they result in higher resolution spectrum that is easier to interpret.214 Thus the coupling between the lithium nucleus and the unpaired electrons can be exploited in magic angle spinning (MAS) NMR to study the changes in the local electronic structures as the function of the battery aging in the paramagnetic cathode materials.
Given these advantages of NMR, it has been used by several researchers to study different types of cathode materials. Layered oxides such as LiCoO2 and LiNiO2 have been studied by Dahn et al.,215 Marichal et al.,216 Levasseur et al.,217 and Carlier et al.218,219 The spinel structured materials, such as LiMn2O4, have been studied by Morgan et al.,220 Gee et al.,221 Lee et al.,222,223 Lee and Gray,224 Tucker et al.,225 and Verhoeven et al.226 The spinel structured materials, such as LiFePO4, have also been studied by Gaubicher et al.,227 Tucker et al.,213,225,228 and Arrabito et al.229 The goal in these studies has been to understand and predict the effect of local and electronic structure on lithium NMR shift in these battery materials. In situ NMR studies using a toroid detector with limited resolution have also been conducted by Gerald et al.230 Chevallier et al.231 have also shown that NMR signals from plastic bag batteries can be successfully obtained for analysis.
In the multi-scale characterization plan a magic angle spinning (MAS) nuclear magnetic resonance (NMR) with 7Li probe was used to probe the presence of lithium in the unaged and aged cells by Nagpure et al.69 Since Li is vital in charging and discharging of the batteries, NMR can provide a vital understanding about its local environment within the host structure and any changes to the structure due to aging during cycling of the cells.
A Bruker DSX 300 MHz NMR spectrometer was used to probe the lithium in LiFePO4 nanoparticles. A 7 mm triple resonance MAS probe was tuned to the 7Li frequency of 38.9 MHz. The shifts in the 7Li were referenced with 1 M LiCl(aq) solution. The Bloch Decay experiment method was used with relaxation delay of 10 s and spin rate of 10 kHz.
Figure 37 shows the NMR spectra for C0 and C6 samples. In the case of the C0 sample a single isotropic 7Li peak is observed while this peak is absent in the case of the C6 sample. The NMR spectra of C0 shows a small chemical shift of ∼8 ppm. There is also considerable broadening of the peak. The multiple spinning side bands accompanying the isotropic peak observed by Tucker et al.213,228 are not observed in this case. The single isotropic band indicates one local environment for the lithium in the case of C0. The crystal structure of the LiFePO4 was shown in Fig. 33. LiFePO4 shows a paramagnetic behavior and the single isotropic peak in C0 is as expected for paramagnetic materials containing a single type of Li site. Lithium NMR spectra for paramagnetic materials are dominated by series of larger interactions, such as quadruple coupling (6Li, I = 1; 7Li, I = 3/2) and hyperfine interactions between nucleus and the unpaired electrons.214 The possibility of a Knight shift in the battery materials is excluded due to their electronic insulating character.228
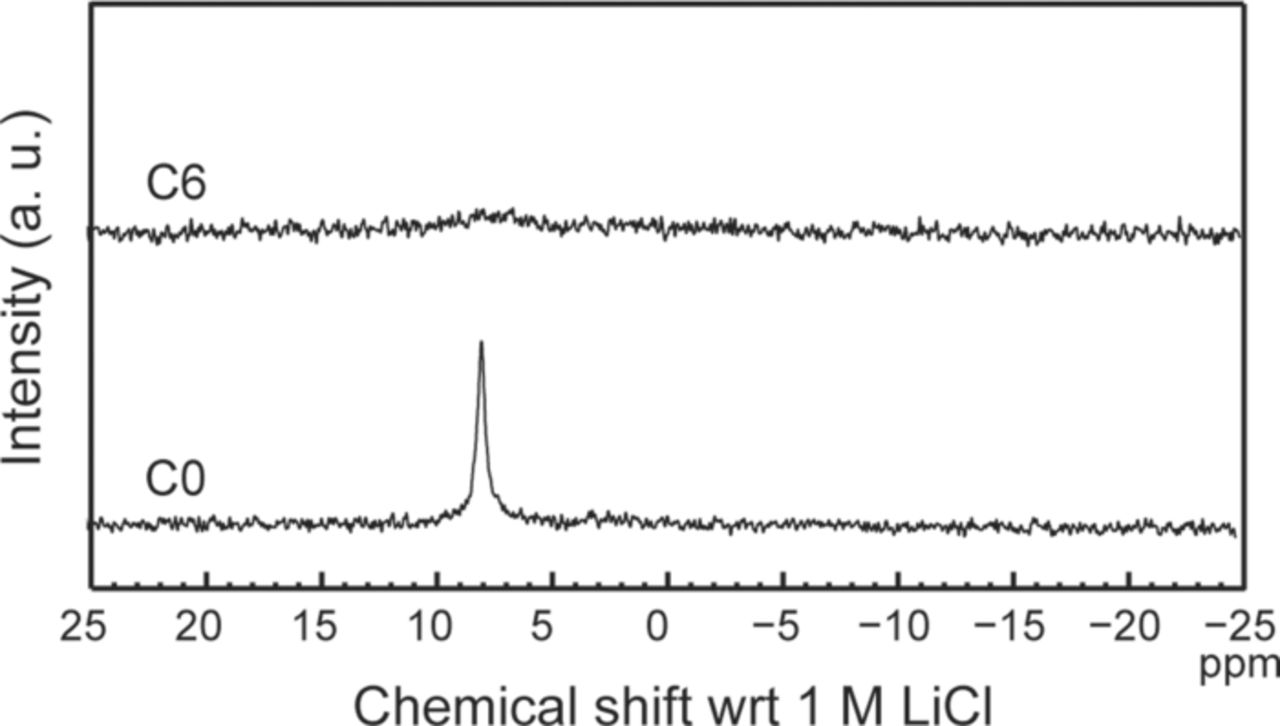
Figure 37. NMR spectra of samples harvested from C0 and C6 batteries. An isotropic 7Li peak is observed in C0 while similar speak is absent in C6.69
According to Tucker et al.213,228 the shift in the case of LiFePO4 can be attributed to the hyperfine interactions through-bond transfer (specifically Li-Fe-O bond) of the unpaired electron density via the oxygen p-orbitals to the Li s-orbitals. Since LiFePO4 is electronically less conductive the Knight shift characteristic of metal conductors is ignored for this material. The broadening of the peak can be attributed to the considerable local disorder in the coordination sphere of Li in LiFePO4.213 The absence of a peak in the case of the C6 samples indicates the presence of FePO4 instead of the LiFePO4 phase. This is consistent with an observation by Nagpure et al.,68 using EELNS. The Li depletion in the case of the aged samples caused the changes in the local electronic structure of the sample. The Li depletion in the aged sample caused the transitions from the 1s core orbital of oxygen and strong hybridization between the Fe 3d, O 2p, and P 3s and 3p states, giving rise to empty states (above the Fermi level) with some O 2p states. The lithium starved FePO4 phase indicates loss of cycling capability of the battery.
In summary NMR was used to probe the local Li environment of the LiFePO4 nanoparticles. The solid state 7Li NMR is very critical in studying the local environment and electronic structure of the LiFePO4 nanoparticles as it directly probes the Li within the sample. An isotropic peak with a small chemical shift, a characteristic of paramagnetic materials, is observed in the unaged LiFePO4 sample. The absence of such a peak in the aged sample indicates the Li starved FePO4 phase. The loss of active Li directly affects the loss of cycling capacity of the battery.
Neutron depth profiling (NDP)
NDP is a very useful technique in studying the concentration of lithium within the sample. It is a non-destructive analytical technique based on the nuclear fission reaction between beams of neutrons with certain elements, such as lithium, throughout the sample. The cold neutrons are delivered through a neutron guide to the NDP chamber. In this work, the cold neutrons refer to neutrons with energy less than 5 meV. Since cold neutrons have extremely low energy and momentum, there is no center-of-mass motion in the neutron-lithium reaction. Furthermore, the neutron event rate is insufficient to cause significant temperature rise in the sample, nor is there significant radiation damage to the sample during the measurement period.
Ziegler et al.232 for the first time used the nuclear reaction experiment to determine the concentration of boron impurity in silicon wafers. The sample was bombarded with a well-collimated beam of low energy neutrons in a vacuum, and the emitted energized particles were analyzed using a charged-particle spectroscopy for the concentration profile of the 10B in the sample. Later, Downing et al.233 coined the term neutron depth profiling (NDP) for this technique. Since then there have been several applications of this technique to other neutron sensitive light-weight isotopes, some of which are listed by Downing et al.234 Biersack and Fink235 were first to study the implantation of lithium in semiconductors using NDP. Later on Krings et al.236 studied lithium diffusion in electrochromic WO3 films using NDP. They compared the secondary ion mass spectrometry (SIMS), elastic recoil detection (ERD), and NDP techniques while profiling the lithium concentration along the depth of lithium intercalated thin electrochromic WO3 films. They concluded that the NDP technique has a very good depth resolution with high sensitivity, and proves to be very useful over the other techniques because of its non-destructiveness. Lamaze et al.237 have demonstrated the use of NDP in two thin film battery materials. They profiled the lithium concentration in ion beam assisted deposition (IBAD) thin lithium phosphorus oxynitride films and thin lithium cobalt oxide films. The main advantage was again the non-destructive nature of the NDP technique. The study was limited to the deposited thin films rather than electrodes extracted from actual lithium ion cell.
Whitney et al.238 used NDP to profile the lithium concentration in a cathode of the Li-ion lab cells and in an anode of the off-the-shelf Li-ion cells. The lithium transportation was studied for storage of cells at different temperatures and cycling of the cells at different rates. They demonstrated a method to determine the thickness of the solid electrolyte interface on a graphite anode in a LiFePO4 cell when stored for different lengths of time under different temperatures. They also profiled the lithium concentration in LiFePO4 and LiNi1/3Mn1/3Co1/3O2 cathodes after cycling for only 100 cycles. This helped to understand the lithium distribution in initial cycles, but did not address the issue of lithium transportation during the end of life of the cells.
Nagpure et al.67 used the NDP technique in the multi-scale characterization plan for detailed analysis of the lithium concentration in the commercial cells. The effect of C-rate on the lithium concentration toward the EOL of the battery was measured. All NDP experiments discussed here were conducted at the NIST Center for Neutron Research (NCNR). A schematic of the NDP facility is shown in Fig. 38. The sample is attached to an aluminum disk (Fig. 38) which is held vertically at the center of a vacuum chamber by the grooves provided on the sample mount. The sample mount is oriented such that the sample faces the surface-barrier type charged particle detector. The detector has an active area of 150 mm2 and is placed slightly more than 10 cm from the neutron beam-spot on the sample. An area of ∼0.8 cm2 of the sample is illuminated by the cold neutron beam entering the vacuum chamber. Upon the absorption of the neutron by the elemental atom in the sample, monoenergetically charged alpha and triton particles are emitted and travel diametrically opposite from the site of the reaction. More specifically, when the neutron reacts with the 6Li atom in this sample, monoenergetically charged alpha (4He) and triton (3H) particles are emitted as shown in the reaction below,
![Equation ([7.5])](https://content.cld.iop.org/journals/1945-7111/160/11/A2111/revision1/jes_160_11_A2111eqn19.jpg)
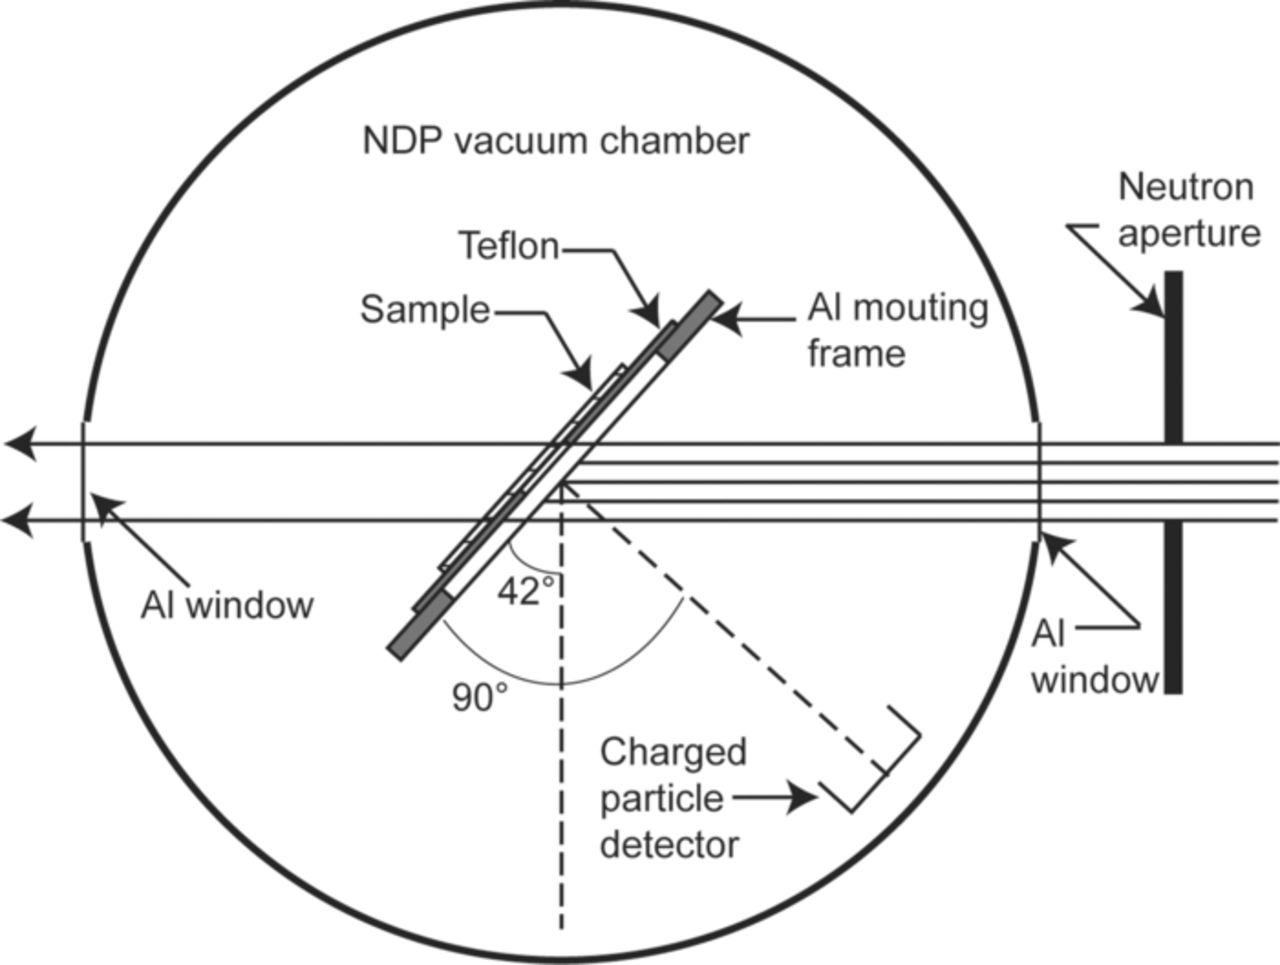
Figure 38. A schematic layout of the cold neutron depth profiling chamber at NIST (adapted from Tun et al.285). At the center of the chamber the sample is mounted using a 21 cm diameter aluminum ring shaped disk concentrically covered with a thick dielectric sheet. The dielectric has a 1 cm dia. hole at the center of the disk, which serves as the defining window for charged particles exiting from the sample in the direction of the detector.67
The energy of the 4He and 3H particles at the reaction site is known to be at 2055 keV and 2727 keV, respectively.234 These heavy charged particles lose energy via a stochastic collision with electrons along the path traveling outwards. Both, the count rate and the residual energy are simultaneously measured from all depths for the particle species emerging in the direction of the detector (Fig. 38). The charged particles do not lose any energy after leaving the surface of the sample traveling to the detectors, since the sample chamber is maintained at a vacuum less than 1.33 mPa (10−6 Torr). Calibration performed prior to the experiment determined the full width half maximum (FWHM) energy resolution of 18 keV for the charged particle detector. The samples were exposed to the neutron beam for various time lengths ranging between 3 to 4 hours. The exposure time was not fixed so the data was normalized with respect to the run time, but the samples were exposed long enough so that the statistical error in counting of the 4He or 3H particles is no higher than 3%.
The reaction center of mass coincides with the site of the lithium atom. Thus the 4He and triton 3H particles originate from the same location as that of the original lithium atom, and their respective energies are directly related to the location of the lithium atom in the sample. The energy loss of the charged particle per unit length traveled through the sample is given by the stopping power function of the sample. Mathematically, to the first-order approximation, the depth is related to the stopping power by Braggs law given as
![Equation ([7.6])](https://content.cld.iop.org/journals/1945-7111/160/11/A2111/revision1/jes_160_11_A2111eqn20.jpg)
Here x is the path length traveled by the particle through the material, E0 is the initial energy of the particle, E(x) is the energy of the particle emerging from the surface, and S(E) is the stopping power of the sample material.232 The Stopping and Range of Ions in Matter (SRIM) code developed by Ziegler et al.239 is then used to obtain the stopping power of the LiFePO4 cathode and the graphite anode and to assign the residual energies of the charged particle to the corresponding depth in the sample. The concentration of 6Li within the sample is determined by comparing the count rate observed from the sample with that of a well characterized boron concentration standard, labeled as N6.240 Since the natural abundance of 6Li in the sample is only 7.5%, the total Li elemental concentration is obtained by dividing the determined 6Li concentration by 0.075.
The energy spectrum of the 2727 keV 3H particle is used here because of its two advantages over the corresponding energy spectrum of the 2055 keV 4He particle. First, since the 3H particle has higher energy and less mass, the concentration profiles can be obtained to greater depth in the sample. Second, the 3H energy spectrum is not overlapped by the 4He energy spectrum, but the 3H energy spectrum interferes with the 4He energy spectrum at low energies, i.e., by the charged particles from greater depths below the sample's surface.
Figure 39 shows the lithium concentration profile in the anode and cathode of the various cells aged with different C-rates. The lithium profile obtained from cell C0 is established as the baseline for comparison. In the left column the lithium concentration profiles of the anode can be seen changing from section # 1 to section # 5 at the same C-rate. The surface concentration increases across the different cells with the C-rate. The right column shows the lithium concentration profile in the cathode. The profiles remain identical from sections 1 to 5 at the same C-rate, but the slope of the profile decreases with increasing C-rate.
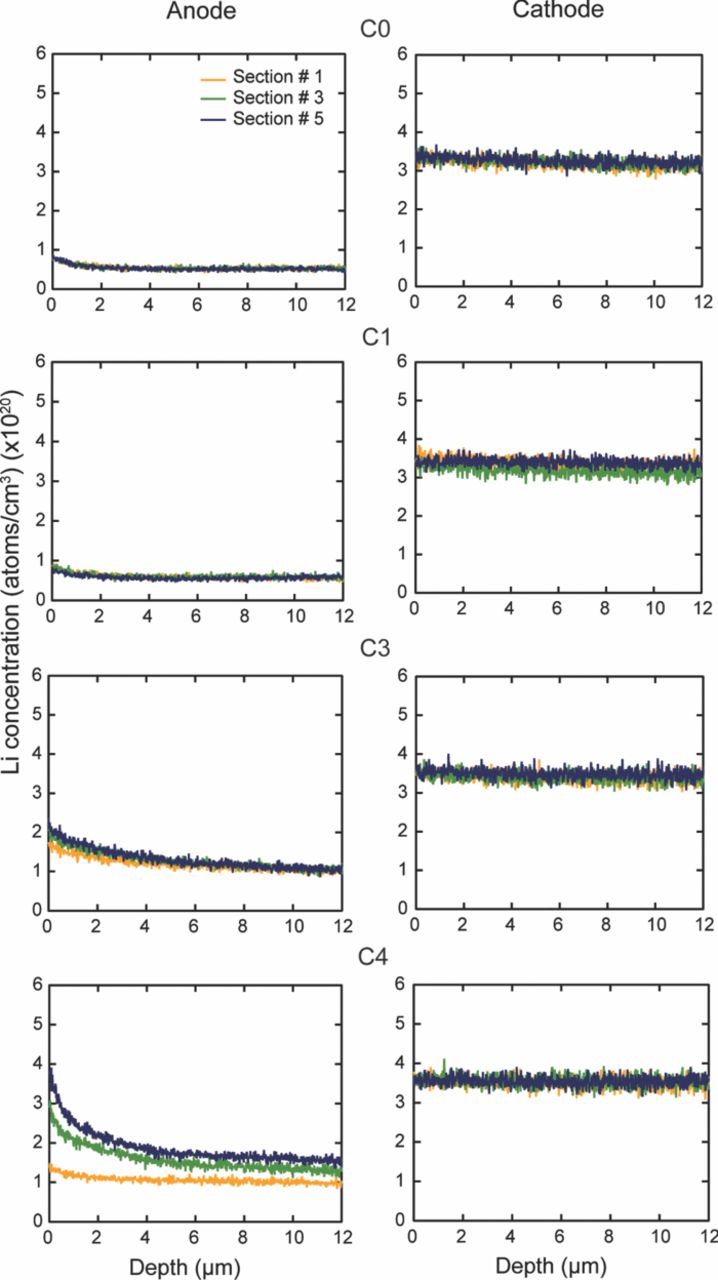
Figure 39. Effect of C-rate on the lithium concentration in anode and cathode. The profiles were measured in all six sections from C0, C1, C3, and C4; only profiles over section # 1, 3 and 5 are shown here. Based on the Li concentration profile in the anode, the lithium tends to build up at the surface of the anode samples aged with higher C-rates, whereas the lithium concentration drops along the thickness of the cathode anode samples. The SOC varies from 0 to 10%.67
Figure 40 shows the effect of the SOC combined with the C-rate on the lithium concentration profile. Fig. 40a shows the lithium concentration profile in the cell cycled between 60 and 70% SOC with ∼6 C-rate (C6) for sections # 1, 3, and 5. The lithium concentration profile in cell C4 (same as in Fig. 39) is shown again in this figure for comparison. In C6, even though the C-rate is high, the amount of lithium buildup near the surface of the anode is less as compared to C4. The prominent change of lithium concentration profiles in the anode from section # 1 to section # 5 observed in C4 is also absent in C6 except for minor deviations near the sub-surface. Similar to C4, the lithium concentration profiles in sections # 1, 3, and 5 of cell C6 are identical to each other. However the lithium concentration profile for C6 has dropped below the concentration profile in C4. Thus, the overall lithium concentration in the cathode has dropped significantly in C6 as compared to C4. Thus at a higher SOC and moderate C-rate, the lithium buildup on the surface of the anode is contained, but lithium is lost from the host cathode material. In Fig. 40b the lithium concentration profile in section # 5 of C16 is compared with C0. In this case cell C16 is cycled between 45 and 55%, but with a very high C-rate of 16C. It should be noted that cells C0 and C16 in this data were chosen from a different batch than the earlier cells. The basic chemistry was the same, but the initial lithium concentration in the cathode was much higher in these cells. The lithium buildup on the surface of the anode was very high in C16 compared to any other cell in this study. The concentration in the anode dropped across its thickness with a steep slope. The lithium concentration profile in the cathodes of cells C0 and C16 are identical, but the concentration of lithium in the cathode was significantly lower than in C0. Thus, at moderate SOC but very high C-rate the process of lithium buildup on the surface of the anode is enhanced while there is significant loss of lithium from the host cathode. These results suggest that a cell operating at high SOC and moderate C-rate has the least amount of lithium build up on the anode surface, and also the least amount of lithium is lost from the host cathode.
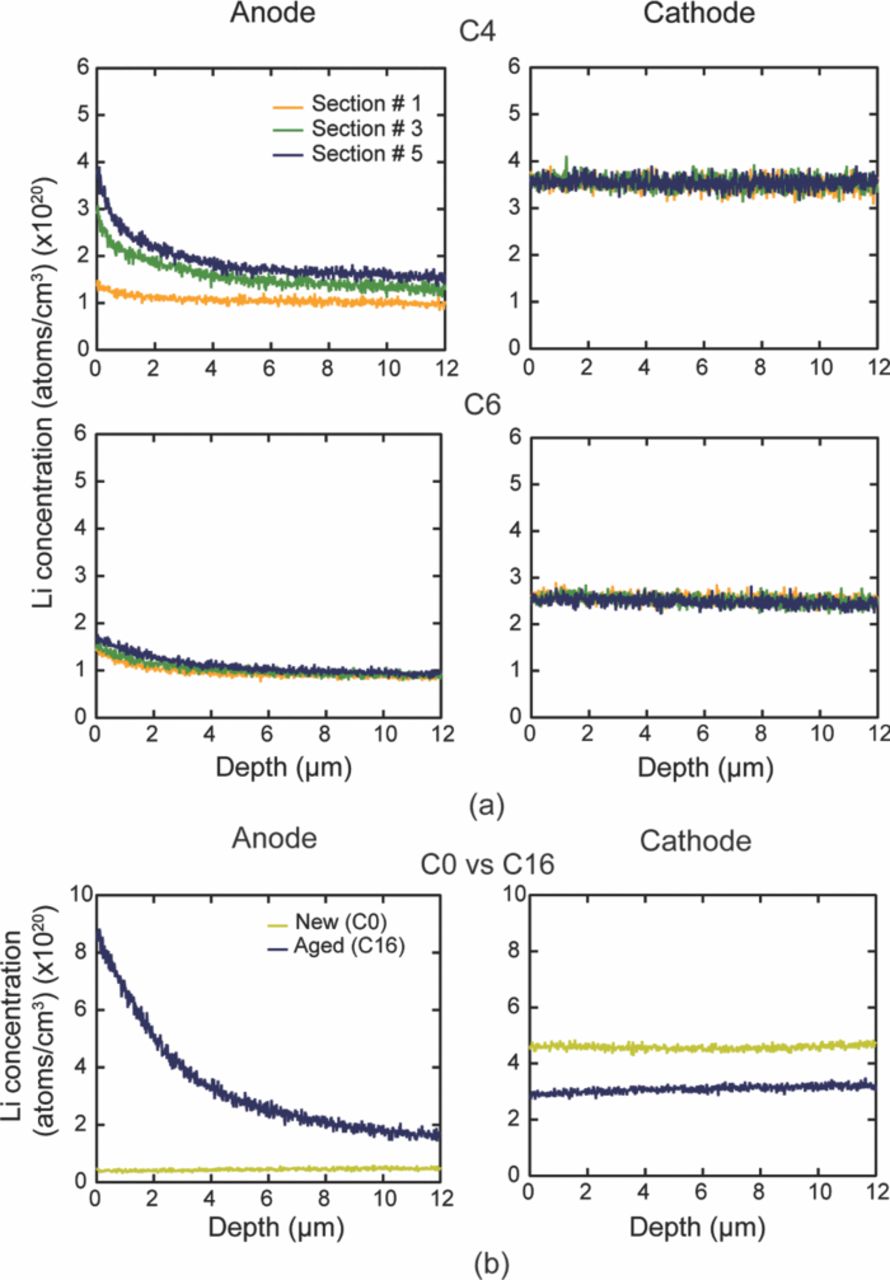
Figure 40. Effect of state of charge (SOC) and C-rate on the lithium concentration profile in anode and cathode, (a) in section # 1, 3 and 5 from C4 and C6, and (b) comparison between section # 5 from C0 and C16. The lithium buildup on the anode surface from a cell cycled at higher SOC is less but increases with increasing C-rate. The lithium concentration drops in the cathode with higher SOC and higher C-rate. The SOC varies from 0 to 10% for C4, 45 to 55% for C6, and 60 to 70% for C16 during cycling of the cell.67
Figure 41 shows the lithium concentration profiles obtained on section # 3 of cell C0 and C6 at various locations within the same section. The aim here was to identify any change in the lithium concentration profiles measured at spots away from the center of the given section. The lithium concentration profiles in the anode shown in the left column of Fig. 41 are similar for both cells at various locations on section # 3. This indicates that the lithium concentration in the anode does not vary along the height of the anode. The right column shows the lithium concentration profile in the cathode from both cells. The profiles for C0 measured at various locations on section # 3 are identical, but the profile measured at the center spot on the front side has a higher surface concentration and shows a higher gradient along the thickness than at any other location on the section # 3. The profiles for C6 measured at various locations on section # 3 are identical. Since the intensity and change in the lithium concentration in the unaged cell (C0) were greater at the center of the section, the measurements were taken at the center of each section throughout this study.
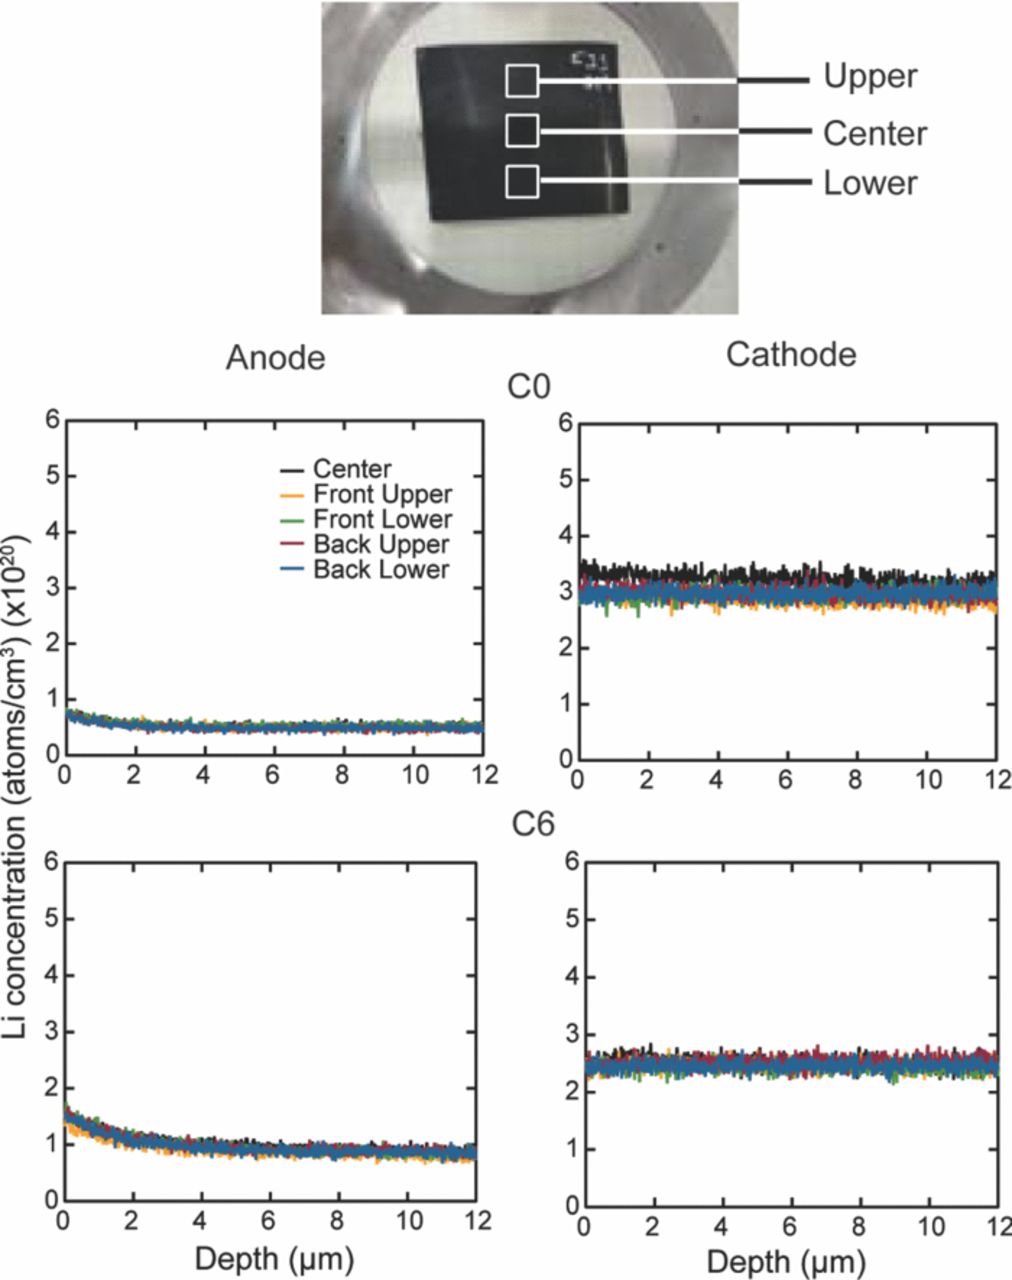
Figure 41. Lithium concentration profiles measured at different locations on section # 3 in the anode and cathode of C0 and C6 cell. The profiles were measured at three different spots along a straight line on one face (front) and on two spots on the opposite face (back). There is no change in the concentration profiles along the straight vertical line in a section.67
As expected for a completely discharged unaged cell (C0) (Fig. 39), the lithium concentration in the anode is significantly lower with little buildup of lithium at the surface, while most of the lithium is concentrated in the cathode. The lithium concentration profiles in the anode show higher surface concentration as the C-rate increases. The lithium concentration is at a maximum near the surface, and it decays exponentially with the depth (thickness) of the sample. The lithium buildup on the anode surface from a cell cycled at higher SOC is less, but increases with increasing C-rate. The lithium concentration drops in the cathode with higher SOC and higher C-rate. The lithium concentration profiles in the cathode show a uniform gradient, but the concentration decreases with increasing C-rate.
The analysis of the surface lithium concentration in the anode is shown in Fig. 42. As seen in Fig. 42a the surface lithium concentration is nearly constant over all the sections for C0 and C1. In the case of C3 and C4 the surface lithium concentration increases from section # 1 to section # 5. Thus the buildup of lithium on the surface of the anode is greater toward the core of the cylindrical cell than against the outer edge. For example, in the case of cell C4 where the highest change is observed, the concentration increases from 1.36 × 10²⁰ to 3.74 × 10²⁰ atoms/cm3 from edge to core. In Fig. 42b the effect of C-rate on the lithium concentration gradient in the anode is shown. The lithium concentration gradient increases with the C-rate. The lithium concentration gradient is very small in the case of cells C0 and C1 and is very prominent in the case of cells C3 and C4. The lithium concentration gradient in all cells exists only for a certain depth from the surface of the anode. The depth up to which the lithium concentration gradient exists in the anode also increases with the C-rate. In the case of cell C4 the lithium concentration gradient exists up to ∼1 μm in the anode. Thus with increasing C-rate not only does the lithium buildup on the surface increase, but the lithium build up in the sub-surface area also increases.
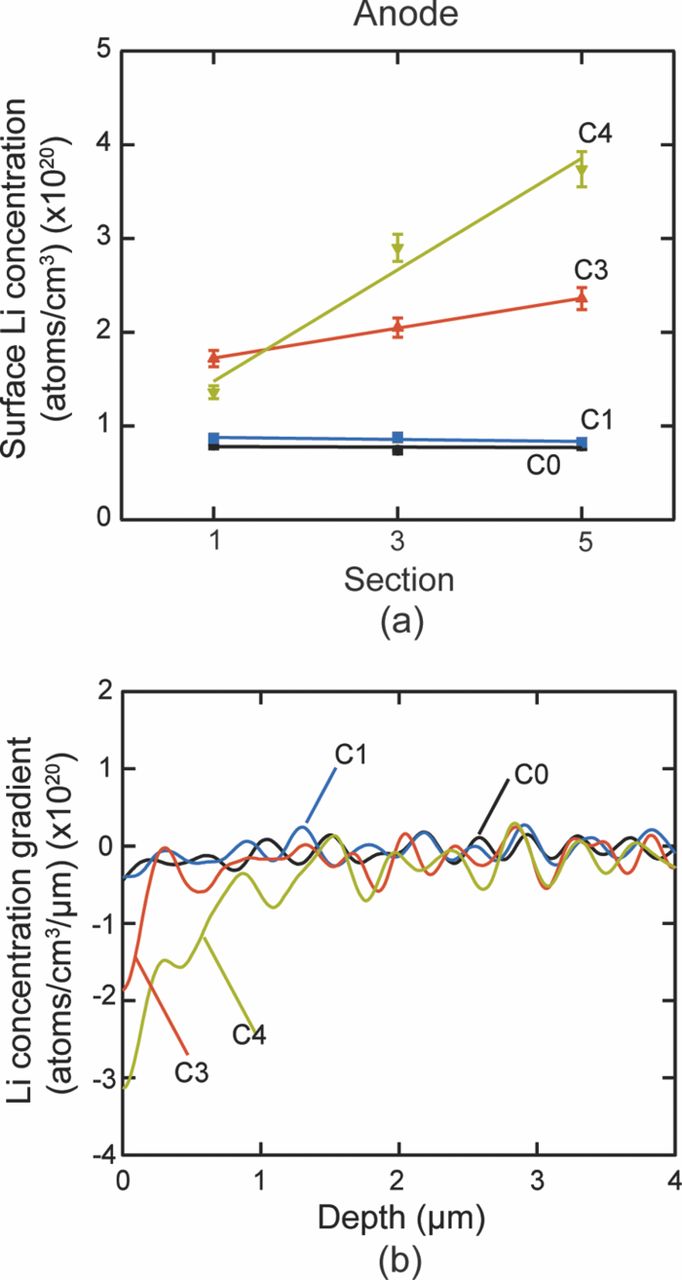
Figure 42. (a) Surface lithium concentration of the anode samples taken from cells aged with different C-rate. The surface concentration increases linearly with C-rate. The surface concentration also increases from section 1 to 5 within a cell. (b) Lithium concentration gradient in section # 3 of the anode samples taken from cells aged with different C-rate. The concentration gradient increases with C-rate up to a certain depth of the anode. The depth at which concentration gradient disappears increases with C-rate.67
It is well known that a solid electrolyte layer (SEI) composed of the decomposition products of the electrolyte salt and the solvent is formed on the surface of the anode.30 The thickness of the SEI is usually of the order of tens of nanometer.241,242 This thickness of the SEI on a given type of anode varies depending on the electrolyte components, mode of cycling, overpotential, temperature, etc.243–246 The lithium concentration profiles for the anode presented here not only indicate higher lithium content in the SEI layer at higher C-rate, but also show that the lithium concentration in the SEI layer is changing from the outer edge to the core of the cylindrical cell aged at a certain C-rate. This has never been reported before in literature. This study reveals that the anode-electrolyte interphase cannot be assumed to be alike over the length of the anode in a cylindrical cell as is the common practice adapted in Li-ion cell modeling.
The analysis of the surface lithium concentration was also conducted and is presented in Fig. 43. A buildup of lithium on the surface as seen in the anode is not observed in cathode samples from different cells. Since there is no buildup, it is certain that there is no lithium plating occurring at the cathode surface. The initial expectation was a decrease in the lithium concentration in the aged sample as compared to the unaged sample. The decrease in the lithium concentration in the case of cells C1, C3, and C4 (Fig. 39) is not very prominent, but the results in Fig. 40 are in good agreement with this hypothesis. Therefore, there is a critical C-rate beyond which the drop in the lithium concentration from the cathode is noticeable. In Fig. 43, the analysis of the lithium concentration gradient along the depth of the cathode is shown for section # 3 of different cells. The lithium concentration gradient observed on a particular section decreases exponentially with the C-rate, as shown by the curve in Fig. 43. For example, in the case of cells C0 and C4 the gradients are −1.63 × 10¹⁸ atoms/cm3/μm and −0.46 × 10¹⁸ atoms/cm3/μm. For a higher C-rate the concentration gradient is lower, indicating that the flux available for diffusion of lithium into the cathode particles is decreasing. Thus the further cycling of the cells at still higher C-rate will be strongly affected. Since the concentration gradient has a negative slope, it indicates that the lithium diffusion within the LiFePO4 is restricted as the diffusion front moves toward the current collector. No fluctuations were observed in the concentration profile as were observed by Whitney et al.238 Thus there is no structural breakdown of the cathode material, unlike that concluded by Whitney et al.238
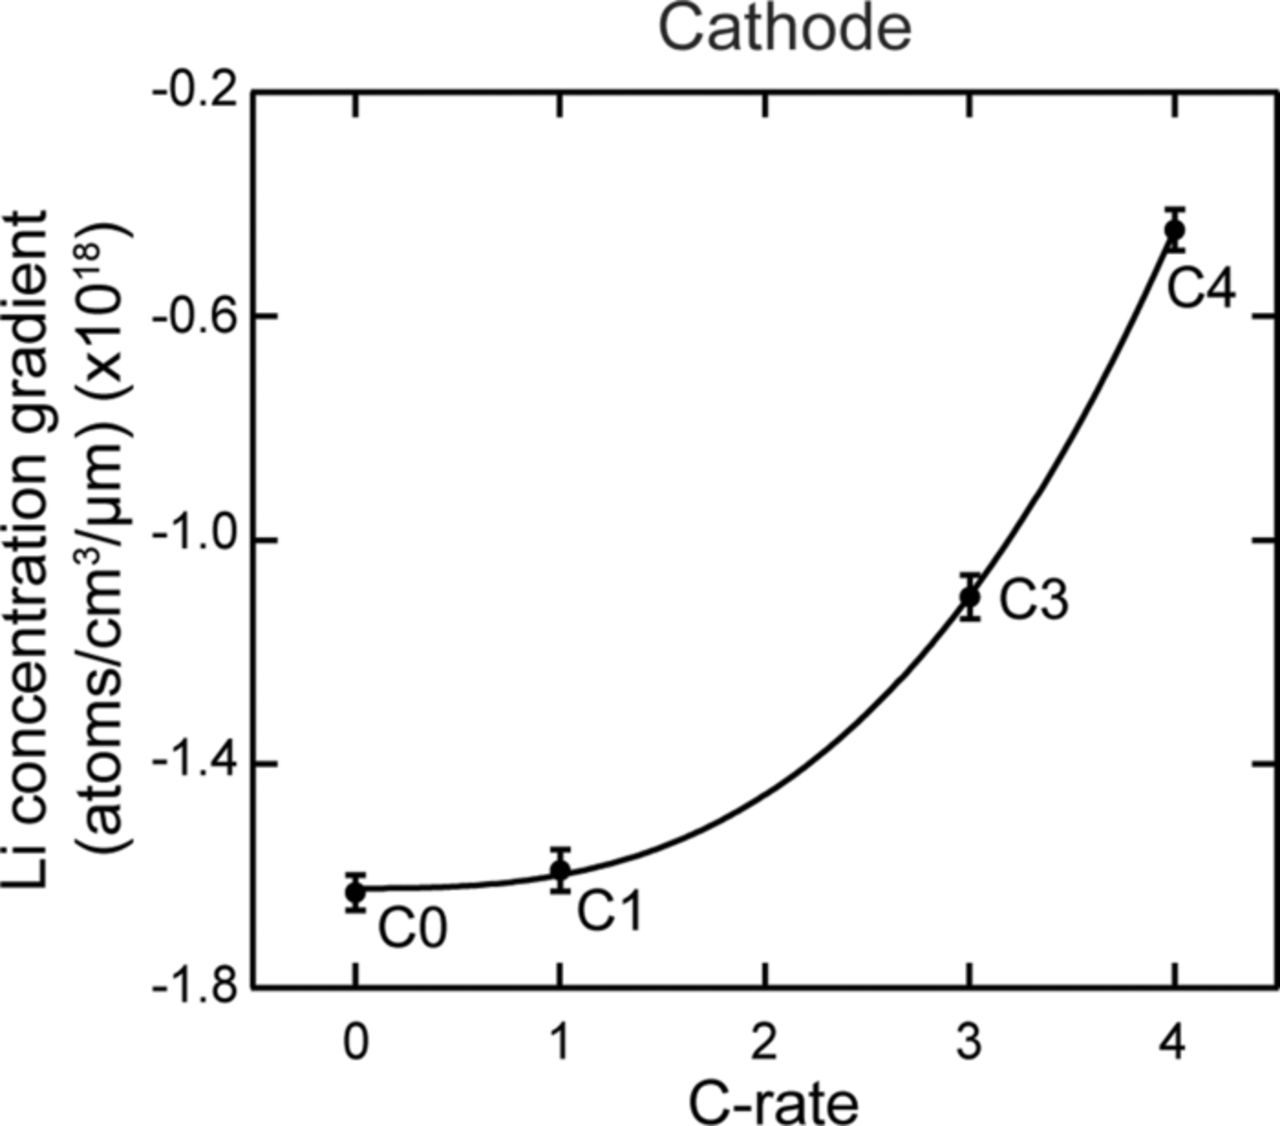
Figure 43. Lithium concentration gradient in section # 3 of the cathode samples taken from cells aged with different C-rate. The concentration gradient decreases with C-rate.67
The decrease in the lithium concentration can be explained by a change in the particle size or coarsening of the LiFePO4 nanoparticles observed in physical/morphological studies. Due to the coarsening of the nanoparticles, the diffusion length for the lithium increases within each particle. As a result, the net uptake of lithium during the discharging processes is low. During each charge cycle lithium diffuses out of the LiFePO4, and phase change occurs from LiFePO4 to FePO4. In the discharge cycle the lithium diffuses back in the host FePO4 particle, and the phase changes from FePO4 to LiFePO4. During the early life of the battery the phase change from LiFePO4 to FePO4 and back to LiFePO4 might be complete, but as the particle size increases due to coarsening, the diffusion length changes, and this will affect the phase change. The incomplete phase change continues to occur in subsequent cycles while the particle size tends to increase. Thus the lithium retaining capacity of the particle drops in each subsequent cycle. The loss of active lithium in the cathode is directly related to the drop in capacity of the battery while the increase in the particle size and the subsequent increase in the diffusion length are directly related to the rate capabilities of the battery.
In summary, The Li concentration profile across the electrodes of the cells at the end of life is affected by the C-rate of the charge/discharge cycle and SOC of the battery. The Li concentration profile changes along the length of the electrode from outer edge to the core of the cylindrical cell, but it remains constant along the height of the electrode. In the case of the anode, the lithium concentration profile decays exponentially along the thickness of the anode. The Li builds up on the surface of the anode, and the buildup rate increases along the length of the anode and also with the C-rate. This buildup below the surface extends to a higher depth in cells cycled at higher C-rate. There is no buildup of the lithium near the cathode surface. Beyond a certain critical C-rate the lithium concentration drops with increasing C-rate, and it has a constant gradient along the depth of the cathode. The gradient of the lithium concentration profile in the cathode decreases with increasing C-rate. While the coarsening of the LiFePO4 particles limits the diffusion of the lithium in the cathode, the surface concentration of the lithium on the anode increases with the C-rate. The quantitative measurement of the lithium profiles for the anode and cathode can prove instrumental in calibrating the diffusion models of the Li-ion cells.
Oudenhoven et al.,247 have demonstrated that lithium depth profiles can be measured in situ inside all solid state thin-film micro-batteries to monitor the charging and discharging processes. Since NDP is only sensitive for the 6Li isotope, a thin-film battery that contained a 6Li-enriched LiCoO2 cathode was analyzed, resulting in enhanced signals. They claim that depending on the materials composition and density an analysis depth of up to 50 μm from the top surface can be obtained.
The battery that was analyzed in this measurement consisted of a monocrystalline silicon substrate with a 200 nm Pt bottom current collector, a 500 nm LiCoO2 cathode, a solid-state electrolyte consisting of 1.5 μm nitrogen doped Li3PO4 (LiPON) and a 150 nm Cu top current collector. The LiCoO2 and LiPON films were deposited using magnetron sputtering. The sputter chamber contained a LiCoO2 and a lithium phosphate target. The lithium-metal anode is formed during the first charge cycle by in situ lithium plating. On top of the copper current collector a thick protective coating was deposited to protect the battery stack. The material of the protective coating is not mentioned.
It is possible to in situ monitor the charge-discharge profile by integrating the difference between the continuously measured NDP spectra and the spectrum of the as-deposited (discharged) battery in the energy range of the cathode (475–960 keV) and the anode (1510–1625 keV). The amount of lithium removed or stored on both sides can, with this difference, be determined accurately, even when the depth profile is relatively inaccurate. With this improved tolerance toward depth inaccuracy, the NDP measurement time for each spectrum can be reduced to less than 10 minutes, short enough with respect to the ∼3 hour (dis)charging time to follow these processes in situ.
It was concluded that the (initial) exchange rate is very low, for example, due to the absence of required Li vacancies in the electrode or electrolyte, or due to a high activation energy for the ion conductivity mechanism in these materials. During the charging process, the necessary exchange of lithium occurs between the cathode and electrolyte. Oudenhoven et al.,247 claim that when the packaging is sufficiently thin, it can also be applied to analyze classical liquid electrolyte micro-batteries.
Nagpure et al.248 have studied copper current collectors with NDP. Figure 44a shows the high-resolution optical microscopy image of the anode cross-section. The copper current collector (CCC) of ∼6μm in thickness is visible between graphite coatings on either side. The lithium concentration is measured for this thin CCC from both faces. Figure 44b shows the measured Li concentration profile from the two surfaces of the CCC. The profiles from each surfaces resembles a classic diffusion profile from surfaces similar to metalliding or carburization. The profile was reproducible for different CCC samples. The profile from the front face has a maximum of 0.025% atomic Li and the profile from the back face has a Li concentration of 0.08% atomic Li. The measured profiles do not have the same maximum at the surface, but show similar exponential decay along the thickness of the CCC. The data should not be confused with a plating of Li on the CCC surface as the NDP measurements indicate that Li has penetrated into the copper sub-surface.
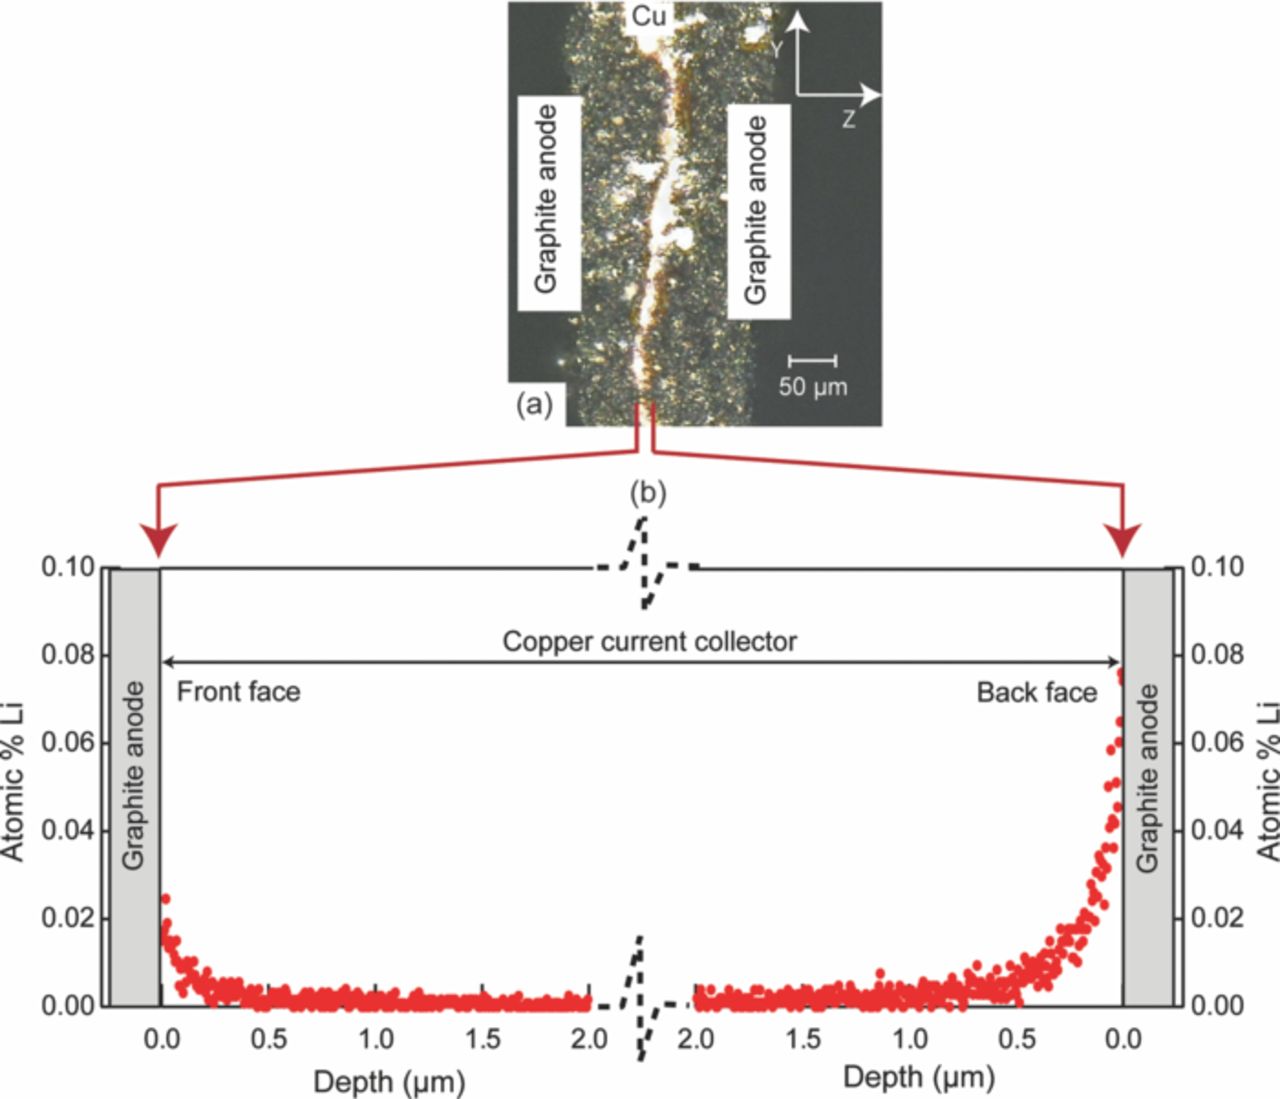
Figure 44. (a) Anode (Graphite-Cu-Graphite) showing the electrode structure; and (b) measured lithium concentration profile from the two surfaces of the copper current collector (adapted from Nagpure et al.248).
The first principle calculations by Van de Walle et al.249 have shown enhanced Li solubility (30 at.%) in FCC copper at 400 K. Also, the calculated phase diagram using differential thermal analysis and electromotive force measurements from high temperature have suggested 18 at.% solubility of Li in copper.250 Therefore, the tendency for Li diffusion into the CCC should be expected. During operation of the battery there exists a high concentration of Li atoms at the CCC surface, especially when the battery is fully charged. However, at the operating temperature of the batteries diffusion of Li to form copper alloys is not expected due to high activation energies.251 Suzuki et al.252 have concluded that it is possible for mass transfer across a copper film coated on a carbon fiber using electrochemical insertion and extraction mechanisms. However, they have not reported measurements showing the presence of Li within the CCC films.
Presence of Li in the CCC indicates the loss of cyclable Li. Among losses of active Li, the loss into the CCC is responsible for the loss of electrical capacity of the battery. The diffusion of Li into the CCC can alter its both electrical and thermal behavior. The increased levels of Li in Cu would change battery impedance and eventually degrade battery performance through ohmic losses. The residual resistivity of the CCC will be affected due to the Li impurity, as given by Nordheim's rule:253
![Equation ([7.7])](https://content.cld.iop.org/journals/1945-7111/160/11/A2111/revision1/jes_160_11_A2111eqn21.jpg)
where ρr(x)is the residual resistivity of Cu due to Li impurity, A is a constant and the x is the impurity concentration. Also, change in the thermal properties and local heating due to increased impedance can cause delamination between the CCC and the active graphite coating, leading to a further increase in the overall battery impedance. These effects, now evident from these measurements, should be given consideration while building battery performance and aging models. Only then can accurate estimates of the performance and aging of the Li-ion battery be established to guide the successful deployment in electric vehicles. Even though a specific mechanism for the above phenomena eludes us, the discovery is significant for aging studies of Li-ion batteries.
In summary, neutron depth profiling has been used to characterize the copper current collector used in the real life Li-ion battery. The data shows the presence of lithium in the CCC with a profile similar to a metalliding or carburization process. The presence of lithium in the CCC will affect its thermal and electrical behavior during the operation of the battery. The presence of lithium beyond the active material and in the CCC suggests that the degradation and loss of active Li in the current collectors cannot be ignored in efforts for the overall understanding of the aging mechanisms predicting the life and performance of the batteries.
Summary
In summary, the chemical and structural characterization of the LiFePO4 nanoparticles reveals changes in the lithium concentration, local lithium bonding and local Li environment. According to the XRD studies both LiFePO4 and FePO4 phases co- existed in the aged samples. The presence of the FePO4 could indicate that there are regions within the cathode strip that are inactive during the charging-discharging process. A more quantitative analysis of the phases present within the samples is necessary to identify the ratios of the inactive material. The change in the volumetric concentration of the active material would be a very important input to the electrochemical and performance models of the Li-ion batteries.
Raman studies show the degradation in the quality of the carbon coating. This has a direct effect on the electronic conductivity of the composite cathode material. Due to the loss in the quality of the carbon, the electrical resistance between the particles and the particles and the current collector can increase, leading to the loss of performance of the batteries. EELS showed that the density of states for O changes as the cell ages. This was evident in the presence of the pre-peak in the case of the O K edge. The increase in the ratio of the pre-peak to the O K edge peak in the EELS data from the core to the surface of the large LiFePO4 particle indicates a different lithium composition within the particle. There is also a shift of almost 2 eV for the L2,3 edge of Fe in the aged sample. At a certain age of the cell the particles start to coarsen. The ion diffusion length is expected to increase in the coarser particle, and this is expected to lead to an incomplete transformation between LiFePO4 and FePO4 while charging and discharging. The FePO4 core is expected to expand in subsequent cycles, thus reducing the capacity of the host cathode material. The experimental results when analyzed with the help of simulated ELNES spectra for the olivine structure (space group Pnma) of LixFePO4 with x = 0, 0.25, 0.5, 0.75, and 1 showed 80% loss of Li in the aged cathode suggesting a strongly Li depleted, but not completely Li free, core region in the coarsened particles. Thus coarsening of the nanoparticles and the increase of the FePO4 phase within the coarsened particle will lead to the loss of performance of the batteries.
NMR and NDP are used to overcome the limitation of electron spectroscopic studies in detecting the lithium in the samples. According to the NMR studies a single Li environment is present in the unpaged sample. The absence of the Li peak in the aged sample reasserted the results of the EELS, suggesting the loss of active Li from the host cathode material. The loss of active Li directly affects the cycling capacity of the battery. NDP measurements help in quantifying the loss of the active Li. The Li concentration profile measured with NDP across the electrodes of the cells is affected by the C-rate of the charge/discharge cycle of the battery. The Li concentration profile is also affected by the state of charge of the cell. NDP measurements have also proved the effects of the cell shape and size on the aging of the battery. The Li concentration profile changes along the length of the electrode from the outer edge to the core of the cylindrical cell, but it remains constant along the height of the electrode. In the case of the anode, the lithium concentration profile decays exponentially along the thickness of the anode. The Li builds up on the surface of the anode, and the buildup rate increases along the length of the anode and also with the C-rate. This buildup below the surface extends to a higher depth in cells cycled at a higher C-rate. There is no buildup of the lithium near the cathode surface. Beyond a certain critical C-rate the lithium concentration drops with increasing C-rate, and it has a constant gradient along the depth of the cathode. The gradient of the lithium concentration profile in the cathode decreases with increasing C-rate.
Modeling
Battery models can be used to predict the performance of the battery, optimize the design parameters and predict the life of the cell under various operating conditions. The models vary in complexity, and can be as simple as based on a power law or as complex to include detailed physiochemical phenomena. Li-ion battery performance models can be categorized mainly as equivalent electrical circuit models (EECM) or first principles based physiochemical models. There are certain other types of models such as the model based on Peukert's law, or based on the artificial neural network, which fall in a different category than the two discussed here. In the following discussion we review the framework of four EECM and two electrochemical models. We will also discuss an empirical model developed for the LiFePO4 cells based on extensive aging studies. Then we will discuss a couple of methods to introduce aging effects in the electrochemical models.
Equivalent electrical circuit models
The simplest method to model the electrochemical performance of the battery is by using the regular electrical elements. The common elements such as resistor, capacitor, inductor, etc. are used to model the performance of the battery. The circuit with these elements represents the overall electrochemical performance of the battery. These models lack the details necessary for accurate prediction of the performance of the battery. The models are still popular as they offer less computation and are very suitable for control applications, such as on-board battery diagnostic and prognostic, state of charge estimation, and state of health estimation.
These models rely on the electrochemical impedance spectroscopy data (EIS) and employ an equivalent circuit with common electrical elements that emulate the complex impedance data. The EECM can have three major components: a static component in the form of a source representing the open circuit voltage (OCV), a dynamic component that represents the kinetic aspect of the cell internal impedance and a load.254
Simple battery model
The most simple battery model can be thought of as an electrical circuit with a resistance in series with an ideal voltage source, as shown in Fig. 45a.255,256 The ideal voltage represents an ideal battery with open circuit voltage (E0). The actual battery terminal voltage (Vb) is then given by the voltage drop across the constant resistance (Rb). This resistance represents the internal resistance of the battery. But the model fails to account for the true internal resistance of the battery as the internal resistance is assumed to be constant in this model, while the actual resistance is a function of the state of charge, and electrolyte concentration. Thus the model is limited to applications where the state of charge can be assumed to be constant or the effect of the state of charge can be neglected.
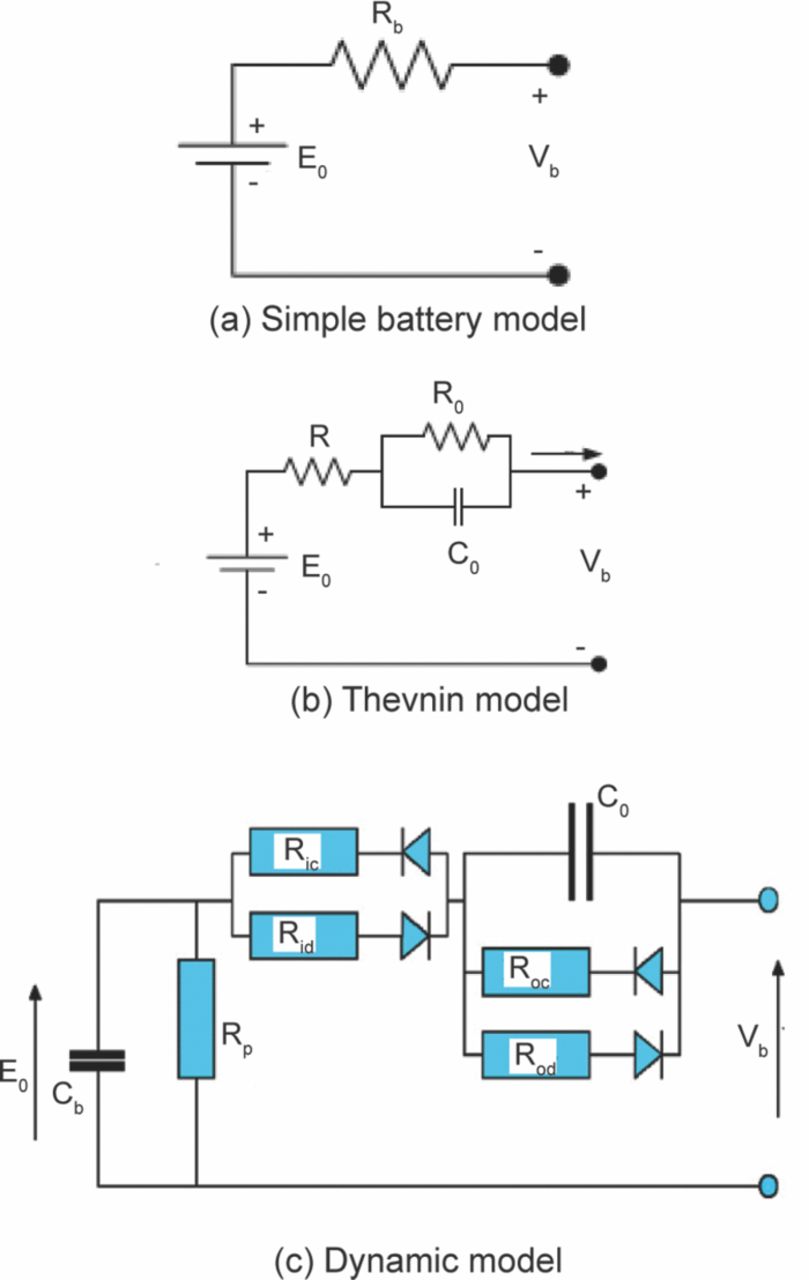
Figure 45. Different equivalent electrochemical circuit models. (a) Simple battery model, (b) Thevenin model, (c) Dynamic model (adapted from Dürr et al.256).
Thevenin model
The other commonly used model is the Thevenin battery model based on the Thevenin theorem. This model consists of a parallel circuit of capacitance (C0) and overvoltage, resistance (R0) is connected in series with an internal resistance (R) in series with ideal battery voltage (E0) (Fig. 45b).256–258 C0 represents the capacitance of the double layer formed at the interface of the electrode and the electrolyte due to charge separation. The R0 represents the non-linear resistance between the electrodes and the electrolyte. This model again fails to recognize that the various components considered here depend on the state of charge of the battery. The constant value assumption of the components leads to the main drawback of this model in predicting the performance of the battery. The model sometimes assumes different sets of parameters at different states of charge, but this limits the continuous battery evaluation.259 The model also fails to account for the faradaic processes within the battery.256
Dynamic model
The Thevenin model has been expanded to account for the non-linear behavior of the parameters to develop the Dynamic Model of the battery performance.256,257,260 The model can be represented as shown in Fig. 45c.256 Vb is the battery terminal voltage. The battery as a voltage source is represented by an equivalent capacitor (Cb). This helps in considering the SOC as the charge stored in the capacitor. Rp represents the small leakage current in the battery, which depends on the open circuit voltage. Ric and Rid represent the resistance of the electrolyte and the electrodes. The values are considered to be dependent on the charge discharge process. The activation overpotential and the overpotential due to the mass transport are represented by the parallel R-C circuit. R0c and R0d represent the voltage drop during charging and discharging respectively while C0 represents the capacitance due to the double layer at the interface of the electrode and the electrolyte. The values of the various elements of the circuit are considered to be a function of the open circuit voltage (OCV). Thus this model predicts the behavior of the battery with better accuracy as compared to other EECM models.
First principle electrochemical model
These models are based on the physiochemical processes within the cell and apply the electrochemical kinetic and transport phenomena to predict the behavior of the cell.261 Whenever a current flows from the cell during charging or discharging a shift in potential of the cell is observed.22,262 As seen in Fig. 46 the potential deviates from the equilibrium potential and causes the cell polarization.
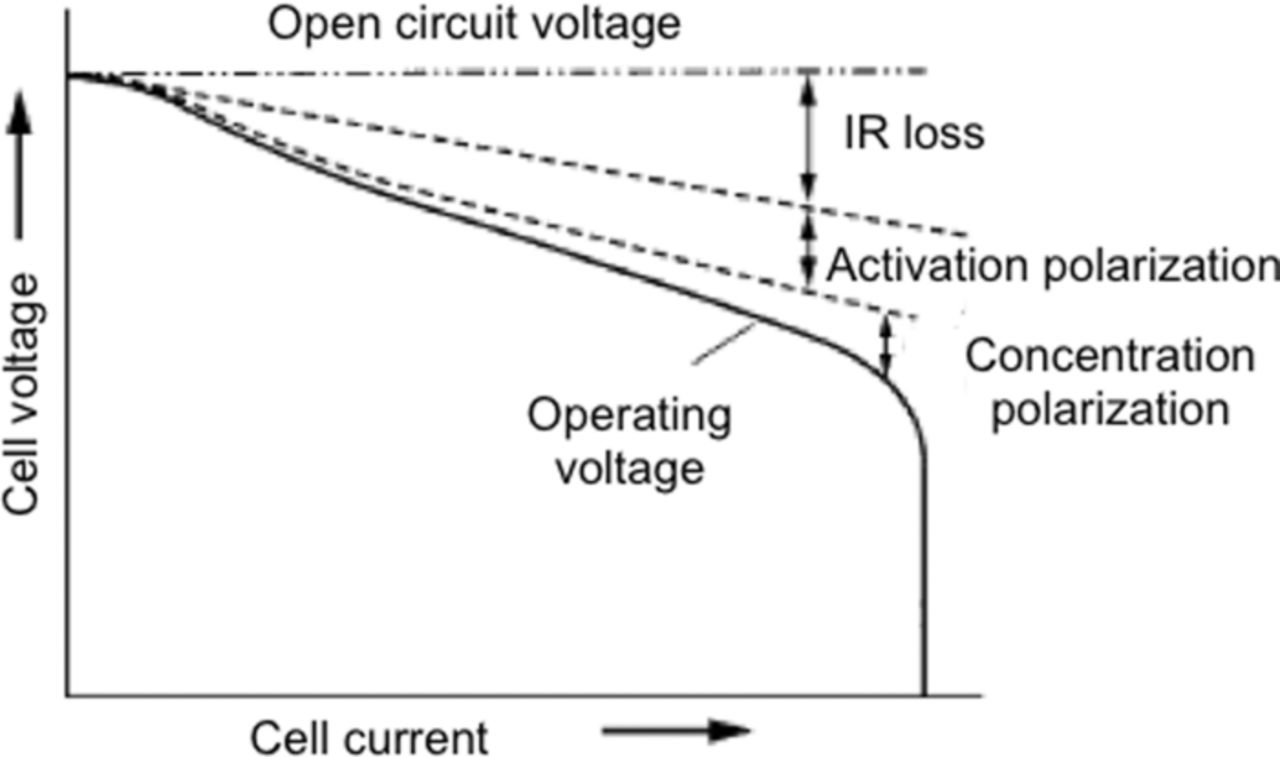
Figure 46. Cell polarization curve as a function of the applied current.22
There are several key aspects of lithium-ion batteries that must be considered in any model of their behavior. The electrodes are generally porous, and therefore the distribution of the reaction through the depth of the electrode must be considered. The active material is an insertion compound, in which the chemical potential and other thermodynamic properties may vary continuously with inserted lithium concentration, and solid-state diffusion of lithium through the active material must be considered. Finally, as in most batteries, the electrolyte is a concentrated, nonideal solution, and mass transport across the electrolyte has a significant effect on battery performance.263
The symbols used in the following discussion are summarized in Table VIII.
Table VIII. List of symbols used in Modeling section.
| List of Symbols | |
|---|---|
| aj | specific area of the porous electrode 'j' (m2 m−3) |
| Aj | surface area of the electrode 'j' (m2) |
| brug | Bruggman's coefficient |
 | concentration of lithium (mol m−3) |
| cs,j | average concentration of lithium in the solid phase of electrode 'j' (mol m−3) |
| 1,j | solid phase concentration of lithium at the surface of the sphere (mol m−3) |
| D1,j | diffusion coefficient of lithium in the solid phase inside electrode 'j' (m2 s−1) |
| D2,eff | effective diffusion coefficient of lithium in the solution phase (= D2,jɛ2brug) (m2 s−1) |
| D2 | diffusion coefficient of lithium in the liquid phase (m2 s−1) |
| F | Faraday's constant (C mol−1) |
| i0j,side | exchange current density for the side reaction (A m−2) |
| J | applied current (A) |
| Jj | local volumetric current density for intercalation reaction (A m−3) |
| Js,j | side reaction current (A) |
| Js,j | local volumetric current density for side reaction (A m−3) |
| k | rate constant for electrochemical reaction (A m−2 mol m−3) (1 + α) |
| L | length of the cell (m) |
| Ms,j | molecular weight of the side reaction product (kg mol−1) |
| r | radial coordinate (m) |
| Rj | radius of the particle (m) |
| RSEI | resistance of the film (Ωm−2) |
| R | universal gas constant (J mol K−1) |
| t | time (s) |
| T | temperature (K) |
| V | cell voltage (V) |
| x | coordinate across the thickness of the cell (m) |
| y | scaled radial co-ordinate (= rL/Rj) (m) |
| Greek | |
| α | transfer coefficients of the electrochemical reaction |
| ɛ | volume fraction of a phase |
| φ | local potential of a phase (V) |
| η | over potential driving a reaction (V) |
| κ | Ionic conductivity of the electrolyte (S m−1) |
| σeff | effective conductivity of an electrode (= σɛj) (S m−1) |
| σ | conductivity of the electrode (S m−1) |
| ρs,j | density of the side reaction product (kg m−3) |
| δf | film thickness (m) |
| Subscript | |
| 1 | solid phase |
| 2 | liquid phase |
| j | = n or p |
| p | positive electrode |
| n | negative electrode |
| s | side reaction property |
| sep | separator |
Pseudo 2D (P2D) model
The P2D model is based on the porous electrode theory, concentrated solution theory, Ohm's law, Butler-Volmer kinetics, and charge and mass balance.264,265 The electrodes used in the battery are porous electrodes to provide the large surface area for the electrochemical reactions. The porous electrode theory helps in modeling the actual porous electrode, which is a mixture of active material, binders, filler material, and electronic conductive coating. The porous electrode theory treats the structure of the electrode as the superposition of active material, electrolyte, and filler material. This leads to the simplification of the structure and the ability to consider the ohmic potential drop and mass transfer that occur in both series and parallel during the electrode processes across the surface.266 Each phase is considered to have its own volume fraction. The material balances are averaged about a volume small so that they are small with respect to the overall dimensions of the electrode but large with respect to the pore dimensions. This simplification allows one to treat the electrochemical reaction as a homogeneous term, without having to worry about the exact shape of the electrode–electrolyte interface, which can lead to heterogeneity in the electrode process.263
The electrolyte that fills the pores of the porous electrode is mostly a binary electrode with a lithium salt and organic solvent. The driving forces arising due to the chemical potential and the mass flux within this liquid phase is modeled using the concentrated solution theory.53 The charge balance is applied to the charge flowing from the electrode surface to the electrolytes during the electrochemical reaction. The mass balance is applied to account for the change of the concentration within the electrolyte due to the mass transfer at the electrode-electrolyte surface.263
The potential drop in the electrode and the electrolyte is modeled using Ohm's law. The kinetics of the electrochemical processes is modeled with the Butler–Volmer equation that gives the relationship between the current density and the overpotential. The relationship depends on the exchange current density also known as the rate constant. All of these equations form a set of coupled non-linear differential equations having various dependent variables, such as the concentrations of the active material, the potential drop, and the reaction rates. Hence their solution requires a rigorous numerical treatment such as the finite-difference technique.
Fuller et al.267,268 have laid the foundation for the mathematical model of lithium-ion batteries based on the porous electrode theory. The model was further simplified by Doyle and Newman.269,270 The model and the equations presented here follow the work by Ramadass et al.271 The schematic of the model is shown in Fig. 47a. The schematic shows three areas within the cell, namely the negative electrode, the separator and the positive electrode. The negative and the positive electrodes are the porous composite electrodes made of active material, binder and filler material. The potential drop across the separator is assumed to be zero and thus no current flows through the separator. For modeling purposes the cell can be considered to have two separate phases, the solid phase that represents the negative and the positive electrodes and the liquid phase that represents the electrolyte.
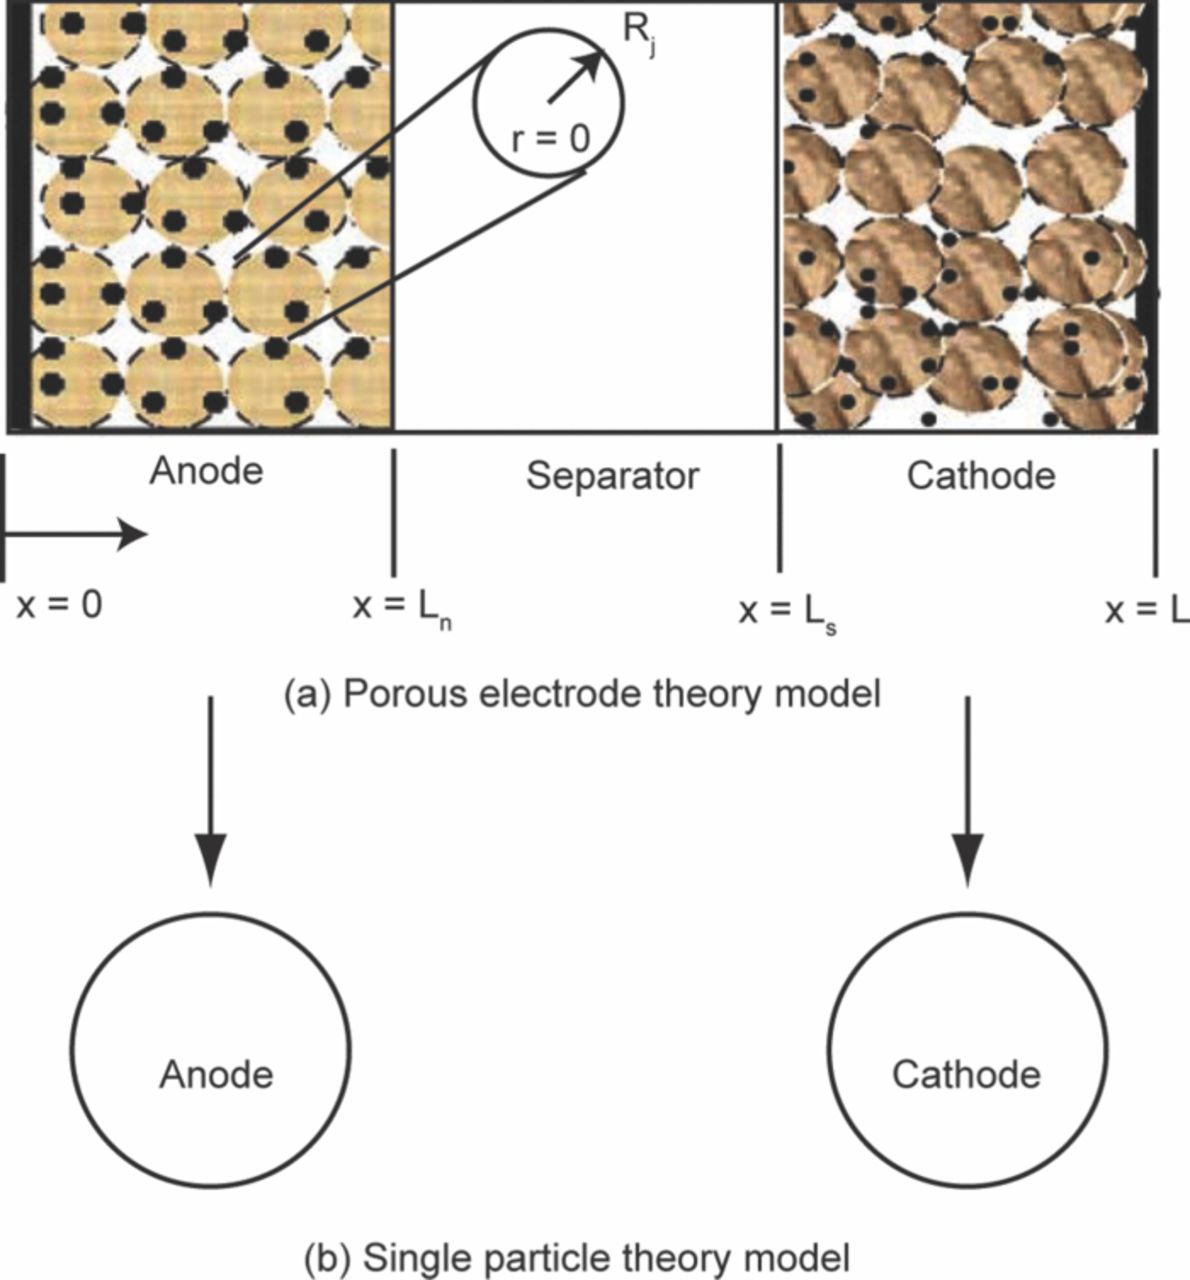
Figure 47. Schematic of the Li-ion cell to demonstrate the layout of the (a) pseudo 2D model, and (b) single particle model (adapted from Santhanagopalan et al.81).
The solid phase is assumed to be comprised of identical spherical particles. In the solid phase the diffusion of lithium along the radial direction is considered to be the predominant transport mode. Thus concentration of lithium needs to be calculated along the pseudo radial direction at each x interval. This gives the model its name of P2D model. In the case of the liquid phase, the concentration and the potential is assumed to vary only in x direction and it is solved for by applying the concentrated solution theory.
The overpotential in the negative and the positive electrode can be given as:
![Equation ([8.1])](https://content.cld.iop.org/journals/1945-7111/160/11/A2111/revision1/jes_160_11_A2111eqn22.jpg)
The open circuit potential (OCP) (Uθj) is often determined experimentally. The OCP can be a function of the state of charge of the battery. The model is setup to determine the values of the potential of each electrode (ϕ1, j) and the liquid phase potential (ϕ2).
In the case of the electronically conducting solid phase, as per the current conservation and Ohm's law, the potential distribution is given by,
![Equation ([8.2])](https://content.cld.iop.org/journals/1945-7111/160/11/A2111/revision1/jes_160_11_A2111eqn23.jpg)
Further the lithium concentration within the solid phase is given by,
![Equation ([8.3])](https://content.cld.iop.org/journals/1945-7111/160/11/A2111/revision1/jes_160_11_A2111eqn24.jpg)
Finally, the Butler-Volmer equation governs the kinetics of the electrochemical reactions and carries the overpotential term.
![Equation ([8.4])](https://content.cld.iop.org/journals/1945-7111/160/11/A2111/revision1/jes_160_11_A2111eqn25.jpg)
In the case of the liquid, the potential distribution is given by,
![Equation ([8.5])](https://content.cld.iop.org/journals/1945-7111/160/11/A2111/revision1/jes_160_11_A2111eqn26.jpg)
Finally, the mass transport through the liquid phase is governed by,
![Equation ([8.6])](https://content.cld.iop.org/journals/1945-7111/160/11/A2111/revision1/jes_160_11_A2111eqn27.jpg)
As stated earlier, and evident through the governing equations, the model involves two different length scales, the thickness of the cell (L) that is several order of magnitude higher than radius of the particle (Rj). Adanuvor et al.,272 Verbrugge,273 and Verbrugge and Koch274 have suggested methods to avoid instabilities arising due to these two distinct length scales. Ramadass et al.271 scales the radial coordinate as follows,
![Equation ([8.7])](https://content.cld.iop.org/journals/1945-7111/160/11/A2111/revision1/jes_160_11_A2111eqn28.jpg)
Single Particle (SP) model
Haran et al.275 presented a simpler representation of the electrode. This was first presented for the metal hydride system and later extended to the lithium ion system.81,276 In this model, each electrode is represented by a single spherical particle. This approach is popularly referred to as the single particle (SP) model. The simplified single particle model is orders of magnitude faster, however it does not account for all the physical processes. For example, the solution phase diffusion limitations are ignored, and thus the validity of the model is limited. In this model the overall framework of the PE model is maintained but instead of considering individual particles, each electrode is represented by a single spherical particle whose area is equivalent to that of the active area of the solid phase in the porous electrode. A schematic of this model is provided in Fig. 47b. This model assumes that the limitations posed by the solution phase of the cell are negligible. Hence, the solution phase is not considered while developing the model equations and so ϕ2 is set to zero in the above equations.
Based on this simplification the electrode potential is a function of only the overpotential and the OCP as follows,
![Equation ([8.8])](https://content.cld.iop.org/journals/1945-7111/160/11/A2111/revision1/jes_160_11_A2111eqn29.jpg)
The Butler-Volmer kinetics is then given by,
![Equation ([8.9])](https://content.cld.iop.org/journals/1945-7111/160/11/A2111/revision1/jes_160_11_A2111eqn30.jpg)
![Equation ([8.10])](https://content.cld.iop.org/journals/1945-7111/160/11/A2111/revision1/jes_160_11_A2111eqn31.jpg)
Modeling aging effects in graphite-LiFePO4 cells
The above models simulate the discharge curve of the batteries. There have been several different attempts to include aging models or, in other words, capacity fade models in the above sets of equations. Here we discuss the three different kinds of capacity fade mechanisms incorporated in to the basic model of the lithium-ion batteries to understand the aging of the batteries.
Empirical model
Wang et al.,72 based on their extensive accelerated aging studies of large format cells, developed an empirical model. They have shown that the cells used at high temperatures and high discharge rates have short cycle life. It was observed that the capacity loss is strongly affected by cycling time and cell temperature, while the effect of DOD is negligible at low C-rates such as C/2. Using a curve-fitting technique, they demonstrated that capacity fade followed a power law relationship with charge throughput between 15°C and 60°C. The model parameters varied depending on the C-rate. Instead of having different model parameters for the different C-rates, they simultaneously fitted the experimental data for all C-rates and found the optimal values of the pre-exponent factor, B for each C-rate by minimizing the error (difference between measured value and the model value). The following is the model they have proposed for the capacity fade
![Equation ([8.11])](https://content.cld.iop.org/journals/1945-7111/160/11/A2111/revision1/jes_160_11_A2111eqn32.jpg)
where Qloss is the percent of the capacity loss and Ah is the total Ah-throughput which is directly proportional to the cycling time at the given C-rate. The values of B are obtained by curve fitting the data from several cells at different C-rates. The values of B are 31630 (C/2), 21681 (2C), 12934 (6C), and 15512 (10C). For all C-rates, the model equations indicated that the power law factors were valued very close to 0.5. The square-root of time dependence was considered to be consistent with the aging mechanisms that involve diffusion and parasitic reactions leading to loss of active lithium.
Effect of solid electrolyte interphase
The most prominent aging effect modeled for the lithium ion batteries is the SEI formation. This is modeled as a potential drop across the SEI layer formed on the anode surface due to the side reaction. Darling and Newman277 included a side reaction that occurs in a propylene carbonate (PC)/LiyMn2O4 system in which they were able to predict the importance of the state of charge and self-discharge of the battery with cycling. Later Arora et al.75 simulated the phenomenon of capacity fade by considering the lithium deposition as a side reaction during over-charge conditions and extended this concept to the increase in the thickness of the surface film with cycling. Here we discuss the model by Ramadass et al.271 in which the potential drop across the film was expressed as a function of the film thickness, which varied with time in accordance with Faraday's law, as shown in the Eq. 8.11.
![Equation ([8.12])](https://content.cld.iop.org/journals/1945-7111/160/11/A2111/revision1/jes_160_11_A2111eqn33.jpg)
The loss of active material due to the side reaction and the resultant additional drop in the anodic overpotential were used to account for the capacity fade in the cell as given by Eq. 8.12.
![Equation ([8.13])](https://content.cld.iop.org/journals/1945-7111/160/11/A2111/revision1/jes_160_11_A2111eqn34.jpg)
Thus the potential of the negative electrode is given by,
![Equation ([8.14])](https://content.cld.iop.org/journals/1945-7111/160/11/A2111/revision1/jes_160_11_A2111eqn35.jpg)
Figure 48a shows the results of this model for different number of cycles. As can be seen, the capacity of the cell faded after a number of cycles.
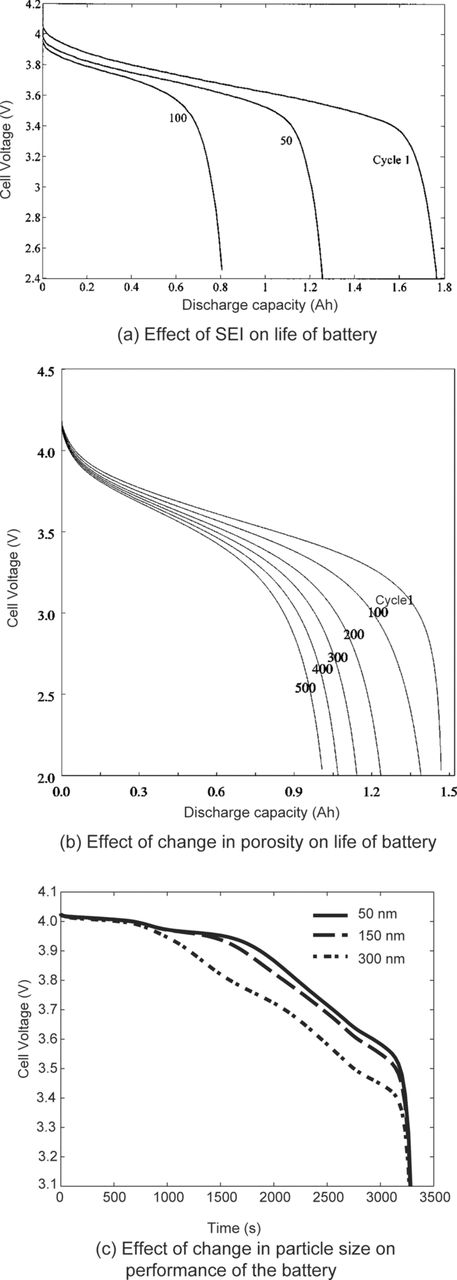
Figure 48. Results of various aging effects included in the electrochemical models. (a) Effect of formation of solid electrolyte interphase on capacity fade (adapted from Ramadass et al.271). (b) Effect of number of cycles which correspond to change in porosity of the electrode on the capacity fade (adapted from Sikha et al.278). (c) Effect of change in the particle size on the performance of the battery based on the BAND subroutine.
Effect of change in porosity
Sikha et al.278 have modeled the effect of the porosity change of the negative electrode on the capacity fade of the battery. They have assumed that during the operation of the battery, due to the side reaction and its products, plugging of pores in the negative electrode occurs. This leads to a change in the surface area of the active material and a loss of active material due to the side reaction. They have tried to overcome the use of any empirical relationship to examine the effect of the side reaction and the porosity change on the capacity fade of the battery. Their model is based on the model developed by Evans et al.279 for the lithium/thionyl chloride primary cell.
The governing equation for the porosity effect is the overall material balance in the matrix phase is,
![Equation ([8.15])](https://content.cld.iop.org/journals/1945-7111/160/11/A2111/revision1/jes_160_11_A2111eqn36.jpg)
Here aj, the surface area to volume ratios is given by,
![Equation ([8.16])](https://content.cld.iop.org/journals/1945-7111/160/11/A2111/revision1/jes_160_11_A2111eqn37.jpg)
The results of the model are shown in Fig. 48b. The capacity is seen dropping after each cycle due to change in the porosity.
Effect of change in particle size
Nagpure et al.67 have observed coarsening of the cathode nanoparticles during aging of the batteries. Tang et al.280 have modeled the effect of particle size in nanoscale olivines. This effect can also be modeled into the basic model discussed above. Figure 48c shows the effect of the change in particle size on the performance of the batteries. These results were obtained by using the BAND subroutine.267,268,281 The change in the particle size affects the diffusion rates and leads to a change in the power rating of the cell. As seen in the Fig. 48c the resistance of the batteries changes which increased the particle size. This affects the power rating of the battery.
Summary and Outlook
The increasing awareness about greenhouse gases has led to the demand for clean renewable energy sources. The goal to reduce CO2 emissions from concentrated sources, such as coal fired power plants or distributed sources such as automobiles, along with reduced dependency on foreign oil can be achieved with efficient electrical energy storage devices. Understanding the degradation mechanisms in the EES is instrumental in developing safe, reliable and efficient devices with long cycle life.
The automobile industry is actively pursuing the development of electric vehicles and has adopted battery technology as EES devices. Recently, advanced Li-ion batteries have been actively pursued as the electrical energy storage device for electric vehicles (EV), hybrid electric vehicles (HEV) and plug-in HEVs (PHEV) due to their high energy and power density over other battery chemistries. Use of current Li-ion batteries or future Li-air batteries in EV, HEV, PHEV, and also the temporary storage systems for renewable energy sources would reduce the dependence on fossil fuels and provide a clean energy technology.
While the mechanism of the operation of these batteries is known, the aging mechanisms are still under investigation. Aging of the cells at the macroscopic or sys- tem level is quantified by the change in the internal resistance measured by impedance techniques. To understand the related loss of capacity, it is imperative to understand the degradation of the electrode materials of the battery. The degradation of the material is caused by several simultaneous physiochemical processes that occur within the batteries and that makes material characterization of the electrodes a challenging task.
Performance of any electrode material is investigated by testing these materials in a small experimental (so-called coin) cell. In commercial batteries the electrodes are made up of nanomaterials to leverage the effects of high surface area. These nanomaterials are packed together on either copper or aluminum current collector strips. These long electrode strips are then rolled and packed into a cylindrical can. Thus commercial batteries are larger in size as they provide the necessary building blocks for the battery packs. The effects of scaling in the commercial cell might be overlooked if the results of the so-called coin cell experiments are to be believed alone. This further adds to the complexity of analyzing the degradation mechanisms in commercial batteries. As such a systematic multi-scale characterization plan is necessary to understand the degradation mechanisms of the battery.
The electrodes within the battery have been characterized by several different techniques with resolutions ranging from mm to nm. Techniques including thermography, scanning electron microscopy (SEM), transmission electron microscopy (TEM), atomic force microscopy (AFM), X-ray diffraction (XRD), Raman spectroscopy, nuclear magnetic resonance (NMR) and neutron depth profiling (NDP) have been applied at different length scales to obtain spatial and temporal data about the degradation of the electrode materials. Such multi-scale characterization plans are applicable to any existing battery chemistry or upcoming battery chemistries such as Li-air, metal-air etc. In this overview paper a review of the results of such a multi-scale characterization applied to LiFePO4 based Li-ion batteries has been presented.
Thermography maps provide the necessary visual data of the cathode strips in identifying the damaged areas for further characterization. Once the areas of interest are identified, SEM and AFM are useful in studying the surface morphology and grain coarsening at μm to nm length scales. AFM is also useful in studying certain functional properties, such as surface resistance and surface potential. TEM provides high-resolution micrographs for particle analysis. Electron energy loss spectroscopy (EELS) is useful in identifying the bonding of the elements in the active material. XRD provides useful information about the lattice parameter, and Raman gives information about the carbon coating over the LiFePO4 nanoparticles. NMR is useful in identifying the different chemical compositions of the LiFePO4 nanoparticles after aging. NDP is instrumental in providing the lithium concentration profiles in the electrodes. These multi-scale studies reveal changes in thermal diffusivity, permanent phase change, structural disordering, coarsening of nanoparticles and loss of active lithium in the cathode over the life of the battery.
Coarsening has been identified as a major aging parameter in these studies, but quantifying the coarsening of the nanoparticles has remained a major challenge. Since the commercial cathodes are densely packed, identifying the correct particle size distribution has been a difficult task so far. High-resolution imaging combined with image processing algorithms would be necessary to establish the particle size distribution in the cathode. Such a distribution would be a very important input to the modeling process as one can vary the distribution as the function of the aging of the battery and identify its performance.
The different Li-ion battery models are available to predict electrochemical performance and aging. The models are briefly categorized as equivalent electrical circuit (EECM) models or first principles based physiochemical models. The EECM models are the simplistic models based on the cycling studies of the batteries. These types of models lack the details necessary for predicting the performance of the batteries with a high degree of accuracy. Nevertheless, because of their low computation requirement they are popular for any on-board battery management system. The first principles based physiochemical models have a high degree of accuracy and represent mathematically the various processes within the battery during the charge/discharge cycle. Due to the heavy computation necessary to solve the set of linear differential equations, they are not suitable for an on-board battery management system. The coarsening effect, observed as a result of the multi-scale characterization of the cathode material, was simulated with Newman's model. The simulation results show a loss of capacity of the battery with an increase in the particle size of the active cathode material.
The aging mechanisms identified above need to be further investigated. The multi-scale techniques that give spatial information should be applied such as to get the temporal data of the aging mechanisms. The above study was conducted on the batteries aged untill they lost 20% of their capacity. Thus only the final effects of aging are visible through characterization. The batteries should be aged to different degrees between 100% and 80% capacity and then characterized according to the multi-scale techniques. Such a study would provide knowledge about the on-set of aging and its progress through the life of the battery.
Aging of the batteries remains a challenge in such studies, because as the chemistries improve the life of the batteries also improve. But to achieve conditions and see the effects of cycling similar to the real life aging cycle, the batteries should be aged properly with a synthetic aging cycle. Often even in a synthetic aging cycle the battery aging has be accelerated to accomplish the studies within a certain time limit. Thus one should study the effects of accelerated aging cycles on actual aging of the batteries. These effects should then be filtered from the data to identify the true aging mechanisms.
Lastly, the studies selected in the multi-scale characterization are not limited to the device or to the chemistry of the device. They can be easily extended to the future generations of EES including, but not limited to, Li-air, and Li-metal.
: APPENDIX A1: COMPARISON OF BATTERY CHEMISTRIES
Appendix. Batteries
A battery is a device that stores electrical energy in chemical form, and by the principle of a galvanic cell, it converts this chemical energy into electricity when connected to an external load. A galvanic cell is a device consisting of an anode and a cathode dipped in an electrolyte, and it produces electricity by a spontaneous reduction- oxidation (redox) reaction. Batteries are classified according to their chemistries. Depending on the chemistry of the battery, different materials are used to make its components. Table A1.1 summarizes the properties of various battery chemistries, while Table A1.2 lists the advantages and limitations of these batteries. These different battery chemistries and their advantages and limitations are briefly discussed here.
Table A1.1. Characteristics of commonly used rechargeable batteries.52
| Lead-acid (sealed) | Ni-Cd | Ni-MH | Li-ion cobalt oxide | Li-ion manganese | Li-ion phosphate | |
|---|---|---|---|---|---|---|
| Commercial use since | 1970 | 1950 | 1990 | 1991 | 1996 | 2000 |
| Gravimetric energy density (Wh/kg) | 30–50 | 45–80 | 60–120 | 150–190 | 100–135 | 90–120 |
| Internal resistance (mΩ) | <100 12 V pack | 100 to 200 6 V pack | 200–300 6 V pack | 150–300 pack 100–130 per cell | 25–75 per cell | 25–50 per cell |
| Cycle life (to 80% of initial capacity) | 200–300 | 1500 | 300–500 | 300–500 | Better than 300 to 500 | > 1000 |
| Fast charge time (h) | 8 to 16 | 1 | 2 to 4 | 1.5 to 3 | 1 or less | |
| Overcharge tolerance | High | Moderate | Low | Low. Cannot tolerate trickle charge | ||
| Self-discharge/month (room temperature) | 5% | 20% | 30% | <10% | ||
| Cell voltage (V) | 2 | 1.25 | 1.25 | Nominal 3.6 Average 3.7 | Nominal 3.6 Average 3.8 | 3.3 |
| Load current: Peak | 5 | 20 | 5 | <3 | >30 | >30 |
| Best | 0.2 | 1 | 0.5 or lower | 1 or lower | 10 or lower | 10 or lower |
| Operating temperature (°C) | −20 to 60 | −40 to 60 | −20 to 60 | −20 to 60 | ||
| Maintenance requirement | 3 to 6 months | 30 to 60 days | 60 to 90 days | Note required | ||
| Safety | Thermally stable | Thermally stable Fuse recommended | Thermally stable Fuse recommended | Protection circuit mandatory Stable to 150 (°C) | Protection circuit mandatory Stable to 250 (°C) | Protection circuit mandatory Stable to 250 (°C) |
| Toxicity | Toxic lead and acids harmful to environment | Highly toxic Harmful to environment | Relatively low toxicity, should be recycled | Low toxicity, can be disposed in small quantities | ||
Table A1.2. Advantages and limitations of commonly used rechargeable batteries (adapted from Buchmann52).
| Advantages | Limitations | |
|---|---|---|
| Lead-acid (sealed) | Very inexpensive and simple to manufacture | Low energy density – limits use to stationary and wheeled applications |
| Well-developed technology | Voltage should never drop below 2.1 V | |
| Lowest self-discharge | Allows only limited number of full discharge cycles | |
| Low maintenance- no memory effect, no electrolyte to fill on sealed version | Environmentally unfriendly due to the lead content | |
| Capable of high discharge rates | Thermal runaway can occur due to improper charging | |
| Some versions can never be charged to their full potential | ||
| Nickel-cadmium | Fast and simple charge | Relatively low energy density |
| High cycle life | Shows memory effect | |
| Good load performance Long shelf life | Environmentally unfriendly and so some countries restrict its use | |
| Easy storage and transportation | Relatively high self-discharge- needs recharging after storage | |
| Good low temperature performance | ||
| One of the most rugged rechargeable batteries | ||
| Lowest in terms of cost per cycle | ||
| Available in a wide range of sizes and performance options | ||
| Nickel-metal -hydride | 30–40% higher capacity than standard nickel-cadmium | Limited service life of 200–300 cycles |
| Less prone to memory effect than nickel-cadmium | Relatively short storage life | |
| Simple transportation | Limited discharge current | |
| Environmentally friendly - contains only mild toxins; profitable for recycling | More complex charge algorithm due to heat generated during charging | |
| Trickle charge settings are critical because the battery cannot absorb overcharge | ||
| High self-discharge | ||
| Should be stored in cool place at 40°C High maintenance | ||
| Lithium-ion | Highest gravimetric energy density (Wh/kg) | Requires protection circuit to maintain voltage and current within safe limits |
| Does not need prolonged priming | Aging is a major issue | |
| Relatively low self-discharge | Expensive to manufacture | |
| Low Maintenance - no memory effect | ||
| Cells with high current capacity can be manufactured for power tool applications |
Appendix. Lead-acid
French physician Gaston Plant introduced the lead acid battery in 1859. It was the first commercially available rechargeable battery. Though many battery chemistries were introduced later on, lead acid is still used in a lot of applications due its cost effectiveness and ruggedness. Because of gassing and water depletion, this battery can never be charged to its full capacity. Also, each time the battery is discharged completely, it tends to lose a small amount of its capacity. Because of the lead content, this battery is treated as non-friendly to the environment. They are used in wheelchairs, hospital equipment, automobiles for auxiliary equipment, and uninterruptible power supply systems.
Appendix. Nickel-Cadmium
The nickel-cadmium battery was invented in 1899 by a Swedish man, Waldmar Jungner. In 1947, Neumann was successful in introducing the completely sealed version of this battery. This battery chemistry has a moderate energy density and a long cycle life. The main drawback of this battery chemistry is the memory effect, in which the battery gradually loses its maximum energy capacity if it is repeatedly recharged after being only partially discharged. Though the metals used are toxic, it remains a favorite choice in areas where the most rigorous charge-discharge cycles are expected. Because of its ability to draw heavy load currents, it is also a favorite choice in applications like power tools.
Appendix. Nickel-Metal hydride
Development of the nickel-metal hydride battery started in 1970. Only after stable metal hydride alloys were developed in 1980, was this battery available for consumers. The cathode in the Ni-MH battery is composed of nickel hydroxide. The anode is mostly composed of an intermetallic compound of type AB5, where A is a rare earth mixture of lanthanum, cerium, and titanium, and B is nickel, cobalt, manganese and/or aluminum. The materials used in this battery are non-toxic. Though it is better in some aspects than the nickel-cadmium battery, it shares some of its drawbacks with the nickel-cadmium battery due to the nickel technology. The cycle life of this battery is less than that of the nickel-cadmium. It has a higher energy density compared to nickel-cadmium and shows no memory effect. Before the lithium-ion battery was introduced, the nickel-metal-hydride battery was used in mobile computing and wireless communications. It is often believed among researchers that nickel-metal-hydride led to the development of the lithium-based battery.
Appendix. Lithium-ion
The research for lithium-ion battery technology started with lithium batteries. In 1912, G. N. Lewis began working on lithium batteries. Lithium (atomic number 3, group 1, period 2) was used as an anode in lithium batteries. Lithium is an alkali metal, and being the lightest of the metals with the greatest electrochemical potential, it has the largest energy density for weight. But lithium is very unstable, as it has only one valence electron. This made lithium batteries very unsafe for commercial use, and so research shifted from a lithium battery to a lithium-ion battery, which is a much safer option.
: APPENDIX A2: A GUIDE TO UNDERSTANDING BATTERY SPECIFICATIONS (Taken from MIT Electric Vehicle Team, December 2008)
Appendix. Battery basics
The different battery classifications you might see in the electric vehicle literature are discussed here.
- Cell, Module, and Pack: Hybrid and electric vehicles have a high voltage battery pack that consists of individual modules and cells organized in series and parallel. A cell is the smallest, packaged form a battery can take and is generally on the order of one to six volts. A module consists of several cells generally connected in either series or parallel. A battery pack is then assembled by connecting modules together, again either in series or parallel.
- Battery Classifications: There are several ways batteries are classified. Firstly the batteries are classified based on their usability as secondary and primary batteries. A primary battery is one that cannot be recharged. A secondary battery is one that is rechargeable. Secondly, the batteries are classified based on their chemistry. For e.g.: Lead acid, Nickel metal hydride, Li-ion etc. Batteries of same chemistry are further classified based on their application or shape. Based on the application, the main trade-off in battery development is between power and energy. Batteries can be either high-power or high-energy, but not both. Often manufacturers will classify batteries using these categories. Other common classifications are High Durability, meaning that the chemistry has been modified to provide higher battery life at the expense of power and energy. Thirdly, the batteries are classified based on their shape as prismatic, cylindrical or pouch batteries.
- C- and E- Rates: In describing batteries, discharge current is often expressed as a C-rate in order to normalize against battery capacity, which is often very different between batteries. A C-rate is a measure of the rate at which a battery is discharged relative to its maximum capacity. A 1C rate means that the discharge current will discharge the entire battery in 1 hour. For a battery with a capacity of 100 Ah (Amp-hr), this equates to a discharge current of 100 Amps. A 5C rate for this battery would be 500 A, and a C/2 rate would be 50 A. Similarly, an E-rate describes the discharge power. A 1E rate is the discharge power to discharge the entire battery in 1 hour.
Appendix. Battery condition
Variables used to describe the current condition of a battery:
- State of Charge (SOC) (%): An expression of the present battery capacity as a percentage of maximum capacity. SOC is generally calculated using current integration to determine the change in battery capacity over time.
- Depth of Discharge (DOD) (%): The percentage of battery capacity that has been discharged expressed as a percentage of maximum capacity. A discharge to at least 80% DOD is referred to as a deep discharge.
- Terminal Voltage (V): The voltage between the battery terminals with load applied. Terminal voltage varies with SOC and discharge/charge current.
- Open-circuit Voltage (V): The voltage between the battery terminals with no load applied. The open-circuit voltage depends on the battery state of charge, increasing with state of charge.
- Internal Resistance (Ω): The resistance within the battery, generally different for charging and discharging, also dependent on the battery state of charge. As internal resistance increases, the battery efficiency decreases and thermal stability is reduced as more of the charging energy is converted into heat.
Appendix. Battery technical specifications
This section explains the specifications you may see on battery technical specification sheets used to describe battery cells, modules, and packs.
- Nominal Voltage (V): The reported or reference voltage of the battery, also sometimes thought of as the normal voltage of the battery.
- Cut-off Voltage (V): The minimum allowable voltage. It is this voltage that generally defines the empty state of the battery.
- Capacity or Nominal Capacity (for a specific C-rate) (Ah): The coulometric capacity, the total Amp-hours available when the battery is discharged at a certain discharge current (specified as a C-rate) from 100 percent state-of-charge to the cut-off voltage. Capacity is calculated by multiplying the discharge current (in Amps) by the discharge time (in hours) and decreases with increasing C-rate.
- Energy or Nominal Energy (for a specific C-rate) (Wh): The energy capacity of the battery, the total Watt-hours available when the battery is discharged at a certain discharge current (specified as a C-rate) from 100 percent state-of-charge to the cut-off voltage. Energy is calculated by multiplying the discharge power (in Watts) by the discharge time (in hours). Like capacity, energy decreases with increasing C-rate.
- Cycle Life (number for a specific DOD): The number of discharge-charge cycles the battery can experience before it fails to meet specific performance criteria. Cycle life is estimated for specific charge and discharge conditions. The actual operating life of the battery is affected by the rate and depth of cycles and by other conditions such as temperature and humidity. The higher the DOD, the lower the cycle life.
- Specific Energy (Wh/kg): The nominal battery energy per unit mass, sometimes referred to as the gravimetric energy density. Specific energy is a characteristic of the battery chemistry and packaging. Along with the energy consumption of the vehicle, it determines the battery weight required to achieve a given electric range.
- Specific Power (W/kg): The maximum available power per unit mass. Specific power is a characteristic of the battery chemistry and packaging. It determines the battery weight required to achieve a given performance target.
- Energy Density (Wh/L): The nominal battery energy per unit volume, sometimes referred to as the volumetric energy density. Energy density is a characteristic of the battery chemistry and packaging. Along with the energy consumption of the vehicle, it determines the battery size required to achieve a given electric range.
- Power Density (W/L): The maximum available power per unit volume. Power density is a characteristic of the battery chemistry and packaging. It determines the battery size required to achieve a given performance target.
- Maximum Continuous Discharge Current (A): The maximum current at which the battery can be discharged continuously. This limit is usually defined by the battery manufacturer in order to prevent excessive discharge rates that would damage the battery or reduce its capacity. Along with the maximum continuous power of the motor, this defines the top sustainable speed and acceleration of the vehicle.
- Maximum 30-sec Discharge Pulse Current (A): The maximum current at which the battery can be discharged for pulses of up to 30 seconds. This limit is usually defined by the battery manufacturer in order to prevent excessive discharge rates that would damage the battery or reduce its capacity. Along with the peak power of the electric motor, this defines the acceleration performance (0–60 mph time) of the vehicle.
- Charge Voltage (V): The voltage that the battery is charged to when charged to full capacity. Charging schemes generally consist of a constant current charging until the battery voltage reaching the charge voltage, then constant voltage charging, allowing the charge current to taper until it is very small.
- Float Voltage (V): The voltage at which the battery is maintained after being charge to 100 percent SOC to maintain that capacity by compensating for self-discharge of the battery.
- (Recommended) Charge Current (A): The ideal current at which the battery is initially charged (to roughly 70% SOC) under constant charging scheme before transitioning into constant voltage charging.
- (Maximum) Internal Resistance (Ω): The resistance within the battery, generally different for charging and discharging.