
Abstract
Li plating is a severe and safety relevant aging mechanism which has to be avoided. A new 4-electrode operando pouch full cell, with two Li reference electrodes is developed. The voltage shifts between the two Li metal electrodes are correlating directly with changes in the Li+ activity a[Li+] in the electrolyte in front of the anode surface. We take advantage of the Li+ activity dependency of the Li+/Li redox potential as described by the Nernst equation to measure the Li+ activity in the electrolyte. On this basis, the mismatch between reaction and transport kinetics in anode and cathode is discussed. Finally, optimized fast-charging procedures based on strictly positive anode potentials are deduced from the measurements in cells with reference electrodes. These charging protocols allow reducing charging time while enhancing cycle life significantly. The second reference electrode is helpful to understand these measurements in terms of Li+ activity during charging. The applicability of such fast-charging protocols is demonstrated on the example of commercial 16 Ah pouch and lab cells.
Export citation and abstract BibTeX RIS

This is an open access article distributed under the terms of the Creative Commons Attribution 4.0 License (CC BY, http://creativecommons.org/licenses/by/4.0/), which permits unrestricted reuse of the work in any medium, provided the original work is properly cited.
This paper is part of the JES Focus Issue on Battery Safety, Reliability and Mitigation. This was in part Paper 422 presented at the Atlanta, Georgia, Meeting of the Society, October 13–17, 2019.
Long lifetime (>10 years), fast-charging capability (<20 min to 80% SOC), high energy density/specific energy, and high safety under all conditions of Li-ion battery cells are crucial parameters to successfully introduce electric vehicles to the market. Unfortunately, increased current densities lead to side reactions in Li-ion cells. For current state-of-the-art Li-ion batteries the aging mechanisms occur mainly on the anode side.1–9
The susceptibility of a cell to Li deposition is influenced by the anode to cathode capacity ratio (N/P ratio), the anode thickness, tortuosity, porosity, as well as the type of active material, particle shape/size distribution, and microscopic/macroscopic inhomogeniety as well as the electrolyte.1,9–14 Therefore, Li deposition and kinetics are connected to several key parameters of Li-ion cells, such as fast-charging capability, low temperature performance, degradation, energy density, and safety (see Fig. 1).
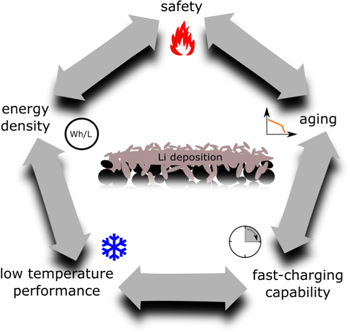
Figure 1. Interactions of Li deposition on anodes of Li-ion cells with their key topics.
Download figure:
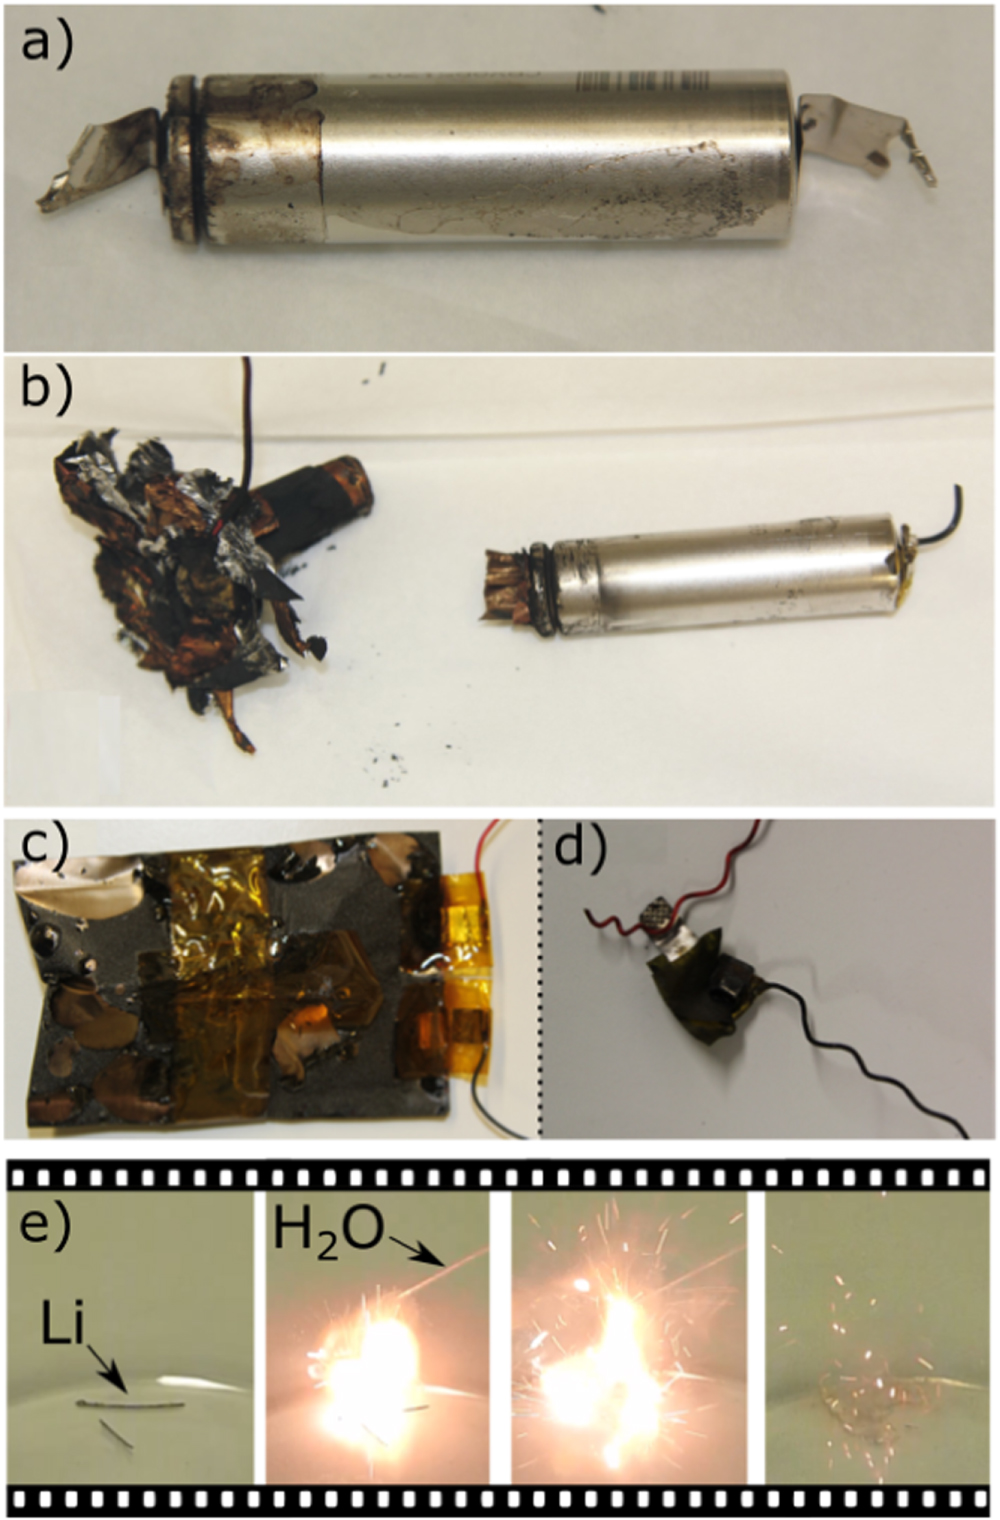
Standard image High-resolution imageThe deposition of Li metal on graphite anodes is a critical side reaction in terms of life-time1–6,15 and safety.5,16–21 The safety of a Li-ion ion cell with Li deposition can be reduced not only by the possibility of an (i) internal short caused by dendritically deposed Li,8,16,20–23 but also by (ii) low onset temperatures of exothermic reactions in accelerated rate calorimetry (ARC) tests.5,17–19 In case of such exothermic reactions, (iii) the degree of destruction is often higher in case of Li deposition.17,18 This is exemplarily illustrated for commercial 18650-type cells and lab pouch cells in Figs. 2a–2d. Furthermore, (iv) deposited Li metal can have a high surface area and react with H2O, e.g. after venting of a cell. Figure 2e shows a flame created by the reaction of deposited Li taken out of a commercial 16 Ah cell with H2O. Finally, (v) above 180.5 °C Li will melt, which is likely leading to additional effects. Therefore, Li deposition is to be avoided.
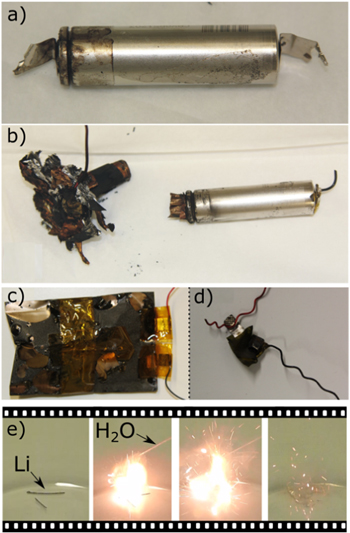
Figure 2. Safety tests involving different commercial Li-ion cells with and without Li deposition. (a), (b) 1.5 Ah 18650-type cells after thermal runaway in ARC test (a) without and (b) with Li deposition. Reproduced from Ref. 17 with permission from Elsevier. (c), (d) Pouch cells after ARC test, cells cycled at (c) 0 °C and (d) −20 °C. (e) Reaction of Li deposition taken from an aged commercial 16 Ah pouch cell with water.
Download figure:
Standard image High-resolution imageAlthough the Li insertion into graphite particles of the anode is typically the preferred reaction during charging,24 Li deposition is often found in Post-Mortem analysis of aged commercial Li-ion cells to happen in parallel.1,3,5,8,13,25,26 While many methods give hints on Li deposition,19,27–31 only few methods (NMR,13,32–36 XPS,37 GD-OES,7,8,38 and reference electrodes1,15,39,40) are able to prove Li deposition. We have recently shown for one type of commercial 18650 cell that the hints for Li deposition given by several electrochemical methods are in accordance with Post-Mortem analysis.19
Li deposition happens preferentially at low temperatures,1,3,15,25,30,41 high SOCs,15,42,43 high charging C-rates,3,15 as well as unfavorable combinations of these parameters.6,15,42 Furthermore, Bach et al. showed that Li deposition can develop during cycling aging starting near the mechanical inhomogeneities in the cells, e.g. caused by current collecting tabs in the jelly roll of cylindrical cells.4
Yang et al. recently showed for a cell with an internal heating foil that high temperatures during fast-charging can lead to extended cycle life.44 In contrast for other cells, Li deposition was observed after high temperature (45 °C) cycling at high charging C-rates3,8,26 or during check-ups in calendar aging tests.7,13 In some cases, this was due to decomposition of biphenyl contained in the electrolyte.7,8,13
Although often named "Li plating" in literature, Li deposition can occur in different macroscopic morphologies, such as homogeneous Li plating, local Li deposition, and marginal Li deposition.5 According to our experiments7,8,19,38 and simulations by Latz's group,45,46 Li deposition occurs mainly on the anode surface (near the current collector).
Li deposition can be detected by a reference electrode in 3-electrode cells.1,15,39,40 During charging of a cell, the anode potential Ea and cathode potential Ec are lowered and increased, respectively. The difference between both potentials is the cell voltage (U = Ec-Ea) which is consequently increased during charging. This shows that the contribution of the cathode (e.g. NCM) is not negligible and it is very important that the reference electrode is introduced into a full cell. However, this is often not considered in literature.
From theory, Li deposition is expected when the sum of the equilibrium potential and the overpotential get negative vs Li/Li+, which is essentially the same as a negative anode potential measured vs Li/Li+ in a 3-electrode cell with a reference electrode.45 Another criterion for Li deposition is the activity of Li+ ions a[Li+] in front of the anode. However, to best of our knowledge, a[Li+] values not been reported so far, although they would be highly relevant, e.g. for simulations.
In this paper, we show a new method for measuring a[Li+] operando in front of the anode during charging based on 4-electrode cells. This allows the investigation of the influences of anode and cathode on each other during the charging process. Finally, optimized charging procedures are deduced from measurements of a[Li+] and of the anode potential.
Experimental
For this study, 4-electrode pouch cells were built. As shown in Fig. 3, the electrode stack consists of one double side coated graphite anode (5.38 mAh cm−2) sandwiched between two single side coated NCM111 cathodes (4.12 mAh cm−2), as well as two Li reference electrodes. To obtain the single side coated cathodes, the coating on one side of the originally double side coated commercial electrode was removed via a laser ablation technique, which we had already used before.15 A tri-layer polyolefin separator (Celgard 2325) was used. The electrode stack and the Li reference electrodes were assembled in a dry room with a dew point of −64 °C. As shown in Fig. 3, one reference electrode was positioned between the anode and cathode (Ref1) and a second one outside of the electrode stack (Ref2). The references are small pieces of Li metal wrapped around a wire. Ref1 was placed between anode and cathode at the anode side of the separator. The reference is electrically isolated form the anode by an additional piece of separator.

Figure 3. Schematic drawing of the 4-electrode-setup consisting of a stacked pouch cell and additionally one Li electrode (Ref1) placed between anode and cathode (electrochemically active area) and another Li electrode (Ref2) outside of the electrode stack (electrochemically inactive area, dark grey).
Download figure:
Standard image High-resolution imageBefore the electrolyte (EC:DMC 1:1 wt%/1 M LiPF6, UBE Industries) filling in a glove box (O2 < 0.1 ppm, H2O < 0.1 ppm), the cell was dried at 80 °C under vacuum for 16 h. All electrochemical tests were performed with BaSyTec CTS and XCTS systems in climate chambers (Vötsch). Metallic Li pressed on a Cu mesh was used as Li counter electrode for the half cell measurements vs NCM111.
The pouch cells for the ARC test were cycled two times at C/50 until 4.2 V at ambient temperatures of 0 °C and −20 °C, respectively. Afterwards, the cells were charged to 3.9 V at a rate of C/50 and T = 25 °C until 3.9 V to achieve similar charged capacities. The ARC experiment started at 50 °C and heating ended at 350 °C.
The improved charging protocol for the 16 Ah cells was charging with 3C until 3.98 V, 2C until 4.004 V, 1C until 4.073 V, 1.5 until 4.033 V, and 0.5 until 4.2 V. The values for these transitions were taken from Ref. 15, except the value for 1.5C, which was obtained from interpolation of the other data points.
Results and Discussion
Measurement of Li+ activity in 4-electrode pouch full cells
Reference electrodes have been used by several authors in different configurations.1,15,39,40,47 The effect of the position of the reference electrode on the measured value can directly be seen in measurements with two reference electrodes in a 4-electrode cell—one between anode and cathode (Ref1 in Fig. 3) and another behind the cathode (Ref2 in Fig. 3).
Figure 4a shows that the voltage curves during charging of 4-electrode full cells for the 1st, 2nd and 5th cycle are similar. Indeed, we found that the reference electrode Ref1 was still largely intact after cycling (see inset of Fig. 4a). However, weak pitting corrosion and ongoing SEI formation on the reference electrode surface in the dynamic environment between anode and cathode might be the cause for the slight changes in the curves of the different cycles in Figs. 4a, 4b.

Figure 4. Electrochemical data of a measurement with the 4-electrode pouch full cell (graphite/NCM111 in 1 M LiPF6 EC:DMC 1:1 wt%) for cycling with 0.2C up to 4.2 V at 25 °C. (a) Cell voltage during charge at different cycle counts (after formation). The inset shows the Li reference electrode (Ref1) after cycling at 10 °C/0.2C for 14 d and cell opening in a glove box. (b) Corresponding potential of Li electrode Ref1 against the second Li electrode Ref2 during charging. (c) Derivation of the potential between the reference electrodes, which corresponds to the Li+ activity changes in the electrolyte at the position of Ref1.
Download figure:
Standard image High-resolution imageThe voltage difference between the reference electrodes (ERef1-Ref2) is shown in Fig. 4b. It can be seen that ERef1-Ref2 changes during charging. Figure 4c depicts the derivative dERef1-Ref2/dQ of the data from Fig. 4b. Again, the data for the first few cycles show very similar trends. These measurements show that the position of the reference electrode is very important. For example, in aqueous lab cell setups, a position of the reference electrode near the working electrode is typically achieved by using a Luggin-Haber capillary.48 For Li-ion cells, a position between anode and cathode is also supported by simulations by Dees et al.49 and Delacourt et al.50
Besides measurements of the anode potential, 4-electrode pouch full cells are also helpful to measure the Li+ ion activity a[Li+] in front of the anode during charging. By measurement of changes of a[Li+] it is possible to investigate the influence on the Li+ insertion reaction into the graphite particles, the kinetic properties of the Li+ insertion reactions, and their influence among each other. Since Li+ ions are present in solution, Li metal electrodes are essential for such measurements, since they are electrodes of the first kind.
The measurement principle of the 4-electrode pouch full cell is the a[Li+] dependency of a metallic Li electrode. The Nernst equation describes this dependency:
In a 4-electrode setup (Fig. 3), it is possible to measure changes in the reference potential by measuring the voltage ERef1-Ref2 between the Li reference electrode between anode/cathode (Ref1) and the Li reference electrode in the inactive area behind the cathode (Ref2).
It has to be noted that the Nernst equation is a thermodynamic principle and therefore it is only valid in equilibrium situations. However, firstly in our setup there is no current flow between the two reference electrodes. Secondly, in our Li+ activity measurements, we apply only low C-rates in the order of 0.2C to stay near equilibrium conditions.
In the following we assume that a[Li+]Ref2 = const. in the electrochemically non active area of Ref2:
The fact that the potentials of both reference electrodes are present in this equation, underlines the importance of two reference electrodes to measure a[Li+]. Due to the connection in the experimental setup shown in Fig. 3, an increasing a[Li+] in the electrolyte between anode/cathode results in a more negative voltage difference ERef1-Ref2. As Fig. 4b shows, ERef1-Ref2 is negative but changes during charging. This means that a[Li+] in front of the anode surface does also change during charging, although the current is constant.
Additionally to the anode potential, a[Li+] can be used as a criterion for Li deposition.46 Danner et al. found in simulations that the conditions for Li deposition expands from the anode surface to the current collector during charging.46 For thick anodes, the authors reported that transport limitations can lead to strong Li+ concentration gradients (and consequently a[Li+] gradients) into the depth of anodes.46 Since Li deposition can only happen where Li+ ions are present, Danner et al. did not find Li deposition near the current collector.46 Similarly, it is likely that if a certain value of a[Li+] is exceeded in front of the anode surface, Li deposition will happen due to super saturation.43
Figure 5a shows that the anode potential vs Li/Li+ for a graphite/Li half cell charged a 0.2C at 10 °C decreases steadily (black curve). At this low C-rate, different graphite phases can be seen from this curve. For comparison the dERef1-Ref2/dQ curve is also plotted in Fig. 5a (red data points). The dERef1-Ref2/dQ curve does not change steadily, however, it shows different peaks corresponding to a[Li+] changes. Interestingly, these a[Li+] changes occur at the transitions of graphite stages.

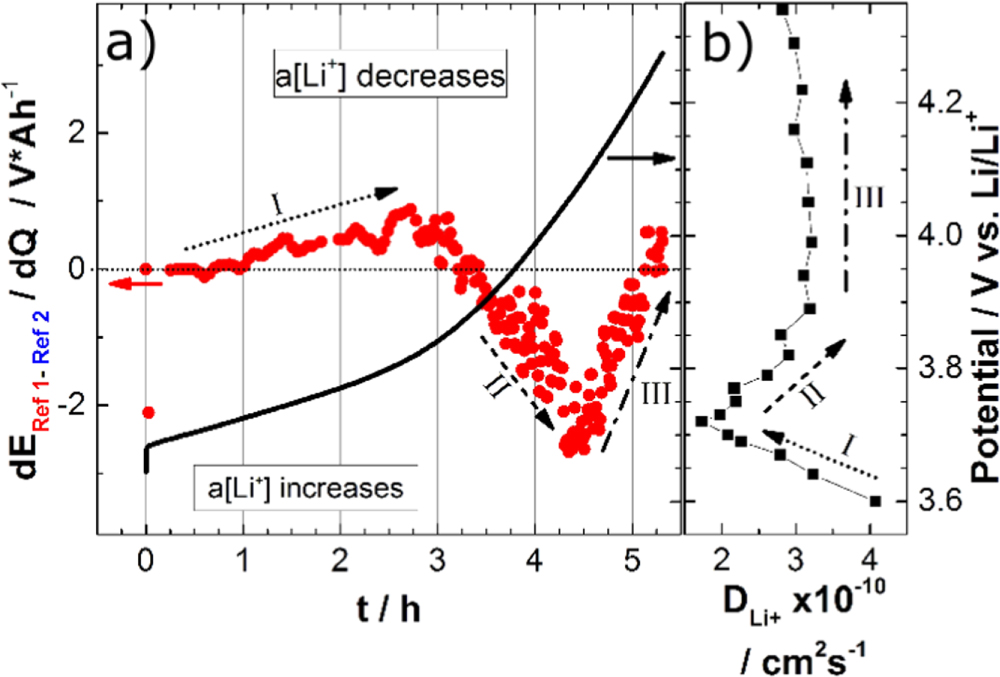
Figure 5. Correlation between the Li+ diffusion coefficient and the changes of the Li+ activity in the electrolyte for graphite. (a) Changes in the derivation of the Li electrode potential difference (ERef1-Ref2) during Li insertion into graphite for a graphite/Li half-cell at 0.2C/10 °C and the potential curve of the graphitic anode against the Li electrode Ref1. (b) dQ/dEAnode plot of the anode potential from (a) and literature data51 for the Li+ solid state diffusion coefficient in graphite.
Download figure:
Standard image High-resolution imageFigure 5b shows a plot of dQ/dEAnode derived from Fig. 5a together with the logarithm of the Li+ solid state diffusion coefficient in graphite taken from Funabiki et al.51 The data show that the diffusion constant is lowered at the graphite staging transitions. This means that the solid-state diffusion of Li+ in graphite is hindered several times during CC charging. Since the charging current during CC-charging is constant, a similar number of Li+ ions will arrive at the anode, independent from the diffusion inside the graphite. Consequently, a[Li+] is rising in the electrolyte on the anode surface, which is in accordance with the dERef1-Ref2/dQ data from the 4-electrode full cell. This is illustrated by a simplified model in Figs. 6a and 6b for slow and fast diffusion of Li in graphite at CC charging, respectively.

Figure 6. Simplified model for Li+ activity in front of the anode for (a) slow and (b) fast Li diffusion in graphite during CC charging.
Download figure:
Standard image High-resolution imageFurthermore, this coincides with the anode potential lowering stepwise at the phase transitions of lithiated graphite, since this increases the probability for Li deposition. Due to the constant current, it will be more likely that a larger part of the Li+ ions are deposited on the anode surface as a parallel reaction to intercalation.
This is consistent with the trends favoring Li deposition: lower temperatures,1,3,15,25,30,41 higher SOCs,15,42 and higher charging C-rates.3,15 While lower temperatures lower the probability to cross energy barriers, higher SOCs lead to slower solid diffusion in graphite by increasing the barrier heights. Similarly, higher charging currents lead to higher a[Li+] values near the anode in cases where the transport of Li+ ions to the anode is faster than intercalation.
This brings the cathode kinetics into play. Figure 7a shows the changes in the derivation of the reference electrode Ref1 in a NCM/Li half cell at 0.2C/10 °C. Figure 7b shows the solid diffusion coefficient of Li+ in NCM111 redrawn from Shaju et al.52 Obviously, the diffusion constant in NCM111 as a function of lithiation state (Fig. 7b) is different from that of graphite (Fig. 5b). However, both electrodes are involved in the charging process in a full cell (de-lithiation of cathode/lithiation of anode) and therefore there is an interaction between both.

Figure 7. Correlation between the Li+ diffusion coefficient and the changes of the Li+ activity in the electrolyte for NCM111. (a) Changes of dERef1-Ref2 (red data points) during de-lithiation of NCM111 in a half cell vs Li half at 0.2C/10 °C and the potential curve of the NCM111 cathode against the Li electrode Ref1 (solid line). (b) Redrawn literature data52 of the Li+ solid state diffusion coefficient in NCM.
Download figure:
Standard image High-resolution imageOur measurements showed that this significant interaction between anode and cathode is not negligible. Therefore, measurements of anode potentials should be carried out in full cells (e.g. graphite/NCM) rather than in half cells (e.g. graphite/Li).
Ideally, the Li+ transport inside the cathode, which includes Li+ diffusion in the active material and in the electrolyte inside the electrode (tortuosity respectively mass loading and density) should match that of the anode during charging, e.g. by a tailored blend cathode which has a similar Li transport properties as a function of SOC like the anode.
This could avoid an Li+ ion accumulation in front of the anode surface, which was already described Danner et al. in a model based analysis.46 For non-CC charging, this could lead to an improved fast-charging capability. In the next section, we show that this can also be achieved partially by optimized charging protocols in which the current is reduced during charging.
Optimized charging protocols to suppress Li deposition
Charging protocols can significantly change cycling aging behavior.15,53–55 One important category of charging protocols is based on a stepwise reduction of the charging C-rate, either with constant current (CC) or constant voltage (CV) steps. For such types of charging protocols, we suggest abbreviating n CC steps as (CC)n, e.g. (CC)2 for a 2-step protocol. Similarly, standard CC-CV charging would be named (CC-CV)1 = (CC-CV).
For example, based on simulations, Remmlinger et al. suggested a charging procedure in which the anode potential remains positive by reducing the charging current.56 Since the charging current is continuously reduced, this corresponds to a (CC)n protocol where n is a large number. Another approach was suggested in the patent by Bhardwaj et al., who used a 3-step (CC-CV)3 charging protocol in 3-electrode full cells, however, the CV-phases are comparably long.40 We recently applied a 2-step (CC)2 protocol to 3-electrode pouch full cells.54 In that study, the 3-electrode full cells with reference electrode were reconstructed from graphite anodes and NCA cathode of commercial 3.25 Ah 18650-type cells.54 Comparing long-term cycling tests with the original 18650 cells with optimized (CC)2 and standard CC-CV charging protocols resulted in significantly enhanced cycle life for the tests without Li deposition.54 However, the charging time was not enhanced compared to the conventional CC-CV protocol.54
Figure 8 shows an optimized (CC-CV)4 charging protocol. In this charging strategy, the Li+ super-saturation on the anode surface caused by too high charging currents is prevented. The reduced current (green curve lower part of Fig. 8a) during the CV step leads to an decrease of a[Li+] (blue data points in lower part of Fig. 8a) and the anode potential vs Li/Li+ does not drop below 0 V vs Li/Li+ (red curve in upper part of Fig. 8a).

Figure 8. (a) Multiple (CC-CV)4 charging protocol with reduced charging duration while avoiding Li deposition, because a Li+ ion super-saturation caused by high charging current is prevented. The reduced current (green curve) during the constant cell voltage (black curve) step leads to an decrease of Li+ activity (blue data points) and the anode potential does not drop below 0 V vs Li/Li+. (b) Cell voltage and anode potential over time for multiple (CC-CV)4 charging, as well as the 0.2C (CC) and 0.5C (CC) charging protocol.
Download figure:
Standard image High-resolution imageFigure 8b shows a comparison of different charging protocols. For (CC) charging at 0.5C (black curve in Fig. 8b) the cell can be charged within 2 h, however this leads to negative anode potentials vs Li/Li+ and consequently to Li deposition (black dotted line). A reduction of the charging rate 0.2C leads to positive anode potentials (blue curves), avoiding Li deposition, however, the charging time is increased to ∼5 h. In contrast, the (CC-CV)4 charging protocol (red curves) allows to charge the cell in the fastest way (∼1.7 h) while retaining positive anode potentials vs Li/Li+. Compared to the 0.2C protocol the charging time is decreased by ∼68%.
Recently, we had reconstructed graphite anodes and NCM cathodes from commercial 16 Ah pouch cells into 3-electrode full cells with a Li reference electrode.15 These cells were systematically measured with different combinations of charging C-rates, ambient temperatures, and until various end-of-charge voltages.15 The results of the anode potentials in our lab were in accordance with long-term cycling tests with the original 16 Ah pouch cells performed at other EU-based institutes, i.e. faster aging correlated with for lower anode potentials.15 In the following, we show that the data from that paper15 can be used to construct an optimized (CC)5 charging protocol for the 16 Ah cells which is avoiding negative anode potentials.
Figure 9a shows the current as a function of charging time for standard (CC-CV) charging at 3C (blue dashed curve) and optimized (CC)5 charging (black solid curve). Please note that the starting current is 48 A, which could in principle be higher, however in this example it was limited by the equipment (max. 50 A). Furthermore, please note that for both charging protocols, the same amount of charge (12 Ah) is stored in the cells for the first cycle (both protocols charge from 10% to 90% SOC).

Figure 9. Comparison of charging protocols with commercial 16 Ah pouch cells. (a) Current profile for standard 3C (CC-CV) charging (dashed blue line) and optimized 5-step (CC)5 charging protocol (black solid line). The protocol was deduced from reconstructed 3-electrode pouch cells and applied to the original 16 Ah pouch cells. (b) Comparison of cycle stability for 3C (CC-CV) charging (dashed blue line) and (CC)5 charging (black solid line) with 16 Ah pouch cells.
Download figure:
Standard image High-resolution image
The data in Fig. 9 is exemplarily shown for an ambient temperature of 25 °C. For other ambient temperatures different parameters must be used. We further note that the heating of the 16 Ah cells due to current flow was not taken into account here. From previous tests it is known that the smaller 3-electrode pouch full cells show nearly no heating compared to larger cells.54,57 The reason is the lower number of electrode layers and the different volume/surface ratio of the cells, leading to a stronger heat dissipation of the smaller cells.57
For CC-CV charging, the CV-phase is long compared to the CC-phase (Fig. 9a). Therefore, 37 min are needed to charge the cell. In contrast, the (CC)5 charging protocol needs only 23.4 min to charge the same capacity into the cell, corresponding to a reduction by ∼36% charging time, while 12 Ah are charged in both cases.
In CC-CV charging, 4.2 V is reached quite early which is then kept constant and consequently the current is decreased. In contrast, the current is kept constant until a certain critical voltage is reached in the (CC)5 protocol. These critical voltages correspond to transitions to negative anode potentials measured in 3-electrode pouch full cells.15
Comparing the two voltage profiles in Fig. 9a one can see that the current decrease in both charging protocols is similar but not the same. The CC phases in the (CC)5 protocol are in most cases longer compared to the CV-phase of the (CC-CV) protocol. This leads to more charge stored earlier in the (CC)5 protocol. This also leads to the faster charging and can be seen in the area of the (CC)5 current profile over the CV curve, since this area corresponds to a charge current vs time diagram.
Figure 9b shows a comparison of the two different charging protocols in long-term cycling tests with 16 Ah pouch cells. The capacity retention is based on a comparison of the ratio of the capacity in each cycle with the capacity of the first cycle. It can clearly be seen that the cycle life for the (CC)5 protocol is significantly enhanced. While the cell with the standard CC-CV protocol shows a capacity retention of ∼81% after 4000 cycles, the cell with the (CC)5 retained ∼89% after the same number of cycles. The improved charging strategy leads to an enhancement of cycle life of in the order of ∼170% with both protocols tested with the commercial 16 Ah cell. This improvement in the cycle stability is in accordance with our earlier results on the (CC)2 charging with 3.25 Ah 18650-type cells, which showed an improvement of ∼200%.54 However, for the charging protocol presented here, the charging time was reduced, which was not the case in our earlier study.54
Conclusions
Investigations with 4-electrode cells with two reference electrodes showed the following new insights:
- 1)The position of the Li reference electrode is very important. If the reference electrode is placed in the electrochemically active volume between anode and cathode, a different result is obtained compared to a reference electrode far away from the electrode stack (behind the cathode).
- 2)Using a cell with two reference electrodes in combination with the Nernst equation, it is possible to perform operando Li+ activity measurements between anode and cathode by measuring the voltage difference between the reference electrodes inside and outside the stack. For such measurements with Li+ ions, Li metal electrodes are best suited since they are electrodes of first kind.
- 3)The Li+ activity is a criterion for Li deposition. If a critical activity value is exceeded in front of the anode surface, Li deposition will most likely happen due to super saturation. This critical activity is directly correlated with (i) the transition of the graphite stages, (ii) the solid diffusion coefficient of Li+ in graphite, and (iii) the zero-crossing of the anode potential vs Li/Li+.
- 4)Our measurements showed that there is a significant non-negligible interaction between anode (e.g. graphite) and cathode (e.g. NCM). This interaction is based on the diffusion constants of Li+ in anode and cathode. Therefore, measurements should be carried out in full cells rather than in half cells to obtain reasonable results. This is especially important e.g. for anode/cathode balancing in the development of large full cells, since the anode/cathode interaction is not included in half cells.
Optimized charging procedures can be based on measurements of anode potentials vs Li/Li+ in 3-electrode full cells or on Li+ activity measurements in 4-electrode full cells. The results with different cell types show that a significant reduction of charging time by up to ∼70% is possible while the cycle life can be enhanced by up to ∼200%. The exact parameters for such improvements depend on the type of electrodes and materials and therefore have to be determined individually for each cell type. Since Li deposition is avoided by the optimized charging protocols, it can be expected that the safety properties are retained even under fast-charging conditions.
Our results provide insights into a new mechanism for modelling of material and electrode diffusion rate limitations in fast-charging of Li-ion cells. In further studies, tailored materials (e.g. blends) regarding SOC dependent transport properties, as well as anode cathode matching should be investigated. Furthermore, tailored anodes with improved materials and intercalation kinetics must be developed. Investigations on this direction are underway in our lab.
Acknowledgments
The authors would like to thank G. Carbonari and R.-S. Scurtu (ZSW) for reviewing the manuscript before submission and for helpful discussions.