
Abstract
Temperature gradients can move water within the porous media of a polymer electrolyte fuel cell through phase-change-induced (PCI) flow. It is critical to understand PCI flow so that control and distribution of water within a fuel cell can be accomplished. This work investigates the role of architecture, specifically anode land width, on overall cell water content and distribution in the through-plane direction. A specially-designed 4.8 cm2 fuel cell with precise thermal boundary conditions was imaged with neutrons using two different anode flow field configurations. A new, non-dimensional thermal transport number was developed which quantifies the relative influence of PCI flow on cell water transport. It was found that anode lands larger than the cathode lands cause large thermal gradients that instigate net water flux from the cathode to the anode. An asymmetric configuration with larger anode lands was found to have large changes in water content that were strongly sensitive to cell operating conditions. The thermal transport number developed here enables deduction of the net flux condition based on operating conditions and architecture. This approach enables design of high-performance systems with balanced water management.
Export citation and abstract BibTeX RIS

This is an open access article distributed under the terms of the Creative Commons Attribution 4.0 License (CC BY, http://creativecommons.org/licenses/by/4.0/), which permits unrestricted reuse of the work in any medium, provided the original work is properly cited.
Due to the high power-to-volume output of fuel cells, strong temperature gradients can exist. These gradients can be as high at 15 °C across a 200 μm layer.1–3 The temperature difference across the diffusion media (DM) has a strong influence on water transport via thermally-driven transport. This process is known as phase-change-induced (PCI) flow, or the heat-pipe effect, and has been shown to have a strong influence on water transport.4–7 In perfluorosulfonic acid membranes, a separate temperature gradient-driven process known as thermo-osmosis has been observed. PCI flow is a result of local concentration changes induced by temperature and phase change within the cell. Cold locations have a lower dew point, resulting in condensation, which reduces the vapor-phase water concentration; this condensation drives water vapor via diffusion from areas of higher local humidity. Such behavior has been observed directly in the nm-scale pores of the MPL.8 This process results in water vapor transport from the hot locations near the catalyst layers to the cooler regions near the channels.
Control of the thermal properties of the cell can be achieved in several ways, including the DM thermal conductivity, presence of a microporous layer (MPL), and flow field/DM interface. Effective thermal conductivity of the DM can vary significantly depending on internal morphology and can increase by over 100% when partially saturated with liquid water during operation.1,9–15 Saturation increases the effective thermal conductivity by displacing lower thermal conductivity air with higher conductivity liquid water. The addition of MPL coatings to the macro DM improves thermal transport by providing improved thermal contact between the DM and the catalyst layer. Additionally, the bulk dry thermal conductivity of the MPL tends to be higher than the large-pore macro layer due to high graphite content and better fiber-to-fiber contact.16–18 Channel and land width and spacing also influence heat removal from the cell and the through-plane thermal gradient as the thermal boundary condition between the land (conduction) compared to the channel (convection) is very different, leading to in-plane temperature gradients as well. Careful consideration must be given to channel and land widths to provide appropriate area for heat removal.19–21 Channel and land widths also influence cross-flow (directly between channels, rather than around a switchback) and transverse water transport for water formed at the MPL∣catalyst layer interface.22–24
The motivation of this study is to understand the influence of channel-land configuration and asymmetric anode∣cathode channel patterns, specifically asymmetric heat transfer boundary conditions, on PCI flow and cell water balance. High resolution neutron imaging was used to investigate the internal through-plane liquid water profiles from the anode to the cathode DM for two fuel cell configurations. A non-dimensional thermal transport number (TTN) is proposed here to quantify the influence of channel-land configuration on cell water balance. The work described here is adapted from the dissertation of Jacob LaManna.25
Method of Approach
Cell design
A 4.8 cm2 active area fuel cell was developed to facilitate high resolution neutron imaging with precise thermal boundary conditions. The cell has a narrow 9 mm × 53 mm active area to reduce geometric unsharpness and beam hardening effects. Coolant channels were directly behind the current collectors to provide precise thermal boundary conditions on the cell. Coolant temperature was controlled via circulating bath with ±0.2 °C accuracy. Additional details on the cell, along with information on reduction of the neutron images and appropriate corrections, can be found in Ref. 25.
To better understand the driving force behind water accumulation in the anode seen in previous work,25 two flow field configurations were tested: the baseline asymmetric configuration developed in Ref. 26 and a new, symmetric flow configuration. This symmetric configuration uses the 1 mm cathode pitch from the asymmetric configuration for both the anode and cathode, as shown in Fig. 1. The symmetric and asymmetric flow fields consist of a triple serpentine flow pattern with 0.5 mm square channels. The symmetric pattern has 0.5 mm wide lands on both the anode and cathode whereas the asymmetric pattern has 1.5 mm wide anode lands and 0.5 mm wide cathode lands.

Figure 1. Channel and land dimensions for asymmetric (a) and symmetric (b) configurations.
Download figure:
Standard image High-resolution imageThe materials tested were the same as in previous work.25 The DM used was Mitsubishi Rayon Corporation (MRC) U105 with 230 μm thickness, 6 wt% PTFE, and 30 μm MPL coating. W.L. Gore & Associates, Inc. Select Series 5720 18 μm thick membranes with 0.3 mg cm−2 cathode loading and 0.05 mg cm−2 anode loading were used. To understand the role of thermal conductivity of the DM on anode water accumulation, SGL 25BC was tested on a limited basis. MRC U105 has a thermal conductivity of 0.18 W m−1-K−1 1 while SGL 25BC has a higher thermal conductivity of 0.35 W m−1 -K−1.1,2,9
Test facility
Neutron imaging was conducted at the BT-2 Neutron Imaging Facility at the NIST Center for Neutron Research located in Gaithersburg, MD. Imaging was achieved with the 15 μm effective resolution microchannel plate detector. The Neutron Imaging Facility has standard fuel cell testing equipment (Micro Instrument Corp hardware with LabView software) that allows precise control of gas flow rates, gas composition, gas and cell temperatures, gas humidification, inlet and outlet pressure, current, and voltage.
Each test case was run for 5 min to stabilize and then imaged for 20 min at steady state. The long image length was required to achieve sufficient neutron counts for each image; additionally, stable operating conditions (e.g. current, voltage, temperature, humidity) were verified during the exposure time. Detailed information regarding reduction of the neutron images to water thickness and conversion to saturation can be found in Ref. 25. In short, liquid water attenuates neutrons passing through the test cell; by comparing a neutron radiograph with no test cell, a radiograph with a dry test cell, and a radiograph of a saturated/operating test cell, water content can be measured. Porosity data for the MRC diffusion media was obtained from Ref. 27.
Test conditions
Test conditions were the same as described in Ref. 25 to allow for direct comparison of the symmetric and asymmetric cell configurations. Tested variables include current density, cell temperature, inlet relative humidity, exhaust pressure, and water balance. Flow rate was held constant across all test conditions regardless of current density with an equivalent stoichiometric ratio of 2∣2 (anode∣cathode) at 1.2 A cm−2. Inlet relative humidity was held at a constant 95∣95%RH (anode∣cathode) during exhaust pressure testing while exhaust pressure was held constant at 150∣150 kPa(a) (anode∣cathode) during relative humidity testing. An overview of conditions tested is given in Table I. Cell water balance was measured for select test cases by collecting all exit water with desiccants. By collecting exit water in this manner, the overall net water flux could be verified; insight regarding the processes that contribute to that measured net water flux is the subject of the model formulation described next.
Table I. Operating parameters.
| Operating parameters | Values [units] |
|---|---|
| Current Density | 0.1, 0.4, 0.8, 1.2, 1.5 [A cm−2] |
| Temperature | 40, 60, 80 [°C] |
| Pressure Gradient anode∣cathode | 100∣150, 150∣150, 150∣100 [kPa(a)] |
| Concentration Gradient anode∣cathode | 50∣50, 95∣50, 50∣95, 95∣95 [inlet %RH] |
Thermally driven flow model
Two-dimensional temperature distributions were calculated for the symmetric and asymmetric configurations for dry and wet cases using COMSOL 4.3a. A detailed description of how thermal conductivity is adjusted for saturation is given in Ref. 28. Heat generation was determined using Eq. 1.2
Where i is current density, tcl is the catalyst layer thickness, T is temperature, ΔS is the half-cell entropy change, n is the number of electrons per mole of reactant, F is the Faraday constant, and η is the overpotential. The entropy change for the cathode reaction is −326.36 J mol−1-K−1 and 0.104 J mol−1-K−1 for the anode. Joule heating is considered for the membrane. The values for the variables in Eq. 1 and used in the computational model are given in Table II.
Table II. Model parameters.
| Variable | Value |
|---|---|
| current density 1 | 0.1 A cm−2 |
| current density 2 | 0.4 A cm−2 |
| current density 3 | 0.8 A cm−2 |
| current density 4 | 1.2 A cm−2 |
| current density 5 | 1.5 A cm−2 |
| voltage 1 | 0.8 V |
| voltage 2 | 0.7 V |
| voltage 3 | 0.625 V |
| voltage 4 | 0.55 V |
| voltage 5 | 0.5 V |
| DM dry thermal conductivity | 0.18 W m−1-K−1 |
| CL thermal conductivity | 0.3 W m−1-K−1 |
| Membrane thermal conductivity | 0.16 W m−1-K−1 |
| DM thickness | 200 μm |
| CL thickness | 10 μm |
| Membrane thickness | 18 μm |
The 2-D temperature profiles were generated and then used to calculate the PCI flux across the anode and cathode diffusion media. Temperature profiles are taken along the DM∣CL and DM∣channel interfaces for both DM and are used to calculate water vapor concentration gradients across each DM via Eq. 2.

With concentration as a function of temperature, Fick's Law of Diffusion (Eq. 3) was used to calculate the maximum flux across each DM for each node along the interface.

To determine which half of the cell had the dominant PCI flux, a new parameter was developed. This parameter is called the thermal transport number (TTN) and represents the normalized cathode PCI flux with respect to generated water subtracted from the normalized anode PCI flux, as shown in Eq. 4.
This equation represents the maximum thermal transport driving force for water transport. A positive TTN value represents a preference for transport away from the anode while a negative number implies a preference for transport away from the cathode. Assuming the anode and cathode sides of the membrane have the same water content, and the membrane has zero resistance for water transport, a positive TTN would draw water to the anode from the cathode layer by creating a diffusion gradient across the membrane.
Results and Discussion
Neutron imaging
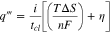
Water thickness data measured with neutron imaging was converted to local saturation values for each condition. Figure 2 shows that water saturation varies significantly between the two configurations at 40 °C and over a range of fuel cell exhaust pressures. The asymmetric configuration has large sensitivity to the imposed gradient with a large range of anode water content. Maximum saturation varies from approximately 15% for the 150∣100 kPa case to 60% for the 100∣150kPa case. This sensitivity is not seen in the symmetric configuration. Maximum anode water content does not scale 1:1 with land width as the asymmetric configuration has 3 times the land width but only double the water content. The cathode saturation profiles for both configurations follow similar trends with matching boundary saturation values at the MPL and the flow field. The increase in peak water content from 30% for asymmetric to 35% for the symmetric configuration indicates improved water removal from the cathode. This would agree well with the reduction in anode water content.
Figure 2. Exhaust pressure condition saturation profiles for 0.8 A cm−2 at 40 °C test conditions for asymmetric and symmetric configurations. Test conditions: 95∣95% inlet RH, constant gas flow rates with equivalent 2∣2 stoichiometry at 1.2 A cm−2.
Download figure:
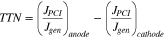
Standard image High-resolution imageFor a fuel cell temperature of 60 °C, exhaust pressure saturation profiles are compared for both configurations at 1.2 A cm−2. Similar trends are seen at 60 °C (Fig. 3) as seen at 40 °C with small variation between symmetric configurations and large water accumulations in the asymmetric configurations. Large variation in the asymmetric water content between cases is not seen at 60 °C due to the critical maximum saturation level being reached. This is evident by the fact that the 100∣150 kPa and 150∣150 kPa [anode∣cathode] profiles overlay each other. At this point liquid water connects across the lands to facilitate drainage, thus limiting increases in saturation beyond this point. Cathode peak saturation increases for the symmetric configuration from approximately 30% to 35% due to increased water removal on the cathode side. The boundary conditions for the cathode remain consistent between configurations even with increased peak saturation for the symmetric configuration. This is expected as the DM boundaries (MPL and flow field) are identical between configurations and this behavior should follow between the two.
Figure 3. Saturation profiles for exhaust pressure conditions at 60 °C operating at 1.2 A cm−2. Test conditions: 95∣95% inlet RH, constant gas flow rates with equivalent 2∣2 stoichiometry at 1.2 A cm−2.
Download figure:
Standard image High-resolution imageThe reduction in anode water content in the symmetric configuration indicates both a reduction in back diffusion of water from the cathode to the anode and reduced storage due to a change in critical saturation level. Cell water balance was measured for all pressure conditions for both configurations at 60 °C to determine the reduction in back diffusion from the cathode to anode. It can be seen for all cases in Fig. 4 that the symmetric configuration has a larger cathode removal fraction of generated water than the asymmetric configuration. This implies that the asymmetric configuration has greater back diffusion to the anode than the symmetric configuration. The large anode lands of the asymmetric configuration provide large cool regions that drive thermal transport from the cathode to the anode. To further understand the interplay between land geometry and DM thermal properties on the water balance of the cell, an asymmetric cell was built with SGL 25BC diffusion media and imaged. SGL 25BC has similar thickness, porosity, and PTFE content while having double thermal conductivity of the MRC. Figure 5 shows that the SGL asymmetric configuration has significantly lower water content than the MRC asymmetric configuration. By increasing the DM thermal conductivity, the peak temperature of the cell decreased from 74.2 °C to 67.7 °C which significantly reduces the thermal driving force for PCI flux across the cell.

Figure 4. Water balance comparison for symmetric and asymmetric configurations at 60 °C exhaust pressure test conditions.
Download figure:
Standard image High-resolution image
Figure 5. Saturation profiles for exhaust pressure conditions at 60 °C operating at 1.2 A cm−2 comparing asymmetric and symmetric configurations with MRC diffusion media and asymmetric configuration with SGL diffusion media. Test conditions: 95∣95% inlet RH, constant gas flow rates with equivalent 2∣2 stoichiometry at 1.2 A cm−2.
Download figure:
Standard image High-resolution imageAt 60 °C, inlet gas stream relative humidity was varied for both the anode and cathode to determine the influence of concentration-driven flow across the cell. Figure 6 shows that the symmetric configuration is invariant with inlet relative humidity while the asymmetric configuration exhibits high sensitivity of saturation depending on humidity levels. As with the pressure conditions, cathode boundary interfaces are similar between configurations, indicating no change in boundary interaction due to increased or decreased levels of water transport. The symmetric configuration has decreased anode water content while the cathode has a higher peak saturation that shows a larger flux of water is transported out via the cathode than in the asymmetric configuration. Cathode variability in the asymmetric configuration follows anode saturation levels with lower cathode saturation for the two dryer anode cases.
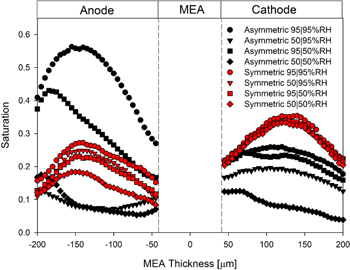
Figure 6. Saturation profiles for relative humidity conditions at 60 °C operating at 1.2 A cm−2. Test conditions: 95∣95% inlet RH, constant gas flow rates with equivalent 2∣2 stoichiometry at 1.2 A cm−2.
Download figure:
Standard image High-resolution imageWater content is significantly reduced for both configurations when the temperature is raised to 80 °C as shown in Figs. 7 and 8. The higher temperature facilitates greater vapor transport and reduced levels of condensation within the DM. As seen at the lower temperatures, the asymmetric configuration has higher anode saturation than the symmetric configuration for both the exhaust pressure conditions and inlet relative humidity conditions. A slight increase in cathode saturation is seen for the symmetric configuration; this shows increased water removal through the cathode. The decrease in water content for both configurations allowed all test conditions to run through the entire test duration. Operating voltages for all test conditions presented in this section are given for both configurations in Table III.

Figure 7. Saturation profiles for exhaust pressure conditions at 80 °C operating at 1.5 A cm−2. Test conditions: 95∣95% inlet RH, constant gas flow rates with equivalent 2∣2 stoichiometry at 1.2 A cm−2.
Download figure:
Standard image High-resolution image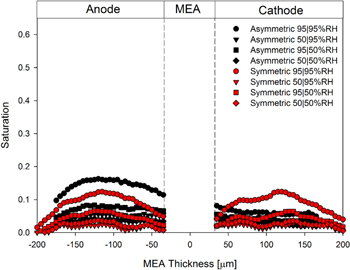
Figure 8. Saturation profiles for relative humidity conditions at 80 °C operating at 1.5 A cm−2. Test conditions: 95∣95% inlet RH, constant gas flow rates with equivalent 2∣2 stoichiometry at 1.2 A cm−2.
Download figure:
Standard image High-resolution imageTable III. Average operating voltages for measured NR profiles.
| Voltage [V] | |||
|---|---|---|---|
| Conditions | Asymmetric | Symmetric | |
| 40 °C | 100∣150 kPa, 95∣95 %RH, 0.8 A cm−2 | 0.608 | 0.651 |
| 150∣150 kPa, 95∣95 %RH, 0.8 A cm−2 | 0.690 | 0.608 | |
| 150∣100 kPa, 95∣95 %RH, 0.8 A cm−2 | 0.701 | 0.634 | |
| 60 °C | 100∣150 kPa, 95∣95 %RH, 1.2 A cm−2 | 0.661 | 0.594 |
| 150∣150 kPa, 95∣95 %RH, 0.1 A cm−2 | 0.826 | 0.845 | |
| 150∣150 kPa, 95∣95 %RH, 0.4 A cm−2 | 0.753 | 0.761 | |
| 150∣150 kPa, 95∣95 %RH, 0.8 A cm−2 | 0.695 | 0.701 | |
| 150∣150 kPa, 95∣95 %RH, 1.2 A cm−2 | 0.618 | 0.558 | |
| 150∣150 kPa, 95∣95 %RH, 1.5 A cm−2 | 0.580 | 0.560 | |
| 150∣100 kPa, 95∣95 %RH, 1.2 A cm−2 | 0.652 | N/A | |
| 50∣95 %RH, 150∣150 kPa, 1.2 A cm−2 | 0.667 | 0.597 | |
| 95∣50 %RH, 150∣150 kPa, 1.2 A cm−2 | 0.576 | 0.592 | |
| 50∣50 %RH, 150∣150 kPa, 1.2 A cm−2 | 0.650 | 0.598 | |
| 80 °C | 100∣150 kPa, 95∣95 %RH, 1.5 A cm−2 | 0.496 | 0.577 |
| 150∣150 kPa, 95∣95 %RH, 1.5 A cm−2 | 0.508 | 0.608 | |
| 150∣100 kPa, 95∣95 %RH, 1.5 A cm−2 | 0.383 | 0.569 | |
| 50∣95 %RH, 150∣150 kPa, 1.5 A cm−2 | 0.670 | 0.637 | |
| 95∣50 %RH, 150∣150 kPa, 1.5 A cm−2 | 0.665 | 0.594 | |
| 50∣50 %RH, 150∣150 kPa, 1.5 A cm−2 | 0.619 | 0.594 | |
Thermal transport influence on water balance
To better understand the driving force behind the large water accumulation in the asymmetric configuration, it is necessary to understand the influence of the large anode lands on the 2-D temperature profile. Heat transfer models in COMSOL are used to solve for the 2-D temperature distribution for a 2 mm long representative segment for both configurations. This domain represents the distance required for symmetric boundary conditions for the asymmetric configuration. The TTN is determined along every node along the 2 mm domain which is plotted in Fig. 9. This figure shows the TTN profiles for the 150∣150 kPa cases for each configuration. A positive TTN indicates a preference towards anode-driven water balance while a negative number indicates cathode-driven water balance. Anode and cathode lands for both configurations are overlaid with the plot to show how they influence the TTN.
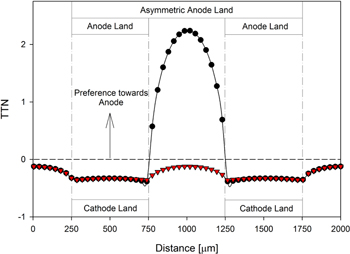
Figure 9. TTN plot for 150∣150 kPa(a) case at 60 °C and 1.2 A cm−2 showing how channels and lands align with profile. Asymmetric (black) and symmetric (red).
Download figure:
Standard image High-resolution imageIt is evident in Fig. 9, the symmetric configuration favors cathode transport while the asymmetric configuration has a large positive spike in the center of the domain that aligns with the center of the large anode land. This spike is due to the insulating effect the cathode channel has in the center of the domain which results in a low CL-to-channel temperature gradient on the cathode side. The large thermal driving force towards the anode in the asymmetric configuration allows pumping action to draw water to the anode where it collects over the large lands. Transport to the anode is facilitated by the fact that cationic membranes such as those used here preferentially pump water from hot to cold side via thermo-osmosis.7,29,30 Variation in the TTN for the symmetric configuration is small compared to the asymmetric configuration. This indicates that water accumulation should be lower for the symmetric configuration which agrees well with the neutron imaging data.
The TTN plot can be used to describe the variation in the asymmetric configuration for the exhaust pressure tests as shown in Fig. 10. It can be seen for both configurations that the 100∣150 kPa exhaust pressure case has the strongest preference towards the anode. The integrated value of the 100∣150 kPa case for the symmetric configuration is only 65% of the integrated TTN value for the asymmetric configuration. The lower saturation seen in the symmetric 100∣150 kPa case when compared to the 150∣150 kPa asymmetric case indicates that land width strongly influences water storage. The lag seen in water accumulation for the asymmetric configuration in the 150∣100 kPa case is due to the larger preference towards the cathode compared to the other two cases. Water flux across the membrane is reduced in this condition requiring additional time to accumulate water in the anode DM.
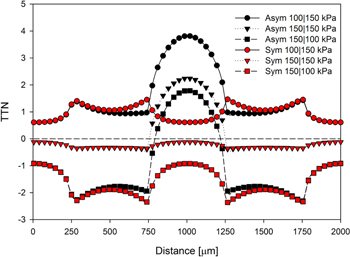
Figure 10. TTN plots as a function of pressure gradients at 60 °C and 1.2 A cm−2 along model domain length.
Download figure:
Standard image High-resolution imageAs has been shown in previous work,1 saturation strongly influences thermal conductivity; similarly, saturation influences the temperature gradient based driving force for thermally-driven transport. Increased thermal conductivity can reduce peak temperature in the symmetric configuration by 8.1 °C and the asymmetric by 8.4 °C at 1.2 A cm−2. Temperature profiles were calculated to determine wet TTN values using the saturation values from the neutron images to determine wet thermal conductivity for both configurations. The TTN values for both configurations for wet conditions at 150∣150 kPa are given in Fig. 11. large attenuation can be seen for maximum TTN due to the reduction in driving force and increased diffusion resistance due to liquid water accumulation. This shows that thermally-driven water transport continuously changes during fuel cell operation, with the highest driving force available when operating with no liquid water in the cell. The value of TTN will slowly decay as water builds up in the cell by reducing peak temperature and increasing diffusion resistance until a balance occurs in the cell. If a large transient draining event occurs during steady current density operation, the water balance can swing back towards the anode resulting in a rapid refilling of the anode DM. For full scale fuel cells operating in counter-flow, rapid anode water accumulation can occur close to the anode inlet as water buildup near the cathode exit would reduce water transport through the cathode and force it over to the anode.
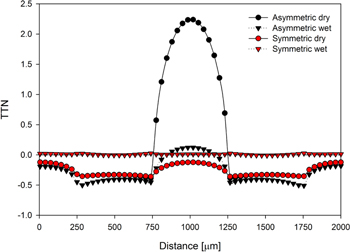
Figure 11. TTN plot for wet conditions at 60 °C and 1.2 A cm−2 for 150∣150 kPa case showing a nearly 66% attenuation in maximum TTN influence.
Download figure:
Standard image High-resolution imageVapor carrying capacity of the gases increases significantly (and in a highly non-linear fashion) with increasing temperature; it is expected that the maximum TTN value would increase with operational temperature. A fourfold increase in TTN is seen in Fig. 12 as temperature increases from 40 °C to 80 °C for the asymmetric configuration operating at the 150∣150 kPa test case. The increase for the symmetric configuration towards cathode preference is more subdued due to the more identical anode and cathode temperature gradients. This shows that during cold startup, thermally-driven transport would be a smaller percentage of the entire transport makeup but would become the dominant driving force at normal operating temperatures.
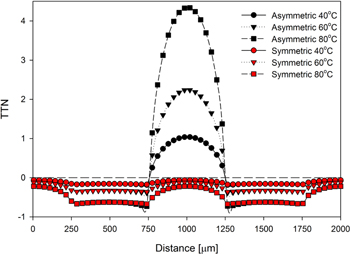
Figure 12. TTN as a function of operating temperature along the computational domain for 150∣150 kPa test condition at 1.2 A cm−2.
Download figure:
Standard image High-resolution imageIt is important to understand how current density affects thermally-driven transport as this affects operational voltage and heat generation within the cell. For the conditions in this work, saturation increases with increasing current density as shown in Fig. 13. little water buildup is seen at the lowest current densities due to the constant flow rates used, resulting in stoichiometric ratios in the range of 20 for 0.1 A cm−2. It is noted here that the symmetric configuration could not reach a stable 1.5 A cm−2; mass transport limitation resulted in cell shutdown for the relatively saturated cathode. Figure 14 shows the TTN plots for both symmetric and asymmetric configurations for five current densities increasing from 0.1 A cm−2 to 1.5 A cm−2 at 60 °C. For the symmetric configuration, the TTN indicates PCI flux towards the cathode at all current densities, leading to greater cathode saturation seen in Fig. 13. Generally, it can be seen that the operational current density has only a minor influence on the TTN value as the PCI flux is normalized with the water generation for the given current density. Due to the saturation remaining low at the 0.1 and 0.4 A cm−2 current densities, thermally-driven flow remains constant for the duration of the test whereas the higher current densities decrease in TTN value with increasing saturation. Thermally-driven flow can be the dominant transport mode across all current densities for the asymmetric configuration. This makes thermal design an important consideration even for fuel cells that operate only at low current densities.
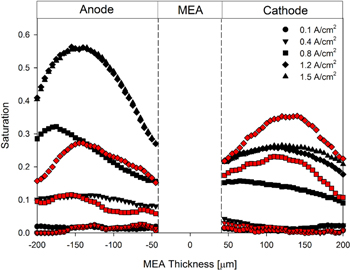
Figure 13. Saturation profiles as a function of current density at 60 °C for the 150∣150 kPa(a) test condition. Asymmetric configuration shown in black and the symmetric configuration is shown in red.
Download figure:
Standard image High-resolution image
Figure 14. TTN plot as a function of current density at 60 °C for the 150∣150 kPa(a) test condition. Asymmetric configuration shown in black and the symmetric configuration is shown in red.
Download figure:
Standard image High-resolution image
Conclusions
In this work, the influence of anode land width and, more generally, thermal boundary conditions in the flow field/DM interface on cell water content and transport has been investigated. By designing a cell with asymmetric flow field geometry with 1.5 mm anode lands and 0.5 mm cathode lands, large quantities of generated water can be driven to the anode. The large anode lands provide a large cooling area that pumps water to the anode from the cathode. In conjunction with the large flux of water to the anode, the large lands allow high levels of saturation (60%) to accumulate above the lands compared to the maximum of 30% seen for the symmetric configuration with 0.5 mm anode and cathode lands.
Thermal transport is highly dependent on the saturation quantities in the diffusion media as liquid water has a strong influence on the apparent thermal conductivity of the DM. Liquid water increases the effective thermal conductivity of the DM allowing larger quantities of heat to be rejected from the cell which lowers the maximum driving force for thermally driven flow. In addition to the reduction in driving force, liquid water saturation also increases the diffusion resistance of the DM which also reduces the maximum thermally-driven flux of water vapor.
Thermal design of fuel cells is critical to achieve high performance since temperature gradients strongly influence water transport. With proper design of flow fields, coolant channels, and selection of materials, water transport can be optimized to drive water to desirable locations of the cell. This could be implemented to reduce the large anode water accumulation as seen in this work to improve shutdown purge performance and durability or used to increase water transport to prevent anode side membrane dry out at ultra-high current densities in high performance fuel cells.31
Acknowledgments
This work is funded by the United States Department of Energy Office of Energy Efficiency and Renewable Energy (EERE) under contract number DE-EE0000470. The authors would like to thank Dr. Daniel Hussey, Dr. David Jacobson, and Eli Baltic of NIST for their help with running and analyzing the neutron imaging experiments.
Disclaimer
This report was prepared as an account of work sponsored by an agency of the United States Government. Neither the United States Government not any agency thereof, nor any of their employees, makes any warranty, express or implied, or assumes any legal liability or responsibility for the accuracy, completeness, or usefulness of any information, apparatus, product, or process disclosed, or represents that use would not infringe privately owned rights. Reference herein to any specific commercial product, process, or service by trade name, trademark, manufacturer, or otherwise, does not necessarily constitute or imply its endorsement, recommendation, or favoring by the United States Government or any agency thereof. The views and opinions of authors expressed herein do not necessarily state or reflect those of the United States Government or any agency thereof.