
Abstract
Due to the close contingency between human health and their socio-economic well-being with regards to environmental pollution, environmental monitoring of various pollutants is global cause for concern. There is an urgent need for developing a sensing device that is capable for multiplex detections, cost-effective, rapid, sensitive, portable, and selective. With the advancement in the field of nanotechnology, nanocomposites are emerging as model modifier components for fulfilling the aforementioned needs and amplifying the electrochemical detection mechanisms. The interactions between the multiple components in the nanocomposite and their synergistic effects makes it superior and enhances the performance of the electrochemical sensor compared to when a singular nanomaterial component is used in the sensor. This review article apprises recent advances in the novel methodologies for fabrication of nanocomposites for voltammetric detection of water pollutants. The improved performance of the nanocomposite-based electrochemical sensors in detection of organic phenolic pollutants such as dihydroxybenzene isomers (DHB), bisphenol A (BPA) and 4-nitrophenol (4-NP) were highlighted. The future perspectives with challenges and strategic angles of development for the nanocomposite-based electrochemical sensors in environmental monitoring are also discussed.
Export citation and abstract BibTeX RIS

This is an open access article distributed under the terms of the Creative Commons Attribution 4.0 License (CC BY, http://creativecommons.org/licenses/by/4.0/), which permits unrestricted reuse of the work in any medium, provided the original work is properly cited.
Water as a universal solvent plays a vital role in the socio-economic world. It is an important medium for food, human development, energy production and several environmental and industrial processes. However, due to industrialisation, globalisation and population growth the number of waterborne contaminants has increased, which have had noxious effect on the water quality.1,2 Exposure to such toxic water pollutants also produces a deleterious effect on human health and aquatic biota. The imminent pollution of natural water resources due to the production and discharge of untreated wastewater effluents from industries such as textile dyeing, aquaculture, paper, pharmaceuticals, cosmetics, leather and printing is a major environmental pollution problem.3,4 The water quality is also reported to be declining because of the anthropogenic activities in different sectors and mismanagement of agricultural and livestock wastes. In addition, urbanization has also put tremendous pressure on the availability of the water resources, with water scarcity becoming a serious threat. According to the literature, safe drinking water is not accessible to about 1.2 billion people, while 2.6 billion people have accessibility to the drinking water with some or without any sanitation. The diseases communicated due to the polluted water claims millions of lives every year.1 Therefore, frequent and regular environmental monitoring and assessments of the water quality are of paramount significance to control water pollution and provide good-quality water supply. Conventional lab-based analytical methodologies such as inductively coupled plasma atomic emission spectroscopy,5 atomic absorption spectroscopy,6 extractive electrospray ionization mass spectrometry,7 liquid chromatography tandem mass spectrometry8 and atomic fluorescence spectroscopy9 provide gold analytical standards with high sensitivity, selectivity and accuracy for water analysis and therefore are being dominantly used for those purposes. However, these are available mostly in centralised laboratories, require skilled technicians and have expensive instrumentation and maintenance costs.10
In this review, a brief overview of recently reported nanocomposites is summarised for voltammetric detection of organic phenolic contaminants such as dihydroxybenzene (DHB) isomers; hydroquinone (HQ), catechol (CC), and resorcinol (RS), Bisphenol A (BPA) as well as para-nitrophenol or 4-nitrophenol (4-NP). The chemical structures of these compounds are shown in Scheme
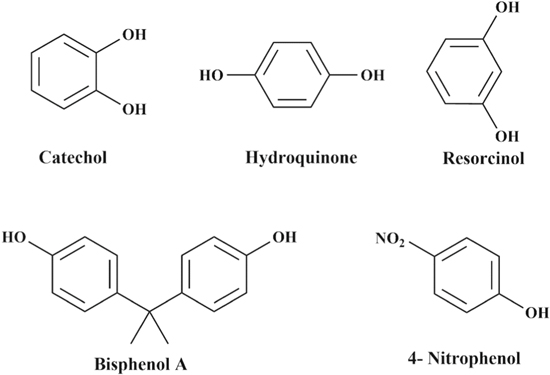
Scheme 1. Chemical structures of organic phenolic pollutants found in water and wastewater.
Download figure:
Standard image High-resolution imageThe sensitivity, stability, selectivity and the rapid analyses of the electrochemical sensors towards target contaminants are largely dependent on the small size, large surface area of the electrodes and the type of modifier materials.10,13,21 Recently, the progress of nanotechnology has resulted in the emergence of different nanomaterials. Owing to their unique properties, nanomaterials have been widely used in fabrication of optical, electronical and electrochemical sensors for detection of water pollutants.15,22,23 The nanomaterials are tunable, provide high surface area to volume ratio and can be customised to stimulate electrode kinetics, which leads to enhanced sensitivity.13,16 The nanomaterial-based electrochemical sensors have shown also great potential in detection of water pollutants and until now, several reviews have been reported where nanomaterials such as different metallic nanoparticles, carbon nanotubes, nanowires, quantum dots and graphene nanosheets have been utilised in the fabrication of the electrochemical sensors.13,16,24–31 Although these types of nanomaterials have greatly improved the electrochemical sensing and the evolution of the electrochemical sensors, single nanomaterial is not enough to fulfill requirements of electrochemical detection.32 Several complications such as facile reunification of colloidal metal nanoparticles, the bundling of carbon nanotubes, the aggregation of quantum dots, and the twisting of the graphene lamellae have been reported where single nanomaterials were used in sensor applications.32
Thus, the emerging trend is to combine or functionalise two or more organic or/and inorganic nanomaterials and developing a new material known as nanocomposite for sensor applications. The mixing of two or more nanomaterials with different physical and chemical properties produce a nanocomposite having cooperative effects with synergistic properties of the multi-nanomaterials utilised.32–34 Therefore, the nanocomposite is a novel, advanced and efficient material which exhibits better adsorption properties, good catalytic activity, high surface area to volume ratio and better thermal stability compared to individual nanomaterials.35,36 Due to their promising potential nanocomposites are widely utilised in sensors.32,34,37–44 Nanocomposite-based sensors have been successfully applied in the fields of engineering, medicine, hydrogels, drug delivery, food, environmental and corrosion science, agriculture, dyeing and so on.32 Past studies have routinely developed nanocomposite-based electrochemical sensors using nanomaterials such as metallic nanoparticles45,46 carbon nanotubes,47 graphene,48,49 quantum dots50,51 ordered mesoporous carbon,52 conducting nano-polymers37,42 and so forth. For example, Krishnan et al.41 reviewed the recent advances of two-dimensional (2D) and three-dimensional (3D) graphene-based nanocomposites as novel platforms for electrochemical and fluorescent detection of environmental and biological analytes. In addition, they have also discussed the novel fabrication and assembly strategies for graphene-based nanomaterials, while their unique properties outlined. In a tutorial review, Zhang et al.38 summarised the recent progress in the functionalization and fabrication of graphene-based artificial nacre nanocomposites with distinct interface strategies. The focus of the review was largely on the interface relationships and assembly techniques for developing efficient and productive nanocomposites similar to natural structural architecture. Sun and Li,53 critically reviewed, the latest graphene-oxide based macroscopic membrane composites. However, main focus was again on the fabrication techniques and to the resulting properties of membrane with discussions about the applicability of the composites for environmental analyses. El Rhazi et al.42 and Sen et al.54 have summarised about the synthesis and characterisation of novel nanocomposites produced from conducting polymers, carbon nanomaterials and metallic nanoparticles. The integration of polymer matrices with carbon nanomaterials can enhance the electro-mechanical properties of the nanocomposite,55 while the integration of metallic nanoparticles can improve and supplement the physical properties.56 Furthermore, the applicability of the nanocomposite-modified electrodes as novel electrochemical sensors for gas sensing and biosensing was also discussed. Abo-Hamad et al.57 and Jain et al.39 reviewed the nanocomposites produced using iconic liquids in conjunction with carbon nanomaterials. They provided an overview of various general fabrication methods for development of electrochemical sensors and the resulting sensor performances. The practicality of the ionic liquid-carbon nanomaterial nanocomposites for electrochemical detection of environmental pollutants and biomolecules was also discussed with several examples. Kaushik et al.58 overviewed environmental monitoring of hazardous and toxic gases using organic-inorganic hybrid nanocomposites. The fabrication processes, application, the gas sensing mechanism and figures of merit for different organic-inorganic hybrid nanocomposites-based gas sensors for environmental monitoring are highlighted. Although many reviews have been reported on the use of nanocomposites in different fields,18,26,33,58 the collaborative categorisation of nanocomposite-based voltammetric sensors of water pollutants is a minimally explored subject. The goal of the current review is to highlight the applications of the nanocomposite-based voltammetric sensors for individual and simultaneous detection of hazardous phenolic pollutants in water and wastewaters.
Common Electrochemical Surface Characterization Processes for Nanocomposite-Modified Electrodes
Calculation of active surface area
Usually experiments with cyclic voltammetry (CV) can be used to study the kinetics of the electrocatalytic reactions of the analytes on modified electrodes and also to determine the active surface area of the nanocomposite-modified electrodes. Generally, CV measurements are performed for the modified electrodes in the presence of a redox probe such as [Fe(CN)6]3−/4− at different scan rates (Fig. 1). Tohidinia et al.59 performed CV measurements of the GPE/PQ–BNWs, GPE/BNWs, GPE/PQ and GPE and analyzed the anodic peak current (Ipa) of the respective CVs attained in the presence of 1 mM [Fe(CN)6]3−/4− as shown in Figs. 1a–1d. The anodic and the cathodic peak currents can be plotted against either the scan rate or the square root of the scan rate. If the plot portrays a linear dependence of peak current with scan rate then it usually means it is a surface-controlled process, however, if the plot displays a linear dependence of the peak currents with the square root of the scan rate, as shown in Fig. 1e then it usually means a diffusion-controlled process.60,61

Figure 1. Cyclic voltammograms for GPE (a), GPE/PQ (b), GPE/BNWs (c) and GPE/PQ–BNWs (d) in the presence of 1 mM [Fe(CN)6]3−/4− prepared in 0.1 M KCl. (e) The graph of anodic and cathodic peak currents vs the square root of scan rate for GPE (a), GPE/PQ (b), GPE/BNWs (c) and GPE/PQ–BNWs (d).59 Licensed under Creative Commons Attribution 3.0 Unported Licence. Adapted from Ref. 59 with permission from the Royal Society of Chemistry.
Download figure:
Standard image High-resolution imageFurthermore, for an electrochemically reversible electron transfer process which follows a typical diffusion-controlled electrochemical behavior, the following Randles–Sevcik equation59,60,62 can be used to calculate the active surface area of the electrode:

where  refers to the anodic peak current, n is the electron transfer number, A is the surface area of the electrode, D is the diffusion coefficient of the redox species such as [Fe(CN)6]3−/4−, C is the concentration of freely diffusing redox species and v is the scan rate. Usually for 1 mM [Fe(CN)6]3−/4−, it is assumed that n = 1 and D = 7.6 × 10⁻⁶ cm s−1; the active surface areas of the nanocomposite-modified electrodes are obtained from the slope of the
  –
– relation. For example, Tohidinia et al.59 used the aforementioned equation and calculated the active surface area for unmodified GPE, GPE/PQ and GPE/PQ–BNWs (nanocomposite modified electrode), the active surface area for the electrodes was found to be 0.0233, 0.0226 and 0.0386 cm2, respectively. Therefore, the results emphasized that PQ-BNWs nanocomposite modified electrode, significantly enhanced the effective area of the working electrode and which resulted in improved conductivity of the sensor. Specifically, this indicated that the effective surface area of GPE/PQ–BNWs was about 66% and 71% more than GPE and GPE/PQ, respectively.59
Similarly, for a nanocomposite-modified electrode following a typical surface-controlled electrochemical behavior, the following equation can also be used to calculate the active surface area of the electrode60,61:

where  is the surface covered by the adsorbed species in mol cm−2, and the other symbols have their usual meanings.
Influence of pH on the electrooxidation of the phenolic pollutants and their possible electrooxidation mechanisms
Since the protons take part in the electrode reactions, the electrolyte acidity plays a vital role in the electrooxidation of the phenolic pollutants. Usually, an increase in the pH of the solution would result in shifting of the peak potential towards lower potential, which indicates the involvement of the protons during the electrode reactions. For example, Fig. 2a shows the effect of pH value on the electrochemical behavior of 4-NP at the surface of Cu−Zn/GO/GCE (nanocomposite modified electrode) investigated using CV in the pH range of 2.0 to 11.3 using Britton-Robinson (BR) buffer. In Fig. 2a, it is shown that in the selected pH range the oxidation peak potentials of BPA shifts negatively with increasing pH, suggesting that the protons are actively participating in the electrochemical redox process.63 Moreover, a plot of anodic peak potential vs the pH can also be constructed and the slope of the plot usually follows a linear regression, as shown in Fig. 2b. The obtained slope can be used for the estimation of the ratio of number of protons and electrons. Generally, the anodic peak potentials for the analytes at a specific pH can then be calculated using the following relationship59,64:
where, m and n are the number of protons and electrons involved in the reaction, respectively, and the corresponding Nernstian slope  value is known to be 0.059
  V/pH.
V/pH.
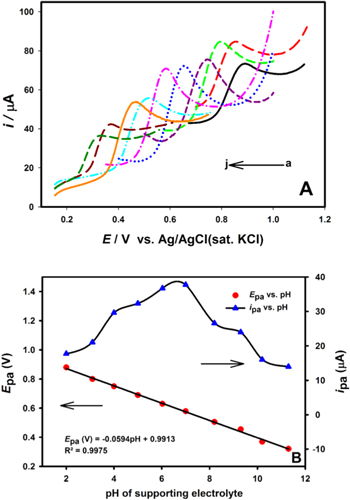
Figure 2. (a) Cyclic voltammograms at Cu−Zn/GO/GCE in the presence of 1 mM BPA in BR buffer solution within a range of pH from 2.0 to 11.3 (a to j) where, (a) 2.0, (b) 3.1, (c) 4.0, (d) 5.0, (e) 6.03, (f) 7.0, (g) 8.2, (h) 9.3, (i) 10.2 and (j) 11.3. (b) The effect of pH value on the anodic peak current (blue triangles) and anodic peak potential (red dots) of 0.1 mM BPA.63 Reprinted with permission from Ref. 63 by Ş. Ulubay Karabiberoğlu, Sensitive Voltammetric Determination of Bisphenol A Based on a Glassy Carbon Electrode Modified with Copper Oxide-Zinc Oxide Decorated on Graphene Oxide, Electroanalysis, WILEY-VCH Verlag GmbH & Co. KGaA, Weinheim.
Download figure:
Standard image High-resolution imageIf the experimental slopes obtained from the plots of anodic peak potentials values vs the pH for are close to the theoretical Nernstian slope value then the probable electrochemical reaction for the phenolic analyte should involve equal number of protons and electrons at the nanocomposite-modified electrode reactions. Moreover, an optimum pH for the study can be chosen based on the plot of anodic peak vs the pH values. For example, in Fig. 2b it was shown that while using Cu−Zn/GO/GCE the oxidation peak current BPA increases with increasing pH value until it reaches to its maxima at pH 7.1 (the optimum pH), and then the oxidation peak currents decrease when the pH increases further. This phenomenon of increase and decrease in peak currents at different pH values can be attributed to the fact that protons are involved in the electrochemical reaction. A shortage of protons at high pH values prevents the oxidation of BPA which leads to a decreased current peak intensity, moreover diphenols such as BPA can form anions which can contribute to the decreased current peak intensity observed in Fig. 2b.65 Therefore, pH effect study can be helpful in providing important information about the electrooxidation mechanisms of the redox reactions occurring on the surface of nanocomposite-modified electrodes. Several studies in literature have illustrated different electrooxidation mechanisms for each of the phenolic pollutants discussed in this review, which are shown in Schemes

Scheme 2. Proposed electrooxidation of HQ, CC and RS as reported by Meng et al.66 at ZnO/carbon cloth electrode. Reprinted with permission from Ref. 66 by S. Meng, Y. Hong, Z. Dai, W. Huang, and X. Dong, ACS Appl. Mater. Interfaces, 9, 12453–12460 (2017). Copyright (2017) American Chemical Society.
Download figure:
Standard image High-resolution image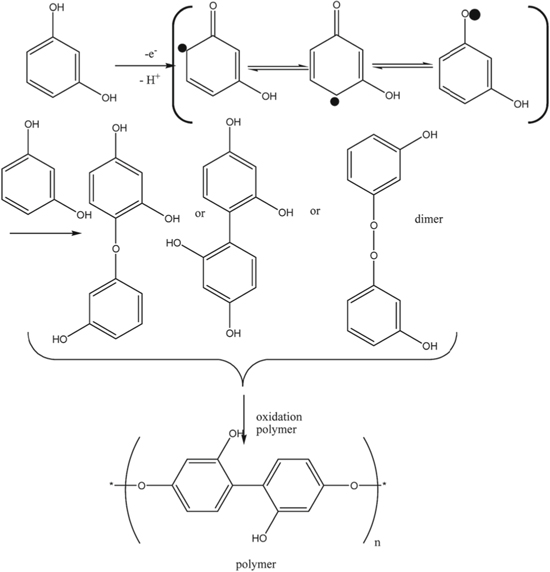
Scheme 3. Proposed keto-enol tautomerism redox mechanism for electrooxidation of RS as reported by Tohidinia et al.59 at GPE/PQ–BNWs. Adapted from Ref. 59 with permission from the Royal Society of Chemistry.
Download figure:
Standard image High-resolution image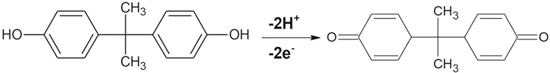
Scheme 4. The possible electrooxidation mechanism of BPA at Cu−Zn/GO/GC nanocomposite-modified electrode.63 Reprinted with permission from Ref. 63 by Ş. Ulubay Karabiberoğlu, Sensitive Voltammetric Determination of Bisphenol A Based on a Glassy Carbon Electrode Modified with Copper Oxide-Zinc Oxide Decorated on Graphene Oxide, Electroanalysis, WILEY-VCH Verlag GmbH & Co. KGaA, Weinheim.
Download figure:
Standard image High-resolution image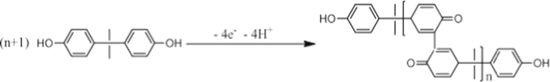
Scheme 5. The possible electrooxidation mechanism of BPA at NPG/GCE.67 Reprinted with permission from Ref. 67 by X. Yan, C. Zhou, Y. Yan, and Y. Zhu. A Simple and Renewable Nanoporous Gold-based Electrochemical Sensor for Bisphenol A Detection, Electroanalysis, WILEY-VCH Verlag GmbH & Co. KGaA, Weinheim.
Download figure:
Standard image High-resolution image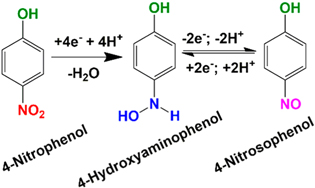
Scheme 6. The possible electrooxidation mechanism of 4-NP in the presence of S-GCN nanosheets.68 Reprinted with permission from Ref. 68 by C. Rajkumar, P. Veerakumar, S. M. Chen, B. Thirumalraj, and K. C. Lin, ACS Sustain. Chem. Eng., 6, 16021–16031 (2018). Copyright (2018) American Chemical Society.
Download figure:
Standard image High-resolution imageCalculation of the standard heterogeneous electron transfer rate constant
In electrochemical studies usually when the performance of the nanocomposite-modified electrodes is investigated, the calculation of the standard heterogeneous electron transfer rate constant, denoted by k° or ks, becomes very significant.69 These values provides the information about the speed of the electron transfer between the nanocomposite-modified electrode surface and the electroactive species. Researchers have used voltammetric techniques since 1956–57 to report the rate constant values. Since the Marcus theory was reported CV has been a popular choice in determining the k° or ksvalues. Models developed by Nicholson70,71 or Laviron72,73 are the most commonly used theories to estimate the rate constants for the electrode materials.
Several studies in literature have determined the k° or ks values for phenolic pollutants using the Laviron's theory.63,74–78 Briefly, using CV the modified electrode is utilized in investigating the effect of the scan rate on the anodic and cathodic peak potential for the phenolic pollutants. For reversible electrode processes, the oxidation peak potential will shift positively and the reduction peak potential will shift negatively with increasing scan rate. For example, Fig. 3a shows the effect of scan rate to the CV response of CC at modified carbon paste electrode (CPE) with CePO4 that is reported by Dang et al.79 It is shown in Fig. 3a that the oxidation peak potential shifted positively and the reduction peak potential shifted negatively as the scan rate increases. But for irreversible electrode processes only one of the reduction or oxidation peak is observed, which also shifts negatively or positively with increasing scan rate. According to the Laviron's theory,72 for a reversible electrochemical process when the  is greater than
  the graph of
  will give two straight lines where the slope will be equal to
  for the cathodic peak (
 ) and
) and  for the anodic peak (
 ). The charge transfer coefficient, α, can then be determined from the slopes of the two straight lines of
  vs
vs  based on the Eq. 477:
where the  and
and  are the slopes of linear regression obtained from the plot of anodic and cathodic peak potential vs
  respectively. For example, Fig. 3b shows the linear relationship of Epa and Epc of CC with logν, which are used to derive the values of
  and
and  Therefore, after solving for α using Eq. 4, the standard heterogeneous electron transfer rate constant, k° or ks, can be calculated using Eq. 5 as follows:
where n is the number of electrons participating in the electrode reaction,  is the peak-to-peak potential separation and rest of the symbols have their usual meanings. The number electrons taking part in the reaction are usually estimated based on the results of the pH effect studies and past research. For totally irreversible electrode processes, the dependence of the anodic peak potential
  vs the
  is represented by the following Laviron's equation73:
where  is the formal redox potential,
  is the standard heterogeneous rate constant, n is the number of electrons transferred, and rest of the symbols have their usual meanings. For example, as shown in Fig. 4a shows that an increase in the scan rates caused the Epa of BPA on Cu−Zn/GO/GCE to shift towards a more positive potential.63 Moreover, as shown in Fig. 4b the slope from the linear plot of
  vs
vs  can be used to determine the value of
  Moreover, once the number of electrons involved in the oxidation process is available from pH effect studies and past research, the value of α can be calculated by equating the slope to the value of
  According to Bard and Faulkner,61
  can also be assumed to be 0.5 for a totally irreversible process, therefore, the number of transferred electrons (n) that are taking part in the electrochemical oxidation of the analyte can be calculated.

Figure 3. (a) Cyclic voltammograms depicting the effect of varying scan rates on CePO4/CPE in the presence of 10 μm CC in 0.1 M PBS (pH 7.0). The scan rates are ranged: from 60 to 1800 mV s−1; (b) The dependence of anodic (Epa) and cathodic peak potential (Epc) on the logarithm of scan rate (logν).79 Adapted from Ref. 79 with permission from the Royal Society of Chemistry.
Download figure:
Standard image High-resolution image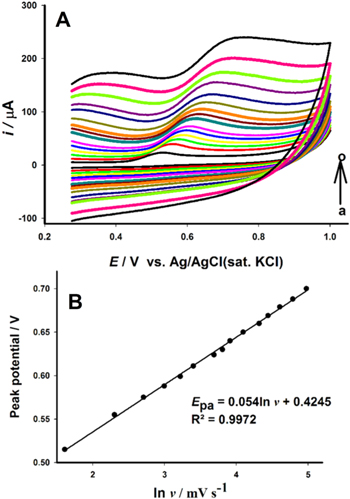
Figure 4. (a) Cyclic voltammograms depicting the effect of varying scan rates (a–o: 5.0–145.0 mV s−1) in the presence of 0.1 mM BPA at Cu−Zn/GO/GCE. (b) The relationship between anodic peak potential and ln v.63 Adapted with permission from Ref. 63 by Ş. Ulubay Karabiberoğlu, Sensitive Voltammetric Determination of Bisphenol A Based on a Glassy Carbon Electrode Modified with Copper Oxide-Zinc Oxide Decorated on Graphene Oxide, Electroanalysis, WILEY-VCH Verlag GmbH & Co. KGaA, Weinheim.
Download figure:
Standard image High-resolution imageAnother equation which is also used for calculating the standard heterogenous rate constants (ks) for totally irreversible electrode processes at the surface of modified electrodes is Velasco equation, as shown below80,68:
where, D is the apparent diffusion coefficient, Ep and Ep/2 are the oxidation peak potential and half-wave oxidation peak potential, respectively, and v is the scan rate. Here again CV is performed in the presence of the analytes at a low scan rate (between 25 to 50 mV) and the oxidation peak potential and half wave oxidation peak potential are used to determine the  However, this equation requires the apparent diffusion coefficient for each of the analyte, and this is obtained from the chronoamperometric studies discussed in the following section. But,it should be noted that the diffusion coefficients determination by electrochemical means have some problems in precision.81
Chronoamperometric studies and the calculation of the diffusion coefficient
Diffusion coefficients for the electroactive analytes can be determined using chronoamperometry. For chronoamperometry the potentials of the working electrode potentials are usually set at a constant potential close to the anodic peak potential and the current responses from different concentrations of the analytes are recorded. From the study of electrochemical detection of 4-NP by Rajkumar et al.68 typical chronoamperograms and the Cottrell plots for 4-NP are shown in Fig. 5. Figure 5a shows the chronoamperometric response for S-GCN/SPCE in N2-saturated 0.1 M ABS (pH 5.5) in the presence and absence of 4-NP. While Fig. 5b displays a significant increase in the current responses with increasing 4-NP concentrations, which emphasizes the occurrence of the facial electron transfer during the electrocatalytic reduction of 4-NP over S-GCN/SPCE. The diffusion coefficients for the electroactive analytes can be calculated using the Cottrell equation as follows82:
where n is the number of electrons transferred, F is Faraday's constant (96485 C mol−1), A is the effective surface area of the electrode, D is the diffusion coefficient, Cb is the bulk concentration (mol cm−3), t is time. The Cottrell plot displayed as the graph of I vs t−1/2 shows that the relationship of current with time is linear (Fig. 5c). This linearity is resulted due to the diffusion control mechanism followed by the electrochemical reaction under mass transport limited conditions. Furthermore, the slope of the linear region which equals to nFAD1/2Cbπ−1/2 can be used to calculate the value of D for the analytes by plotting them against the different concentrations that have been tested as shown in Fig. 5d.
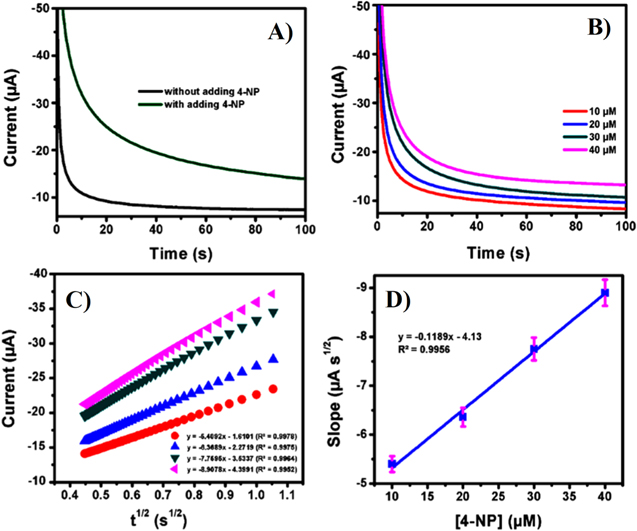
Figure 5. (a) Chronoamperometric responses of the S-GCN/SPCE in N2-saturated 0.1 M (ABS, pH 5.5) in the presence and absence of 4-NP. (b) Chronoamperogram showing the relationship of time and current for different concentrations of 4-NP: 10, 20, 30, and 40 μm. (c) Plots of current vs time–1/2. (d) Calibration plot of slopes obtained from graph (c) vs 4-NP concentration.68 Reprinted with permission from Ref. 68 by C. Rajkumar, P. Veerakumar, S. M. Chen, B. Thirumalraj, and K. C. Lin, ACS Sustain. Chem. Eng., 6, 16021–16031 (2018). Copyright (2018) American Chemical Society.
Download figure:
Standard image High-resolution imageOverall, this section provides a brief overview of the electrochemical surface characterization for different nanocomposite-modified electrodes that can be performed by determining the effective surface area, diffusion coefficients, heterogeneous rate constants and many other aspects of the electrode reactions and electron transfer that are critical to the sensor's performance. The following sections will discuss and provide a brief overview of the novel modifiers and comparison studies on the analytical performance of the recently reported voltammetric sensors. Moreover, since the environmental/sample matrix utilized in detection of the phenolic pollutants can affect the analytical scope of the sensor, the type of environmental/sample matrix used for recovery experiments in detection of various phenolic pollutants will also be highlighted.
Organic Phenolic Pollutants
Dihydroxybenzene isomers—hydroquinone, catechol, and resorcinol
Structural isomers of hazardous organic pollutants pose a significant risk to the environment, therefore, quick and sensitive determination of the pollutants is required during the monitoring.83–85 Due to their low cost, widespread applications and large-scale production, the DHB isomers are extensively found in the environment. They are utilized as engineering solvents or as raw ingredients in different industries85,86 and are also used in manufacturing of synthetic fibers, hair dyes, rubber, cosmetics and pharmaceuticals.86–90 The remediation of DHB isomers is of significance due to their low degradability, high toxicity and high oxygen demand in the aquatic environment. In addition, the national environmental agencies from United States, European Union and Canada have categorized them as primary wastewater contaminants due to the aforementioned reasons.91 Wastewater effluents containing these isomers with concentrations ranging from 1 to 1000 mg l−1 from different industrial processes have been reported.86 Several conventional analytical methods have been reported for determination of DHB isomers such as phosphorescence,83 spectrophotometry,85 colorimetric,87 chromatography,92 electrochemistry,59,62 chemiluminescence,93 fluorescence,94 capillary electrophoresis.95 However, the electrochemical methods are most preferred choice due to its sensitivity, selectivity, low cost, potential for miniaturization and rapid detection.62 Recently, various nanocomposites have been used as modifiers on different kinds of electrode materials for electrochemical detection of one, two or all three DHB isomers.
Li et al.,96 developed copper-based metal-organic frameworks-graphene nanocomposites having good electronic conductivity and stability for electrochemical detection of CC and HQ, however, resorcinol was not detected and interference studies with other compounds have not been reported. Balram et al.,97 prepared an ecofriendly reduced graphene oxide (rGO) and synthesized Marsh marigold-like zinc oxide (ZnO) nanoaggregates. Then, they used both of those materials to sonochemically prepare novel nanocomposites using ultrasonication and utilized them to modify the glassy carbon electrode (GCE). Although the other two isomers, CC and RS, were used during the interference studies, the simultaneous detection of all the isomers was not performed. Zhou et al.98 developed a cost-effective non-enzymatic cobalt oxide (Co3O4) carbon core–shell nanocomposite by exploiting glucose as the carbon source using a hydrothermal method. This kind of nanocomposite can greatly reduce the fabrication cost for potential commercialization, however, the researchers did not perform any interference studies with resorcinol or other phenolic compounds generally found in polluted aquifers. Therefore, the analytical applications of these sensors had a limited scope.
In environmental water samples the three DBH isomers usually co-exist as pollutants.87,99,100 This could impact the sensitivity and the selectivity of the sensor as some electrode modifiers respond with broad overlapping redox potentials of CC and HQ at conventional electrodes and they cannot overcome the electrochemical inactivity of resorcinol.101,102 Therefore, the need for novel nanocomposites which can assist in simultaneous determination of these isomers becomes necessary.62,99 Recently, Yang et al.,103 fabricated a new nanocomposite by first developing a nanoribbon from multi-walled carbon nanotube (MWCNT) and graphene oxide and then hydrothermally reducing the nanocomposite to form MWCNTs incorporated with rGO nanoribbons. The resulting nanocomposite had a very wide linear range compared to some other recently reported nanocomposites such as hollow nitrogen-doped mesoporous carbon spheres decorated graphene,99 poly(quercetin)-bismuth nanowires,59 chitosan supported functionalized-MWCNT,104 MWCNT-titanium dioxide (TiO2) in chitosan matrix,100 and nanoraspberry-like copper-reduced graphene oxide.62 Meng et al.,66 had developed a carbon cloth-zinc oxide nanorod nanocomposite (Fig. 6) for simultaneous detection of DHB isomers, however the detection limit is too high and the linear range is too narrow compared to the other recently developed nanocomposites (Table I). The selection of cyclic voltammetry (CV) as the quantification method compared to more sensitive differential pulse (DPV) or square-wave voltammetric (SWV) techniques might have been a limiting factor for such results.
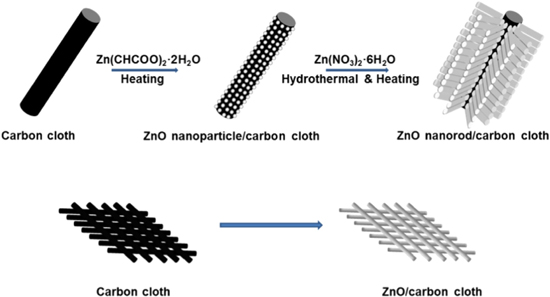
Figure 6. Schematic showing the fabrication procedures of ZnO/carbon cloth composite and its potential use in determination of DHB isomers using cyclic voltammetry.66 Reprinted with permission from Ref. 66 by S. Meng, Y. Hong, Z. Dai, W. Huang, and X. Dong, ACS Appl. Mater. Interfaces, 9, 12453–12460 (2017). Copyright (2017) American Chemical Society.
Download figure:
Standard image High-resolution imageTable I. Performance of the recently developed nanocomposite-based voltammetric sensors for simultaneous detection of dihydroxybenzene isomers.
| Nanocomposite | Analyte Detected | pH | Linear Range (μM) | Detection Limit (μM) | Matrices Tested | References |
|---|---|---|---|---|---|---|
| PQ–BNWs | HQ, CC and RS | 8.0 | HQ = 0.76–362.7 | HQ = 0.12 | Tap water, Sea water, Well water | 59 |
| CC = 0.74–321.9 | CC = 0.20 | |||||
| RS = 4.99–970.6 | RS = 0.82 | |||||
| NRCu-rGO | HQ, CC and RS | 3.0 | HQ = 0.13–131.5 | HQ = 0.049 | City water, Mineral water, River water | 62 |
| CC = 0.13–131.5 | CC = 0.052 | |||||
| RS = 0.13–131.5 | RS = 0.060 | |||||
| Cu-MOF-GN | HQ and CC | 7.0 | HQ = 1.0–100.0 | HQ = 0.59 | Local tap water | 96 |
| CC = 1.0–100.0 | CC = 0.33 | |||||
| Co3O4@carbon | HQ and CC | 7.0 | HQ = 0.8–127.1 | HQ = 0.03 | River water | 98 |
| CC = 0.6–116.4 | CC = 0.03 | |||||
| NMC-G | HQ, CC and RS | 6.0 | HQ = 0.5–400.0 | HQ = 0.15 | Tap water | 99 |
| CC = 1.0–300.0 | CC = 0.30 | |||||
| RS = 3.0–200.0 | RS = 1.00 | |||||
| CS-MWCNTs+TiO2NPs | HQ, CC and RS | 7.0 | HQ = 0.4–39.9, 39.9–276.0 | HQ = 0.06 | River water, Tap water | 100 |
| CC = 0.4–8.0, 8.0–47.8, 47.8–159.0 | CC = 0.07 | |||||
| RS = 3.0–16.7, 16.7–172.0, 172.0–657.0 | RS = 0.52 | |||||
| MWCNT@rGONR | HQ, CC and RS | 7.0 | HQ = 15.0–921.0 | HQ = 3.89 | River water, Tap water | 103 |
| CC = 15.0–1101.0 | CC = 1.73 | |||||
| RS = 15.0–1301.0 | RS = 5.77 | |||||
| CS/f-MWCNT | HQ, CC and RS | 7.0 | HQ = 0.09–171.4 | HQ = 0.027 | Pond water, Tap water, Drinking water | 104 |
| CC = 0.09–155.4 | CC = 0.029 | |||||
| RS = 0.30–174.8 | RS = 0.11 | |||||
| ZnO-carbon cloth | HQ, CC and RS | 7.0 | HQ = 2.0–30.0 | HQ = 0.57 | — | 66 |
| CC = 2.0–45.0 | CC = 0.81 | |||||
| RS = 2.0–385.0 | RS = 7.20 | |||||
| ERGO-pEBT/AuNP film | HQ, CC and RS | 6.0 | HQ = 0.52–31.7 | HQ = 0.015 | Tap water | 105 |
| CC = 0.44–31.2 | CC = 0.008 | |||||
| RS = 3.80–72.7 | RS = 0.039 | |||||
| Pd/CuNWs-CNTs | HQ, CC and RS | 7.0 | HQ = 1.0–99.0, 99.0–228.0 | HQ = 0.40 | City water, Mineral water, River water | 106 |
| CC = 1.0–280.0 | CC = 0.60 | |||||
| RS = 1.0–33.0, 33.0–228.0 | RS = 0.80 | |||||
| M@Pt@M-rGO | HQ, CC and RS | 7.0 | HQ = 0.05–20.0, 20.0–200.0 | HQ = 0.015 | Lake water, Contaminated water | 107 |
| CC = 0.1–160.0 | CC = 0.032 | |||||
| RS = 0.4–30.0, 30.0–300.0 | RS = 0.133 | |||||
| Au-Pd NF/rGO | HQ, CC and RS | 7.0 | HQ = 1.6–100.0 | HQ = 0.50 | Tap water, Lake water | 108 |
| CC = 2.5–100.0 | CC = 0.80 | |||||
| RS = 2.0–100.0 | RS = 0.70 | |||||
| ERNGO | HQ, CC and RS | 6.0 | HQ = 0.05–1.0 | HQ = 0.015 | River water, Wastewater, Human urine | 109 |
| CC = 0.05–1.0 | CC = 0.013 | |||||
| RS = 0.05–1.0 | RS = 0.013 | |||||
| Au NPs/CNTs/graphene hybrids | HQ, CC and RS | 5.7 | HQ = 0.0–80.0 | HQ = 0.80 | Tap water, River water | 110 |
| CC = 0.0–80.0 | CC = 0.95 | |||||
| RS = 0.0–80.0 | RS = 0.10 | |||||
| CDRGO | HQ, CC and RS | 7.0 | HQ = 0.50–1000.0 | HQ = 0.17 | Tap water | 111 |
| CC = 1.00–950.0 | CC = 0.28 | |||||
| RS = 5.00–600.0 | RS = 1.00 | |||||
| 1D PEDOT-Gr | HQ, CC and RS | 7.0 | HQ = 5.00–250.0 | HQ = 0.06 | — | 112 |
| CC = 2.00–400.0 | CC = 0.08 | |||||
| RS = 1.00–250.0 | RS = 0.16 | |||||
| HMCCS | HQ, CC and RS | 7.0 | HQ = 0.30–1000.0 | HQ = 0.12 | River water, Tap water, Vegetable juice | 113 |
| CC = 2.00–2000.0 | CC = 0.19 | |||||
| RS = 3.00–600.0 | RS = 1.10 | |||||
| MWCNT-IL | HQ, CC and RS | 6.0 | HQ = 0.005–0.240 | HQ =0.0020 | River water, Wastewater | 114 |
| CC = 0.005–0.240 | CC =0.0025 | |||||
| RS = 0.005–0.240 | RS =0.0011 | |||||
| PE-CNT | HQ, CC | 7.0 | HQ = 5–300 | HQ = 1.5 | Local Tap water | 115 |
| CC = 5–300 | CC = 0.7 | |||||
| Cu-PPy | CC | 7.0 | CC = 0.05–1000 | CC = 0.010 | Tap water | 116 |
| MWCNTs/p-DAN | CC | 7.0 | CC = 0.02–128 | CC = 0.010 | Tap water, Wastewater | 117 |
| GR-Cyst-Au | RS | 7.0 | RS = 0.3–40 | RS = 0.02 | Garnier color naturals cream | 118 |
| CoPcNRs/FA-rGO | HQ and CC | 4.5 | HQ = 1.00–650 | HQ = 0.30 | River water | 119 |
| CC = 2.00–450 | CC = 0.65 | |||||
| aSPCE | HQ and CC | 7.0 | HQ = 0.3–930 | HQ = 0.103 | — | 120 |
| CC = 0.05–880 | CC = 0.031 | |||||
| AuNPs/Cysteic acid | HQ and CC | 7.0 | HQ = 0.09–2.99, 2.99–39.2 | HQ = 0.02 | Tap water | 121 |
| CC = 0.09–2.99, 2.99–39.2 | CC = 0.06 | Rain water | ||||
| SnO2 flowers | HQ and CC | 7.0 | HQ = 30–1100 | HQ = 1.12 | — | 122 |
| CC = 30–1100 | CC = 3.74 | |||||
| ox-GNPs | HQ and CC | 4.5 | HQ = 2.00–150 | HQ = 0.4 | River water | 123 |
| CC = 2.00–150 | CC = 0.6 |
Conflicting reports have also reported that unlike CC and HQ, the two-electron and two-proton oxidation mechanism does not help in generating a stable quinone with RS due to its meta structure.124,125 Recent studies by Meng et al.,66 Yang et al.,103 Kokulnathan et al.,104 and Fotouhi et al.,100 reported that all three DHB isomers underwent two-electron and two-proton processes as their electrooxidation mechanisms (Scheme
Overall, it is also significant to develop new nanocomposites as modifiers for the detection of the DHB isomers due to the issues pertaining with the facile synthesis, eco-friendliness of the constituent materials, detection limits and the linear range of the existing modifiers. A summary of recent nanocomposite-based simultaneous or individual voltammetric detection of DHB isomers have been compiled in Table I.
Bisphenol A
Bisphenol A (2,2-bis(4-hydroxyphenyl)propane) (BPA) is a major phenolic monomer compound with a widespread use in industrial manufacturing of polycarbonate plastics, epoxy resins and in the plastic industry for production of various other household materials.129 BPA is reported to be a xenoestrogen, an endocrine disrupting compound.130 Even at low concentrations, exposure to BPA is carcinogenic and can cause abnormal hormone responses resulting in endocrine disorders.131–133 Owing to its negative implications on humans, aquatic biota and wildlife, this compound was banned in Canada in 2010.131 Due to its extensive usage in industrial and domestic settings, it is approximated that roughly 2000 ton of BPA is released annually into the environment.134 Moreover, it is vital to highlight that the BPA is not degraded and treated by the wastewater treatment plants, therefore, it is found in natural waters, drinking freshwater sources, seawater, riverbeds, air, landfills, and different food matrices.129,133 The use of BPA in baby teethers and plastic bottles is strictly prohibited as infants and children are the most vulnerable to BPA. According to United States Food and Drug Administration, 50 μg/kg/day is apparently a safe and tolerable dose,130 while European Food Safety Authority has set the tolerable and safe dose limit at 4 μg·kg−1 body weight per day.135 Therefore, it is essential to develop sensing techniques that are rapid, affordable, sensitive, selective and have convenient sample preparation and facile surface renewal, which allows real-time on-field detection of BPA. Usually a bare electrode would have limitations in terms of sensitivity and selectivity, and it would also be prone to surface fouling. Therefore, electrode modifications with nanocomposites can solve the problem of overvoltage and slow electrode kinetic processes.133,136
Among various advanced detection techniques enzymatic electrochemical sensors incorporating nanocomposites are emerging as a sensitive, selective and simple biosensing devices.129,137 Recently, Wu et al.137 used SiO2 nanospheres and modified their surface with gold-platinum (Au-Pt) nanoparticles (APS) to form Au-Pt@SiO2 nanocomposites. These nanocomposites were then incorporated with tyrosinase (Tyr) and then along with gold nanoparticles modified graphene nanosheet (Au-GN) as electrode substrate were drop casted on GCE to fabricate a tyrosinase modified Au-Pt@SiO2/Au-graphene electrode (Tyr/APS/Au-GN) (Fig. 7). An excellent detection limit of 7.88 nM was achieved with a wide linear range from 0.04–43.8 μM. Although this electrode was used in detection of BPA in food matrices using DPV and SWV, the applicability can be expanded to water samples as other researchers have used nanocomposite-modified Tyr-based enzymatic electrochemical sensors for BPA detection in water samples. For example, Liu et al.,129 developed tyrosinase enzymatic electrochemical sensor by incorporating biochar nanoparticle (BCNPs)-tyrosine nanocomposite and mixing it with Nafion before drop-casting it on GCE. The highly conductive BCNPs were the transducer and signal enhancer in this study, and a tyrosinase enzyme was used as signaling component due to its catalytic bioactivity towards BPA. The Nafion helped in achieving a smooth and homogenous surface on the electrode surface. The ortho-hydroxylation oxidase properties of Tyr oxidized the BPA to polyhydric phenol and o-quinone, which is electroactive (Fig. 8).129 The amperometric detection of BPA was then performed by reducing the o-quinone at the electrode surface and measuring the reducing current signal directly related to concentrations of BPA.129 However, some drawbacks of such enzymatic electrochemical sensors relate to its high cost, complexity and multi-step immobilization and variability of samples.130 Enzymatic electrochemical sensors also suffer from the burial of the redox active sites in the enzyme and also from the orientation of the enzymes on the electrode surfaces which would hinder the electron transfer processes.138 Therefore, novel nanocomposite-based electrochemical aptasensors have been emerging as an excellent alternative that is highly sensitive, selective, stable, biocompatible with potential for miniaturization. Aptamers are single-stranded DNA or RNA oligonucleotides that have high specificity and sensitivity towards the target analyte. They are advantageous over other immunosensors or antibodies because they are developed with an in vitro technique called systematic evolution of ligands by exponential enrichment (SELEX).103,139 Moreover, they can be modified as per the needs of the research, are repeatable and comparatively cost-effective.140 It has been reported elsewhere that small molecules like BPA are easily captured by the aptamers, as their shorter oligonucleotide length assists in capturing by accurately differentiating the functional groups of analogous structures.141 Several recent studies have used aptasensors for electrochemical sensing of BPA. For example, Abnous et al.,139 developed an aptasensor based on nontarget-induced aptamer length extension activated by terminal deoxynucleotidyl transferase and the establishment of a physical barrier on the electrode surface. The sensor is capable of excellent sub-nanomolar detection limit of 15 pM and wide linear range from 0.08 to 15.0 nM. Yao et al.,142 first developed water-soluble nitrogen, sulfur, phosphorus co-doped carbon dots (N,S,P-CDs) using hydrothermal method from cucumber juice. The N,S,P-CDs were then drop coated on the GCE to increase the active surface area and increase the sensitivity of the sensor. The gold nanoparticles (AuNPs) were then dropped on the GCE modified with N,S,P-CDs to form nanocomposites. In the last step the thiolated anti-BPA aptamers were attached onto the gold nanoparticle surface. The long-chain extension of the anti-BPA aptamers allowed for sensitive and selective detection of BPA by allowing or disallowing the electrochemical redox probe to reach the electrode surface (Fig. 9). With regards to the BPA detection, the linear range was from 0.01 μM to 120 μM and the detection limit was as low as 0.53 nM. However, there are still some limitations for electrochemical aptasensors, one of them is the degradation of the aptamers with nucleases. Another challenge pertains to the limited knowledge of the aptamer immobilization approaches that can significantly affect the detection capabilities of the sensor.143

Figure 7. (a) Schematic representation for the fabrication of Try/APS/Au-GN nanocomposite-based enzymatic electrochemical sensor. (b) Mechanistic insights on the potential oxidation steps of BPA on the fabricated enzymatic electrochemical sensor.137 Reprinted with permission from Ref. 137 in J. Electrochem. Soc., 166, B562 (2019). Copyright 2019, The Electrochemical Society.
Download figure:
Standard image High-resolution image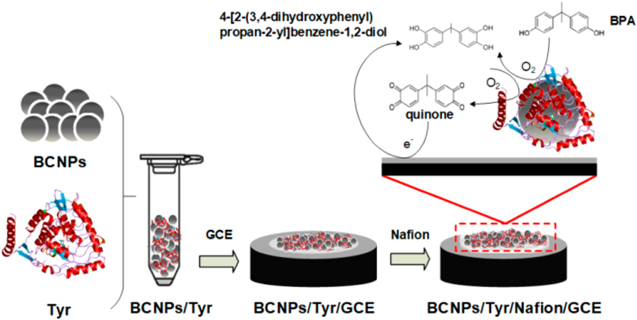
Figure 8. Illustration of the fabrication steps for the development of BCNPs/Tyr/Nafion/GCE nanocomposite-based biosensor and redox mechanism during the electrochemical detection of BPA.129 Licensed under Creative Commons Attribution License, CC BY 4.0. Reproduced with permission from Ref. 129 by Liu et al., Sensors (Basel); published by MDPI, 2019.
Download figure:
Standard image High-resolution image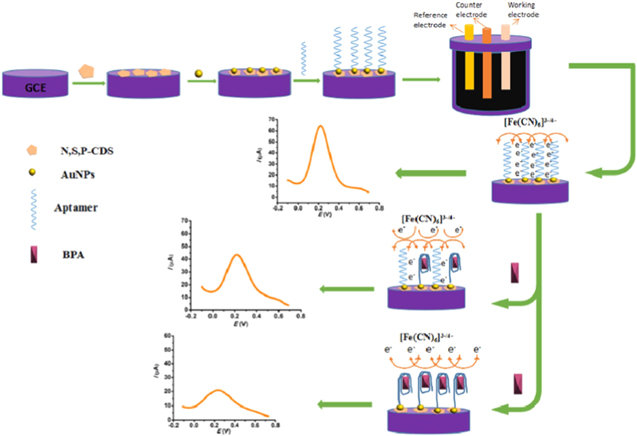
Figure 9. Illustration of the fabrication steps for modifying the glassy carbon electrode with anti-BPA/AuNPs/N,S,P-CDs and electrochemical detection of Bisphenol A.142 Reprinted with permission from Ref. 142 in J. Electrochem. Soc., 166, B1162 (2019). Copyright 2019, The Electrochemical Society.
Download figure:
Standard image High-resolution imageIn the recent years, molecular imprinting approach has received great attention for detection of chemical contaminants, where the molecular identification in a composite is achieved through the target analyte supported assembly.144–147 In this technique, the target analyte is used as a template by the polymeric network for fabricating the recognition imprints of the analyte during the course of the composite formation. Therefore, Ali et al.,147 coupled the molecular imprinting method with electrochemical analyses for developing a molecularly imprinted polymer nanocomposite for rapid, selective and sensitive detection of BPA. The nanocomposite is constituted of polyacrylate, RGO and β-cyclodextrin that are covalently linked while forming a 3D network (Fig. 10). This 3D network of the nanocomposite assists in selective capture of BPA as it has molecular imprints of the BPA resulting via the host-guest complexation amongst BPA and β-cyclodextrin. The linear concentration range for detection of BPA in water samples was 20 nM—1.0 μM, while the detection limit was 8 nM. Pei et al.,146 developed a molecularly imprinted TiO2 single crystal having selective inorganic-framework molecular detection capability, with a linear range of 10.0 nM—20.0 μM. Although these molecularly imprinted polymer nanocomposite sensors are highly selective and help in attaining low detection limit, compared to the other recently reported nanocomposite-based electrochemical, especially voltammetric, sensors in literature, they work usually within a very narrow linear concentration range (Table II). Finally, a recent study by Ulubay Karabiberoğlu63 proposed that the BPA undergoes two-electron and two-proton processes as their primary electrooxidation mechanism at Cu−Zn/GO/GC nanocomposite-modified electrode (Scheme

Figure 10. Schematic illustration for preparation method of molecularly imprinted nanocomposite (MIPN) for bisphenol A and a non-imprinted nanocomposite (NIPN) and the electrochemical analysis using the modified glassy carbon electrodes.112 Reproduced from Ref. 112 with permission from the Centre National de la Recherche Scientifique (CNRS) and the Royal Society of Chemistry.
Download figure:
Standard image High-resolution imageTable II. Analytical performance of the recently developed nanocomposite-based electrochemical sensors for the detection of Bisphenol A.
| Nanocomposite | pH | Linear Range (μM) | Detection Limit (μM) | Matrices Tested | References |
|---|---|---|---|---|---|
| BCNPs/Tyr/Nafion | 7.0 | 0.02–10.0 | 0.00318 | Groundwater | 129 |
| Cu/Cu2O/CuO@MoS4 | 7.4 | 0.0001–17.0 | 0.0001 | Healthy human serum, Cancer patient's human serum | 130 |
| MWCNT-PDDA-AuPd | 7.0 | 0.18−18.0 | 0.06 | Tap water, Milk | 132 |
| rGO-CNPs | 7.0 | 0.0075–0.26 | 0.001 | Plastic-bottled drinking water | 133 |
| MWCNT/PANI | 10.6 | 0.0–0.40 | 0.01 | Boiled water from baby feed bottles | 134 |
| IL-GNP | 8.0 | 0.02–5.0 | 0.0064 | Plastic bottles, Water in the plastic bottles | 135 |
| US-MagMIP /AuNPs/CBNPs | 7.0 | 0.07–10 | 0.0088 | Tap water, Mineral water | 136 |
| Tyr/APS/Au-GN | 6.0 | 0.04–43.8 | 0.0079 | Olive oil, Chips | 137 |
| Anti-BPA/AuNPs/N,S,P-CDs | 8.0 | 0.01−120 | 0.0005 | Disposable plastic spoons, Plastic lunch boxes, Mineral water Tap water, Milk | 142 |
| Molecular imprinted TiO2 single crystals | 7.0 | 0.01–20.0 | 0.003 | Baby nipple, Water bottle, Beverage bottle, Fresh film, Food package, Instant food | 146 |
| MIPN | 4.0 | 0.02–1.0 | 0.008 | Lake water, Tap water, Drinking water | 147 |
| CuPc/MWCNT-COOH | 2.0 | 0.1–27.5 | 0.0189 | Water samples in plastic bottles | 148 |
| Zn/Al-LDH-quinclorac/MWCNT | 7.4 | 0.03–0.70, 1.00–10.0, and 30.0–300.0 | 0.0044 | Baby bottle, Mineral water | 149 |
| AgNP/MWCNT | 3.0 | 5.0–152.0 | 2.40 | Local tap water | 150 |
| Ce-doped ZnO | 7.0 | 0.05–3.2, 3.2–62.0 | 0.018 | Tap water | 151 |
| MWCNT-SiO2@Au | 8.0 | 0.0001–0.10 | 0.00001 | Mineral water, Orange juice, Milk | 152 |
| AuNPs/G-IL | 7.0 | 0.01–60.0 | 0.0048 | Disposable paper cup, Disposable plastic bottle, Instant noodles cup | 153 |
| Au-Cu@BSA-GNRs | 7.0 | 0.01–2.0 and 2.0–70 | 0.004 | Tap water, Bottled water, Baby bottle, Food storage container | 154 |
| MI-TiO2 | 7.0 | 1.0–35.0 | 0.095 | Lake water, Tap water, Municipal Sewage | 155 |
| GNPs-AuNPs | 1.04 | 0.005–100.0 | 0.000027 | Mountain spring water, Tap water | 156 |
| Poly (CTAB)/MWCNTs | 5.0 | 0.002–0.808 | 0.00013 | Drinking water bottle, Baby bottle, Baby teether | 157 |
| Tween 20/CNT | 7.0 | 1–100 | 0.30 | — | 158 |
| PTCA-CNHs | 7.0 | 0.01–2.30 | 0.004 | — | 159 |
| Bamboo Fungus-Derived Porous Nitrogen-Doped Carbon | 8.0 | 1–50 | 1.068 | Soil extract samples | 160 |
| PANI-GO/GCE | 7.0 | 0.002–0.1 and 0.1–3.0 | 0.0005 | Tap water, Food wrapper, Drinking water cups and Drinking water buckets | 161 |
| PEDOT/MWCNT/GCE | 8.0 | 10−100 and 100−5000 | 1.70 | — | 162 |
4-Nitrophenol
Nitrogen containing aromatic compounds such as para-nitrophenol (4-nitrophenol, 4-NP) have a widespread use in industrial sectors. They are routinely used in the production of paints, plasticizers, leather, pesticides, explosives, dyes, drugs, and so forth.163,164 Even at low concentrations, the nitro-aromatic compounds are considered to be carcinogenic, mutagenic and teratogenic pollutants and therefore, they pose a significant risk to human health and aquatic biota.165 Moreover, they have high polarity and are poorly biodegradable due to the presence of strong electron withdrawing groups, which causes 4-NP to persist in the environment (soil and water) for a long time after its release as wastewater effluents from the industries where it is used.166 Moreover, due to its bioavailability and prevalent use, 4-NP is found in freshwater environment and it has been classified as primary pollutant by the United States Environmental Protection Agency.167 Several conventional methods have been utilized for detection and quantification of 4-NP from contaminated aquifers including, capillary electrophoresis,168 liquid chromatography–mass spectrometry,169 gas chromatography–mass spectrometry,170 flow-injection reflectometry,171 and fluorescence.172 Electrochemical techniques have received great attention as complementary pre-screening tools to the aforementioned conventional techniques in detection of the environmentally hazardous 4-NP.78,164,166,173 Since the surface properties and the sensor constituents are extremely important in eliciting electrochemical response with high sensitivity several nanocomposite-based sensors have been recently developed.78,165,173,174 Li et al.173 have fabricated a nanocomposite with cetyltrimethyl ammonium bromide (CTAB) and graphene nanosheets using a simple wet-ball-mill synthesis approach for detection of 4-NP. The exfoliation efficiency of the graphene nanosheets was greatly enhanced by the use of CTAB during the synthesis. They reported that the sensitivity of the electrochemical sensor was directly proportional to the ball-milling time, with optimized time of 12 h. The linear range for their sensor was from 7.19 μM to 107.83 μM, while the estimated limit of detection was 3.02 μM.173 Although, the nanocomposite fabrication method is facile and straight-forward, compared to the other recently developed nanocomposite-based electrochemical sensors by Kumar et al.163 , the sensitivity of sensor in terms of the detection limit by Li et al.173 was too low. Kumar et al.163 electrodeposited copper nanospheres and metallized a chemically modified electrode to develop a novel nanocomposite-based electrochemical sensor for the detection of 4-NP. They were in turn inspired by the copper deposition on self-assembled monolayer175 and curcumin conjugation176 studies available in literature. Kumar et al.163 fabricated a sustainable nanocomposite by first synthesizing the curcumin-cysteine (CC) composite using Fischer esterification method. Next, the dithiol terminated CC composite was used for modifying the gold electrode through self-assembly approach. Finally, copper nanospheres conjugated with diketo moiety of curcumin and the electrochemical sensor was used for chronoamperometric sensing of 4-NP in the concentration range of 0.1 μM–900 μM and 970 μM–1760 μM, with a detection limit down to 0.057 μM. This detection limit becomes highly relevant as the US EPA and the European Commission have set the safety limit for 4-NP in drinking limit to be 0.43 μM and 0.0007 μM respectively.163
A recent study by Kim et al.165 developed nanocomposites from the electrocatalysts of Au and zinc sulfide (ZnS) nanorods for trace detection of 4-NP. The synthesis of Au-ZnS nanocomposites was performed using a simple photo-assisted reduction step. The gold nanoparticles were utilized for improving the electron transfer processes and were photo-deposited on the ZnS rods to form Au-ZnS hybrids (AZS) (Fig. 11). This study also tested the effect of different weight percent of gold used for depositing and decorating the ZnS nanorods. The best results in terms of linear range and the detection limit for the electrochemical sensor was achieved when the loading amount for the gold salt was 8%. Another significant advantage of Au in the AZS hybrids was the electron reduction at the interface of Au-ZnS nanocomposite during anodic potential scan. This allows the oxidation of 4-NP at lower oxidation potential (+0.1 V).165 Moreover, the electrooxidation current was linearly proportional between the concentration range of 0.15 μM–2 μM, with a detection limit of 0.32 μM.

Figure 11. Schematic representation for the preparation of Au-ZnS nanocomposites using the photo-assisted reduction method and its application in detection of 4-NP.165 Adapted with permission from Ref. 165 by Y. Kim, K. Giribabu, J. G. Kim, J. B. Lee, W. G. Hong, Y. S. Huh, and H. J. Kim, ACS Sustain. Chem. Eng., 7, 4094–4102 (2019). Copyright (2019) American Chemical Society.
Download figure:
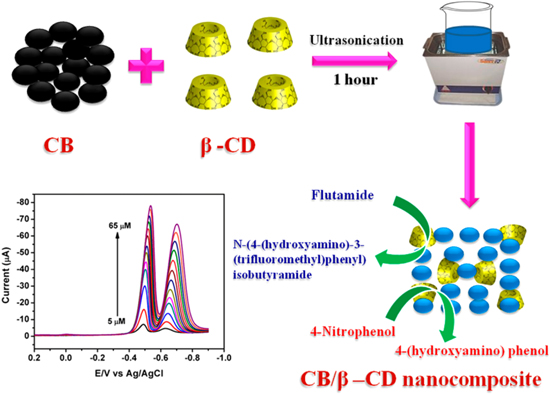
Standard image High-resolution imageKubendhiran et al.166 used ultrasonication method to produce a non-covalent carbon black and β-cyclodextrin (β-CD) nanocomposite (Fig. 12). This nanocomposite was used to modify screen-printed electrodes for determination of 4-NP. The conductivity of the carbon black improved the electrochemical sensing property, while the β-CD increased the polarity of the nanocomposite and improved the supramolecular recognition of 4-NP.166 The nanocomposite-based electrochemical sensor in this case had excellent sensitivity and robustness depicted by wide linear range from 0.125–255.80 μm with a detection limit of 0.040 μm. This was one of the first work using a facile ultrasonication approach to achieve a stable dispersion of the carbon black using β-CD. This will create new opportunities for creation of cost-effective nanocomposites using greatly conductive carbon black for detection of different nitroaromatic compounds.166 Rajkumar et al.,68 have recently proposed an electrooxidation mechanism in the presence of S-GCN nanosheets which included a multi-step irreversible catalytic reduction of 4-NP. It was proposed that 4-NP is inclined to lose four electrons and four protons in the first step first to form 4-hydroxylaminophenol. In the following step the 4-hydroxylaminophenol followed a reversible two-electron and two-proton redox reaction to form 4-nitrosophenol. Again, it should be noted that this study did not discuss the real-life implications of the by-products, therefore, it is recommended that future studies should be performed for improving the mechanistic insights about 4-NP electrooxidation (Scheme
Figure 12. Schematic illustration for the fabrication and electrochemical application of the CB/β-CD nanocomposite.166 Reprinted with permission from Ref. 166 by S. Kubendhiran, R. Sakthivel, S. M. Chen, B. Mutharani, and T. W. Chen, Anal. Chem., 90, 6283–6291 (2018). Copyright (2018) American Chemical Society.
Download figure:
Standard image High-resolution image
The analytical performance results of nanocomposite-based electrochemical, especially voltammetric, sensors for the detection of 4-NP are summarized in Table III.
Table III. Analytical performance of the recently developed nanocomposite-based voltammetric sensors for the detection of 4-NP.
| Nanocomposite | pH | Linear Range (μM) | Detection Limit (μM) | Matrices Tested | References |
|---|---|---|---|---|---|
| PDQCM | 2.0 | 2.50–130.0 | 0.80 | Tap water, River water | 64 |
| AcSCD-AuNPs-MC | 6.5 | 0.10–10.0 and 10.0–350.0 | 26.10 | Tap water, Lake water | 78 |
| S-GCN | 5.5 | 0.05–90.0 | 0.0016 | Industrial sewage, Domestic sewage, Underground water | 68 |
| CoPcNRs/FA-rGO | 4.5 | 2–140 | 0.65 | River water | 119 |
| CC-Cu | 3.0 | 0.10–900.0 and 970.0–1760.0 | 0.057 | Lake water samples | 163 |
| CTS/NPC | 7.0 | 2.0–400.0 | 5.44 | River water, Tap water | 164 |
| Au-ZnS nanorods | 6.0 | 0.15–2.0 | 0.32 | Real water samples | 165 |
| CB/β-CD | 7.0 | 0.125–225.80 | 0.04 | Tap water, Human serum | 166 |
| AgPd@UiO-66-NH2 | 7.0 | 100.0–370.0 | 0.032 | Tap water | 167 |
| CTAB-GNPs | 7.0 | 7.19–107.83 | 3.02 | — | 173 |
| Sm2O3 NPs@f-CNF | 7.0 | 0.02–387.2 | 0.00261 | Drinking water, River water | 174 |
| Ag/MIL-160/Nafion | 7.0 | 0.1–1.0 | 0.04 | — | 177 |
| meso-ZnCo2O4 | 7.0 | 1.0–4000.0 | 0.30 | — | 178 |
| FMC-AMWCNTs | 7.0 | 0.10–100.0 | 0.073 | Lake water, River water | 179 |
| JUC-62@pOMC-3 | 7.0 | 0.05–420.0 | 0.018 | Tap water, Lake water | 180 |
| CM-AgNPs/rGO-FeCo2O | 7.4 | 2.50–1200.0 | 0.0184 | River water, Wastewater | 181 |
| Pd NFs/C60-NH2 | - (0.05 M H2SO4) | 5.0–1000.0 | 0.09 | River water | 182 |
| MWCNTs/MnO2 | - (1 M KCl) | 30.0–475.0 | 0.64 | Tap water, River water | 183 |
| CoMnO3 nanosheets | 7.0 | 0–249.0 | 0.01 | River water, Domestic sewage | 184 |
| TA@Fe3O4-AgNPs | 7.0 | 0.1–680.10 | 0.033 | Tap water, Drinking water, River water | 185 |
| GR-AB | 1.0 | 0.02–8.0 and 8.0–100.0 | 0.008 | River water, Lake water, Wastewater, Tap water | 186 |
| PVA10-Wyoming clay | 13.0 | 0.25–200.0 | 0.1 | River water | 187 |
| BPW-cPANI | - (0.05 M H2SO4) | 100–1000 | 77.1 | Tap water | 188 |
| Nafion-GCNFE | 5.0 | 0.01–1.5 and 1.5−50 | 0.004 | Tap water, Lake water | 189 |
| 3D–Co3O4 PHs | 7.0 | 0.025–1730 | 0.0409 | Drinking water, River water | 190 |
Conclusions and Future Perspectives
Exponential growth of population, urbanization and anthropogenic activities have resulted in increased release of pollutants to air, water and soil across the globe. The contaminated ecosystems have led to discoveries of toxic pollutants in the most pristine environment. To prevent any catastrophic consequences, routine monitoring and early detection of the pollutants from the environment is of paramount significance. With the emergence of nanotechnology, nanocomposites are an incredible prospect which can help in developing some rapid, sensitive, selective, reliable and cost-effective methods for detection of pollutants in conjunction to the pre-existing electroanalytical technologies. The introduction of nanocomposites can enhance the mechanical and the physical characteristics for environmental monitoring. The incorporation of a nanocomposite in an electrochemical sensor can enhance the performance due to the synergistic effects and interactions between its constituents. In this review, we have highlighted the recent developments in this field and overviewed the performance of the various novel nanocomposite-based voltammetric sensors, which can help in addressing the gaps existing in sensitive detection of phenolic pollutants. The nanocomposites have reported to increase the electron transfer rate and the sensitivity of the electrochemical sensors. The nanocomposites were also reported to have catalytic properties, providing a large redox-active surface area. Enhanced redox-active surface area can help in overcoming the overpotential, which can result in achieving high oxidation currents even at low concentrations of the pollutants. Despite several advantages of the nanocomposites, there are some limitations for most of the reported nanocomposite-based electrochemical sensors that must be addressed to the allow the field to continue in its upward trajectory. Some of the challenges include the fabrication of the nanocomposites, where the precise morphological control is difficult to guarantee from batch-to-batch. The developed nanocomposites should be tried to attach covalently to the electrode to improve the stability, shelf-life and sustainability of the electrode as during the detection of pollutants, mechanical actions can cause the nanocomposites to get detached from the electrode surface. Another major limitation of the electrochemical sensors pertains to its deficiency in application to real samples, as majority of recovery tests are performed using tap water, river water or lake water. For phenolic pollutants such as HQ, CC, RS, BPA and 4-NP the recovery tests performed tap, river or lake water might not be ideal. Future research should use real samples such as wastewater from industries known to produce the aforementioned pollutants, human urine or serum samples, commercial products such as hair dyes, skin whitening creams, canned food and beverages, which can help in improving the analytical scope of the nanocomposite-modified electrochemical sensor. The real environmental samples such as wastewater or any other media could affect the electrocatalytic activity of the electrochemical sensor. However, due to their potential for miniaturization and mass production at low-costs, the commercialization of the nanocomposite modified electrochemical sensors for which the sensitivity and the detection limits accomplished are well below the safety limits set by the environmental monitoring agencies and recovery tests performed in appropriate matrices should be examined. Finally, advanced and novel nanocomposites with different permutations and combinations should be optimized and validated with further investigations for developing electrochemical sensors that can assist in rapid detection of trace level of pollutants. With the rapid advances in nanotechnology and fabrication techniques, we envisage that the nanocomposite-based electrochemical sensors will soon transition from the research and development stage in a laboratory setting into the commercial world for easy and rapid point-of-care diagnostics of environmental pollutants.
Acknowledgments
Bhargav R. Patel gratefully acknowledges a PhD award from Ontario Graduate Scholarship (OGS). Kagan Kerman acknowledges financial support from the Canada Research Chair Tier-2 award for "Bioelectrochemistry of Proteins" (Project no. 950-231116), Ontario Ministry of Research and Innovation (Project no. 35272), Discovery Grant (Project no. 3655) from Natural Sciences and Engineering Research Council of Canada (NSERC), and Canada Foundation for Innovation (Project no. 35272).