
Abstract
The stains on the pad caused by polishing by-products can be observed in a copper chemical and mechanical polishing (CMP) process. In this study, the effects of stains on CMP performance such as erosion, dishing, and nonuniformity were evaluated as a function of the degree of stains accumulated on the pad. The stains on the pad deteriorate the nonuniformity of removal rate and result in the increase in erosion and dishing. CMP by-products adhere on both pores and grooves of the pad and block the flow of slurry through the grooves, resulting in the deterioration of nonuniformity. The selectivity (ratio of removal rate, Cu to TaN or dielectric film) is important in order to minimize erosion. When wafers were polished on a stained pad, the removal rate of Cu decreased  due to the poor slurry distribution and the selectivity decreased more than 40% because the mechanical abrasion was enhanced by the presence of by-products on pad surfaces. The lower the selectivity, the higher the level of erosion on the polished patterned wafers. The higher frictional force on a stained pad results in higher temperature and etch rate of Cu which might be the reason for recess and dishing of Cu lines.
The rapid scaling of metal-oxide-semiconductor field-effect transistors (MOSFETs) has been successfully continued for more than three decades since the early 1970s.1, 2 In the past, these improvements were achieved mainly from the front-end process, such as reducing the transistor dimension as well as the thickness of gate oxide. Little attention was paid to the back-end of line (BEOL) multilevel interconnects. Because of the scaling of BEOL, resistance and capacitance (RC) delay cannot catch up with the improvement of transistors, and multilevel interconnects are rapidly becoming a bottleneck to overall performance.3 The use of new materials for interconnects will reduce the RC delay. Copper application for interconnection offers faster and more reliable integrated circuit (IC) device due to its low electrical resistivity and superior electromigration resistance compared to aluminum. By replacing Al with Cu, there is a 40% reduction in resistance.4
For Cu interconnection, a damascene process using chemical mechanical polishing (CMP) has been introduced and Cu CMP has been actively investigated in recent years.5 CMP is a process of polishing assisted by chemical and mechanical reactions. Especially, the performance of Cu CMP is strongly dependent on the slurry chemistry because Cu easily corrodes and does not form a thick Cu oxide on Cu surface.6
During Cu CMP process, polish by-products are usually found on the polishing pad. The polish by-products are generated by the chemical interaction between the Cu film on the wafer surface and the slurry. The polish by-products cannot be easily removed by simple pad conditioning using a diamond disk, and the color of the pad is changed to brown after Cu CMP. Many semiconductor manufacturers have been using a special pad-cleaning solution to eliminate the stains on the pad, but it cannot remove all of stains perfectly. Therefore, the stains eventually decrease the pad lifetime.
In this study we investigated the effects of polish by-products on the performance of Cu CMP. Removal rate, nonuniformity, and removal selectivity were evaluated as a function of the degree of stains on the pad. The surface topography such as erosion and dishing was measured on patterned wafers according to the degree of stains on the pad. Finally, the frictional behavior and the variation of pad temperature during polishing were compared with and without the presence of polish by-products.
Experimental
The commercial Cu slurries, which may or may not generate either polish by-products on the pad, were used to investigate the effect of by-products on Cu polishing behavior. Table I summarizes the characteristics of these two slurries. CMP was conducted on a polisher (Mirra, Applied Materials). The  blanket Cu, TaN, and fluorosilicate glass (FSG) wafers were polished to measure the removal rate (RR) of each film, nonuniformity, and selectivity. Removal rate was calculated from sheet resistance values measured at 121 points along the diameter scan with
 edge exclusion. One sigma nonuniformity (standard deviation/average
 ) of removal rate was calculated from all points. Pad breakin was carried out with a diamond disk for
 and three dummy wafers were polished before the experiment. In situ pad conditioning was carried on every wafer with a diamond disk during polishing. The stains on the pad were qualitatively analyzed with energy dispersive spectroscopy (EDS) to confirm their chemical composition.
Table I. Characteristics of the copper slurries used in the experiments.
| Slurry A | Slurry B | |
|---|---|---|
| pH | 8.0 | 3.8 |
| Solid contents (%) | 4.2 | 0.1 |
| Abrasive | Alumina | Silica |
| Oxidizer |

|

|
| Components | Complexing agent, | Complexing agent, |
| Corrosion inhibitor (BTA), etc. | Corrosion inhibitor, etc. |
The patterned copper wafers were prepared with an FSG dielectric process scheme to evaluate both erosion and dishing with pattern densities of 20%, 50%, and 80% at a minimum linewidth of  . They were fabricated in a single damascene process to have a trench depth and thickness of electroplated Cu of 500 and
 , respectively. Erosion and dishing were measured with atomic force microscopy (AFM) just after Cu polishing. Dishing was measured on patterns of both 200 and
 linewidths. For every patterned wafer, the amount of over-polishing was set in the same target, 50%, which was calculated from the removal rates of each wafer.
The frictional behaviors of Cu, TaN, and FSG films during polishing were studied using a frictional polisher (POLI-500, GNP Technology, Korea), which can measure the friction force in situ during polishing. Normal and lateral force signals were measured during Cu polishing by preinstalled two piezoelectric sensors at a rate of  . The temperature on the pad was measured with an infrared (IR) thermometer as a function of the polishing time during polishing.
The corrosion current and potential of copper film were measured with a computer controlled potentiostat (PAR 273A) having three electrode cells. Tafel plots were obtained by scanning at  from
 below the open-circuit potential
 to
 above the open-circuit potential. A saturated calomel electrode (SCE) and Cu wafers (
 electroplated on TaN) were used for electrochemical tests.
Results and Discussion
Figure 1 shows the typical form of stains caused by polish by-products on the pad only after Cu CMP. These by-products easily contaminate the pad surface and change its color to brown after Cu polishing. The by-products were accumulated on pores and grooves of the pad during CMP and interrupted the distribution of slurry on the pad which resulted in poor within wafer nonuniformity (WIWNU) of removal rates. The stains on the pad were qualitatively analyzed with EDS to confirm the chemical composition of the by-products.
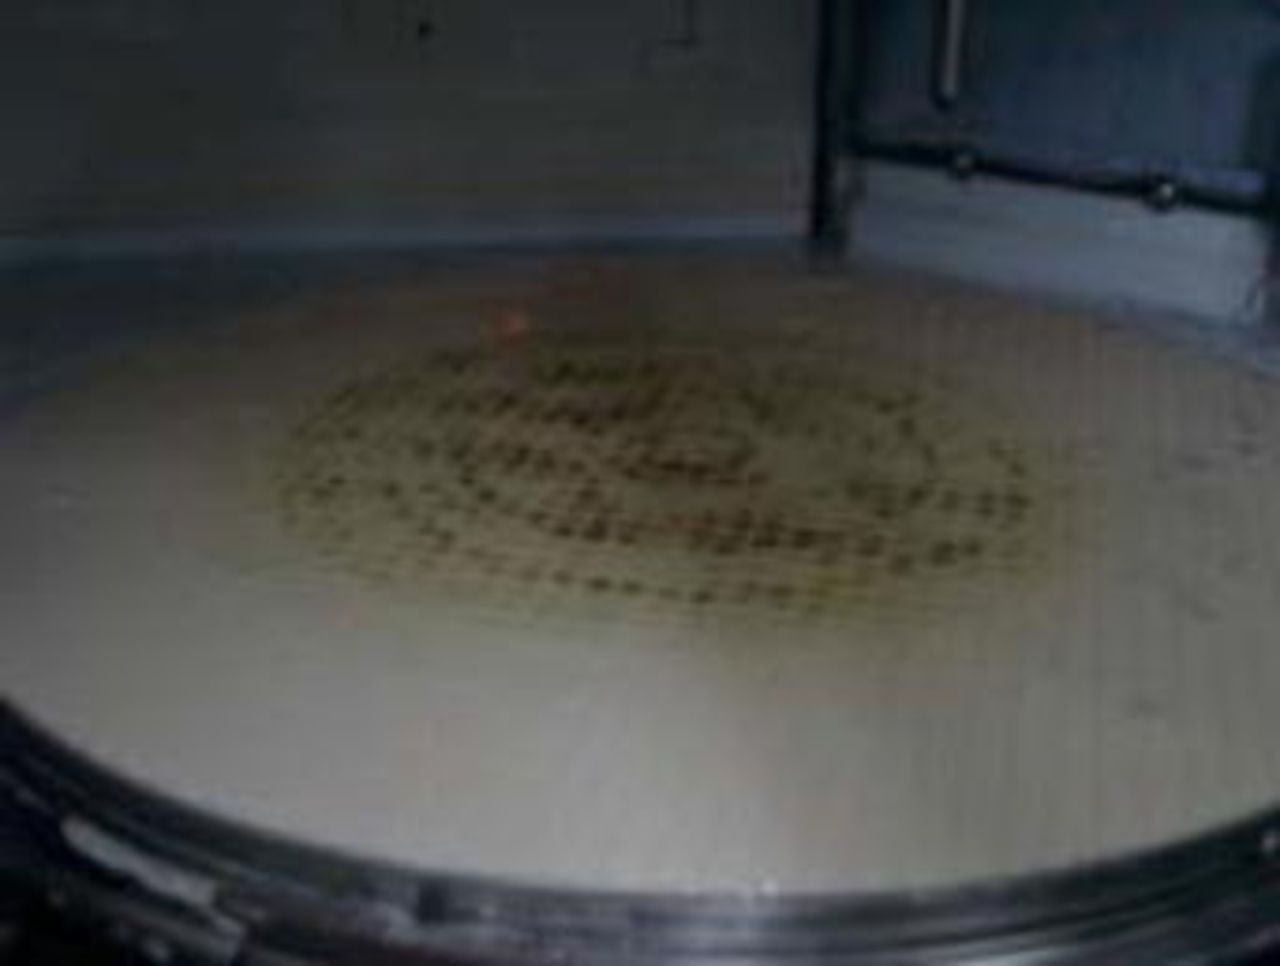
Figure 1. (Color online) Typical CMP pad stains caused by Cu polishing by-products.
Figure 2a shows an SEM micrograph of by-products filled in the pad pores. Area 1 and 2 are pad surfaces without and with by-products on them, respectively. EDS spectra of these areas are shown in Fig. 2b and 2c. In Fig. 2c, a strong Cu peak indicates that the stains on the pad are by-products originated from the reaction between slurry and Cu film during CMP. The magnitude of by-products increased on the pad as a function of the polishing time. To remove these by-product related stains on the pad, any chemicals which could dissolve Cu residues should be used as an additional pad cleaning step (chemical conditioning) with conventional conditioning process.
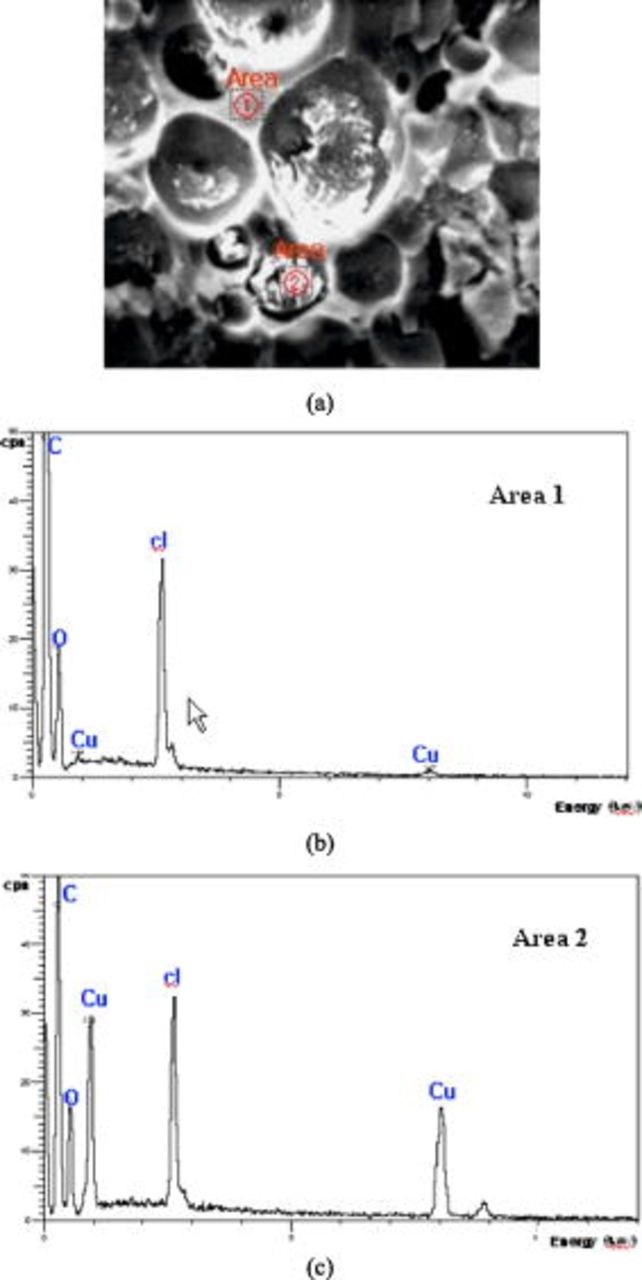
Figure 2. (Color online) (a) SEM photograph of pad pores after Cu CMP and EDAX spectra of pad areas (b) without and (c) with by-products.
To evaluate removal rates and nonuniformity, 25 Cu blanket wafers were continuously polished without additional pad cleaning process. In situ diamond conditioning was performed during polishing. Figure 3 shows the removal rate of Cu and polishing nonuniformity as a function of number of wafers polished. The removal rate decreased, whereas nonuniformity increased with the increase in the number of polished wafers. The 23rd wafer resulted in the drop of the removal rate by 25% compared to the 5th wafer. As polishing continued, the accumulation of the polish by-products interrupted the uniform slurry distribution on the pad. Bull’s eye nonuniformity (BENU; 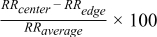 ) and the removal profile on specific wafers are shown in Fig. 4. The negative BENU value indicates a slower removal rate at the center area in the center to edge removal profile. As the polishing continued, BENU increased negatively, which indicates the drop of removal rates at center area. Polishing profiles clearly show the negative BENU over the wafer. The more wafers polished, the lower the removal rate and the more negative the BENU observed.
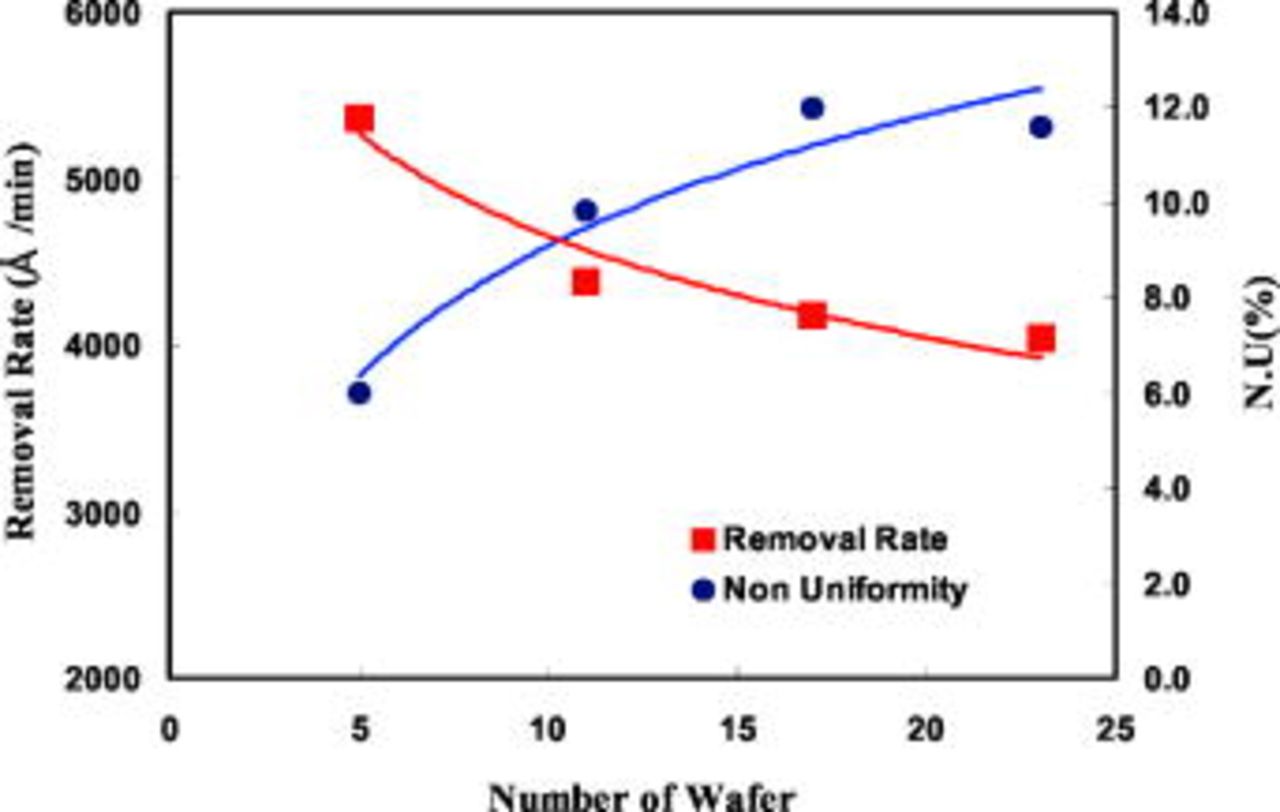
Figure 3. (Color online) Changes of Cu removal rate and WIWNU as the number of polished wafers increased.
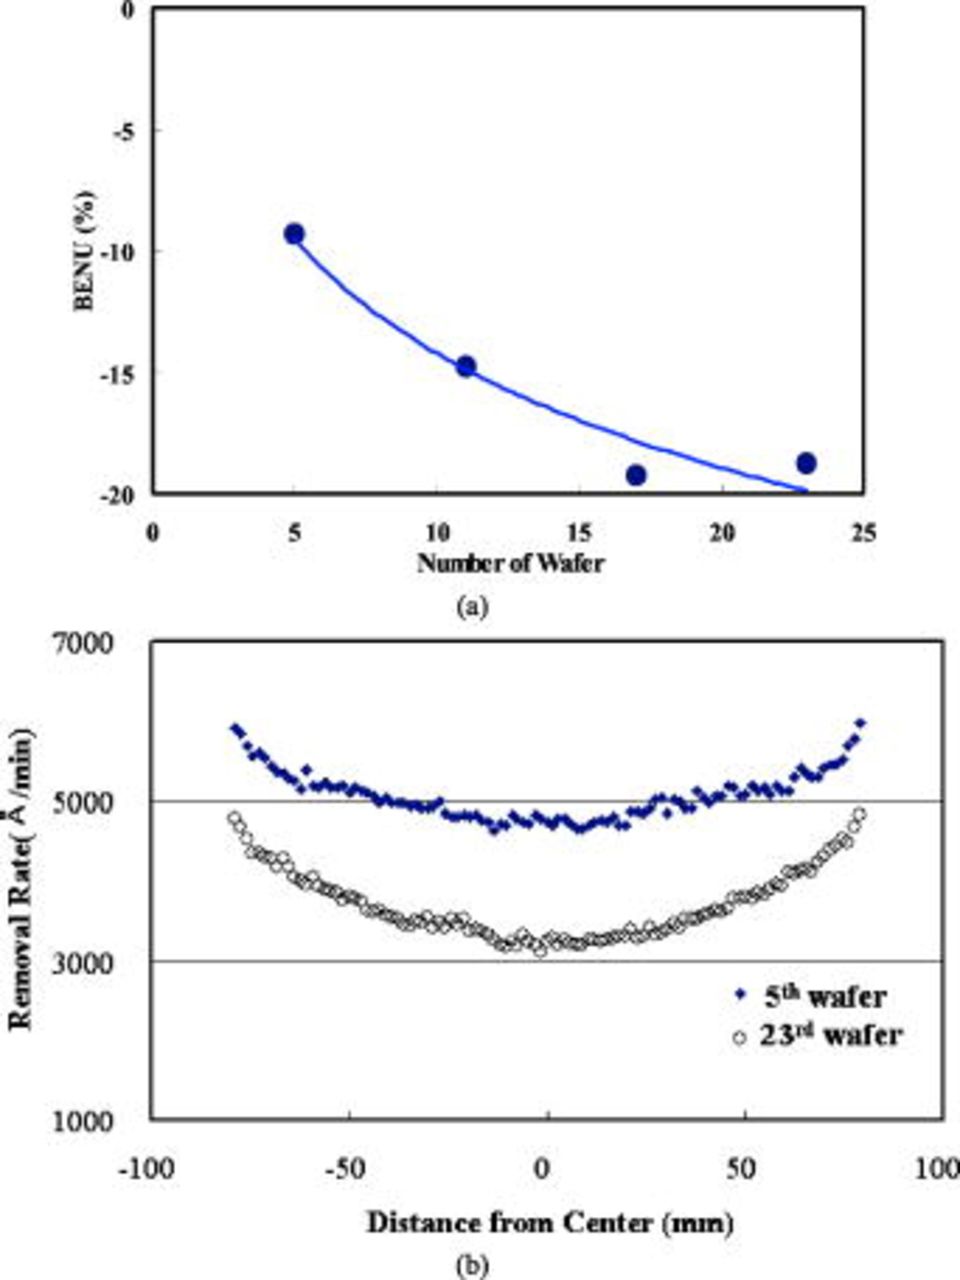
Figure 4. (Color online) Changes of (a) BENU as the number of polished wafers increased and (b) their polishing profiles in 5th and 23rd polished wafers.
Table II summarizes the removal rates of Cu, TaN, and FSG and their selectivities. Figure 5 shows the change of the selectivity between Cu, TaN, and FSG at different polishing times without chemical conditioning. As shown in Fig. 3, the Cu removal rate decreased as the polishing time increased whereas the removal rates of both TaN and FSG increased. This resulted in a drop of over 40% in selectivity. A lower selectivity causes the fast removal of TaN and dielectric films which can result in severe erosion. Because the Cu polishing must be stopped on the TaN barrier layer, the higher selectivity between Cu and TaN is highly favored in Cu CMP.
Table II. Removal rates of Cu, TaN, and FSG and selectivity of Cu vs TaN and FSG films.
| Removal rate (Å/min) | Selectivity | ||||
|---|---|---|---|---|---|
| Cu | TaN | FSG | TaN | FSG | |
| 5th wafer | 5364 | 68 | 115 | 78.9 | 46.6 |
| 23rd wafer | 4032 | 86 | 142 | 46.9 | 28.4 |
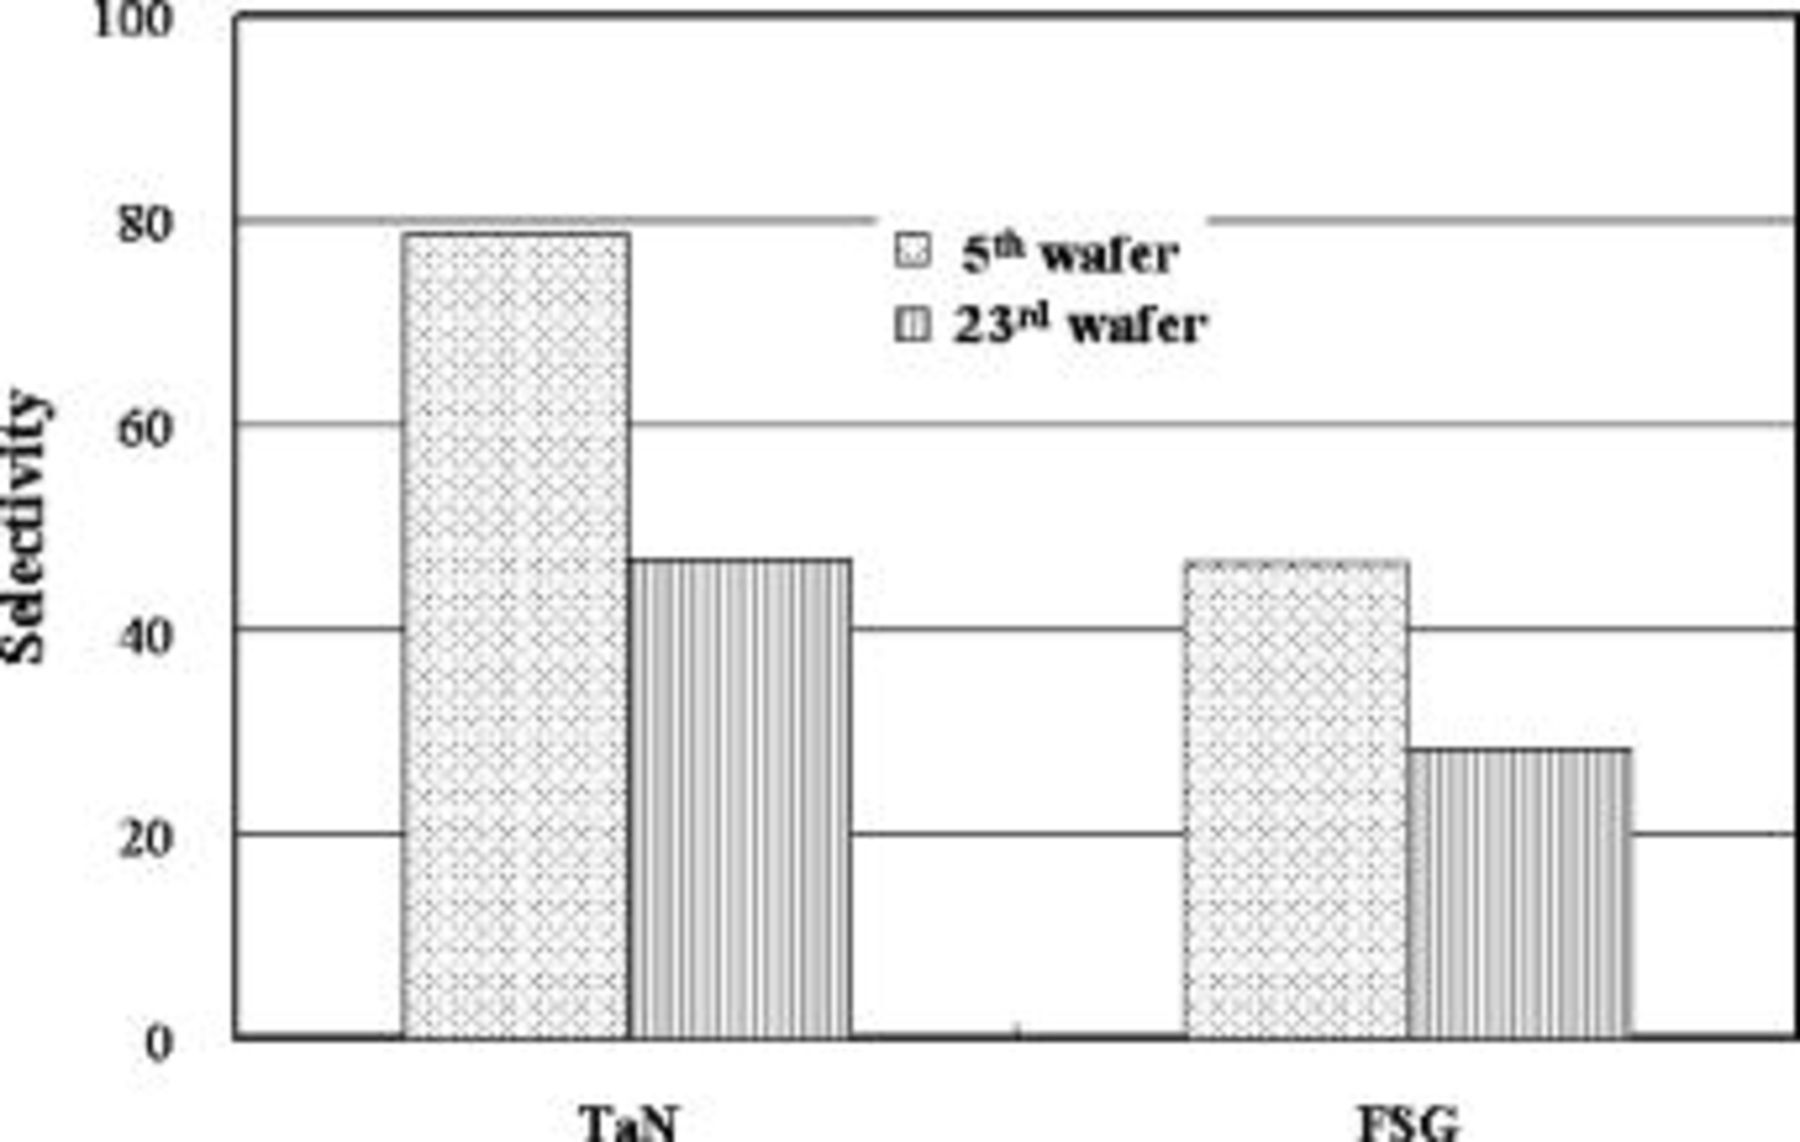
Figure 5. Change of selectivity of TaN and FSG vs Cu at 5th and 23rd polished wafers.
Figure 6 shows the erosion as a function of the pattern density at differently polished wafers without the chemical conditioning. It is well known that the magnitude of erosion increases as the pattern density increases.7, 8 As shown in Fig. 6, the 23rd polished wafer showed greater erosion than that of the 5th polished wafer due to the lower selectivity caused by polish by-products. Note that when the 23rd wafer was polished, the pad showed substantial stains, which were caused by polish by-products. On the 23rd wafer, the erosion and dishing increased by 50% and 30%, respectively, compared to the 5th. The dishing on patterns of 200 and  linewidths are compared in Fig. 7 when wafers were polished at the 5th and 23rd time. In both lines, around 30% increase in dishing was measured between the 5th and 23rd wafers. The increase in the magnitude of erosion was explained by the decrease of the selectivity between Cu and barrier metal films, as explained in Fig. 3 and 5. For every patterned wafer, the over-polishing amount was set to the same target in this experiment. 50% over-polishing amount was calculated after measuring removal rates of 5th
 and 23rd wafer
 . Therefore the total removal amount was targeted in the same 50% over-polishing on both wafers, so the polishing time of the 23rd wafer was longer than the 5th wafer because RR of the 23rd wafer was lower than that of the 5th wafer. Note that end-point detection (EPD) signal was monitored during polishing, EPD signal also showed that the polishing time of the 23rd wafer should be longer than that of the 5th wafer by
 .
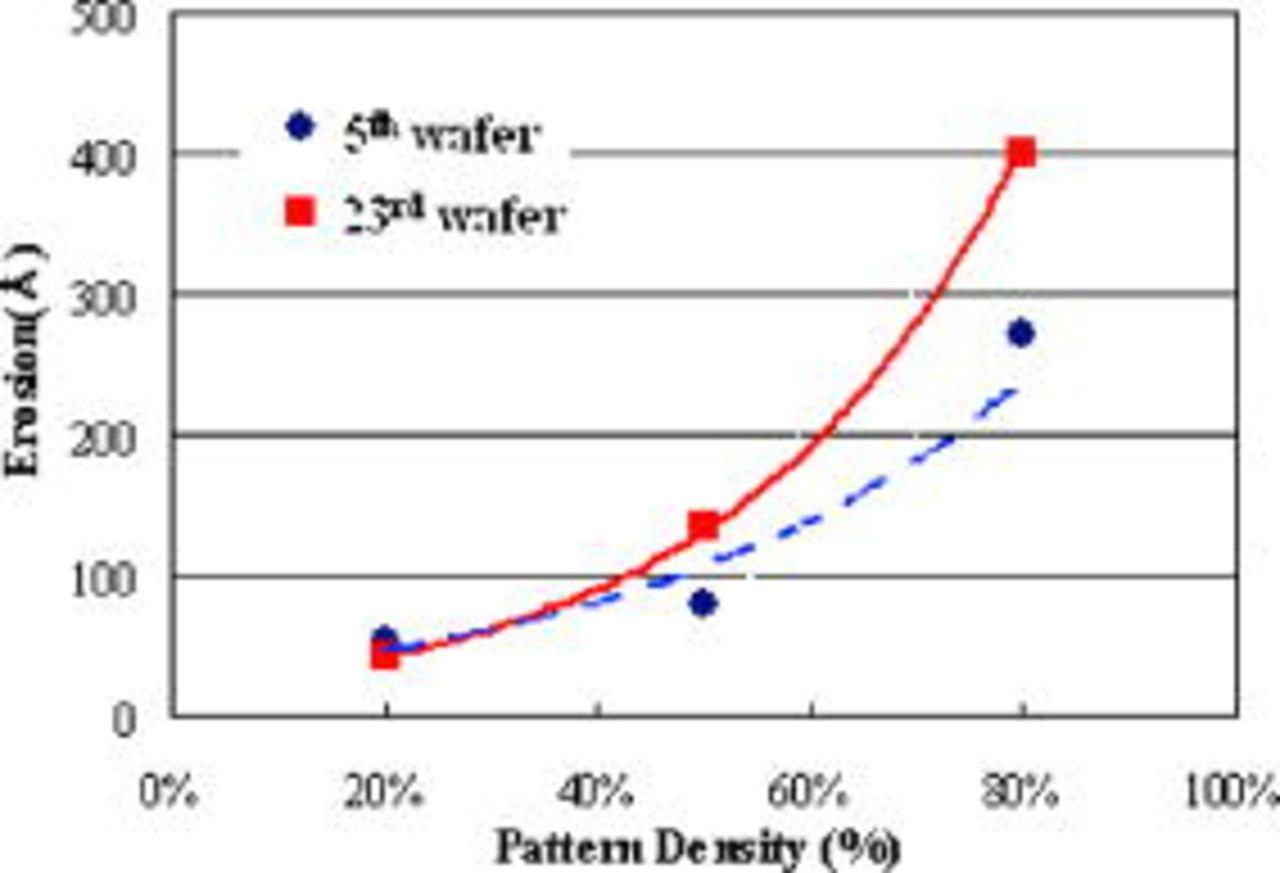
Figure 6. (Color online) Erosion of Cu at 5th and 23rd wafers at different pattern densities.
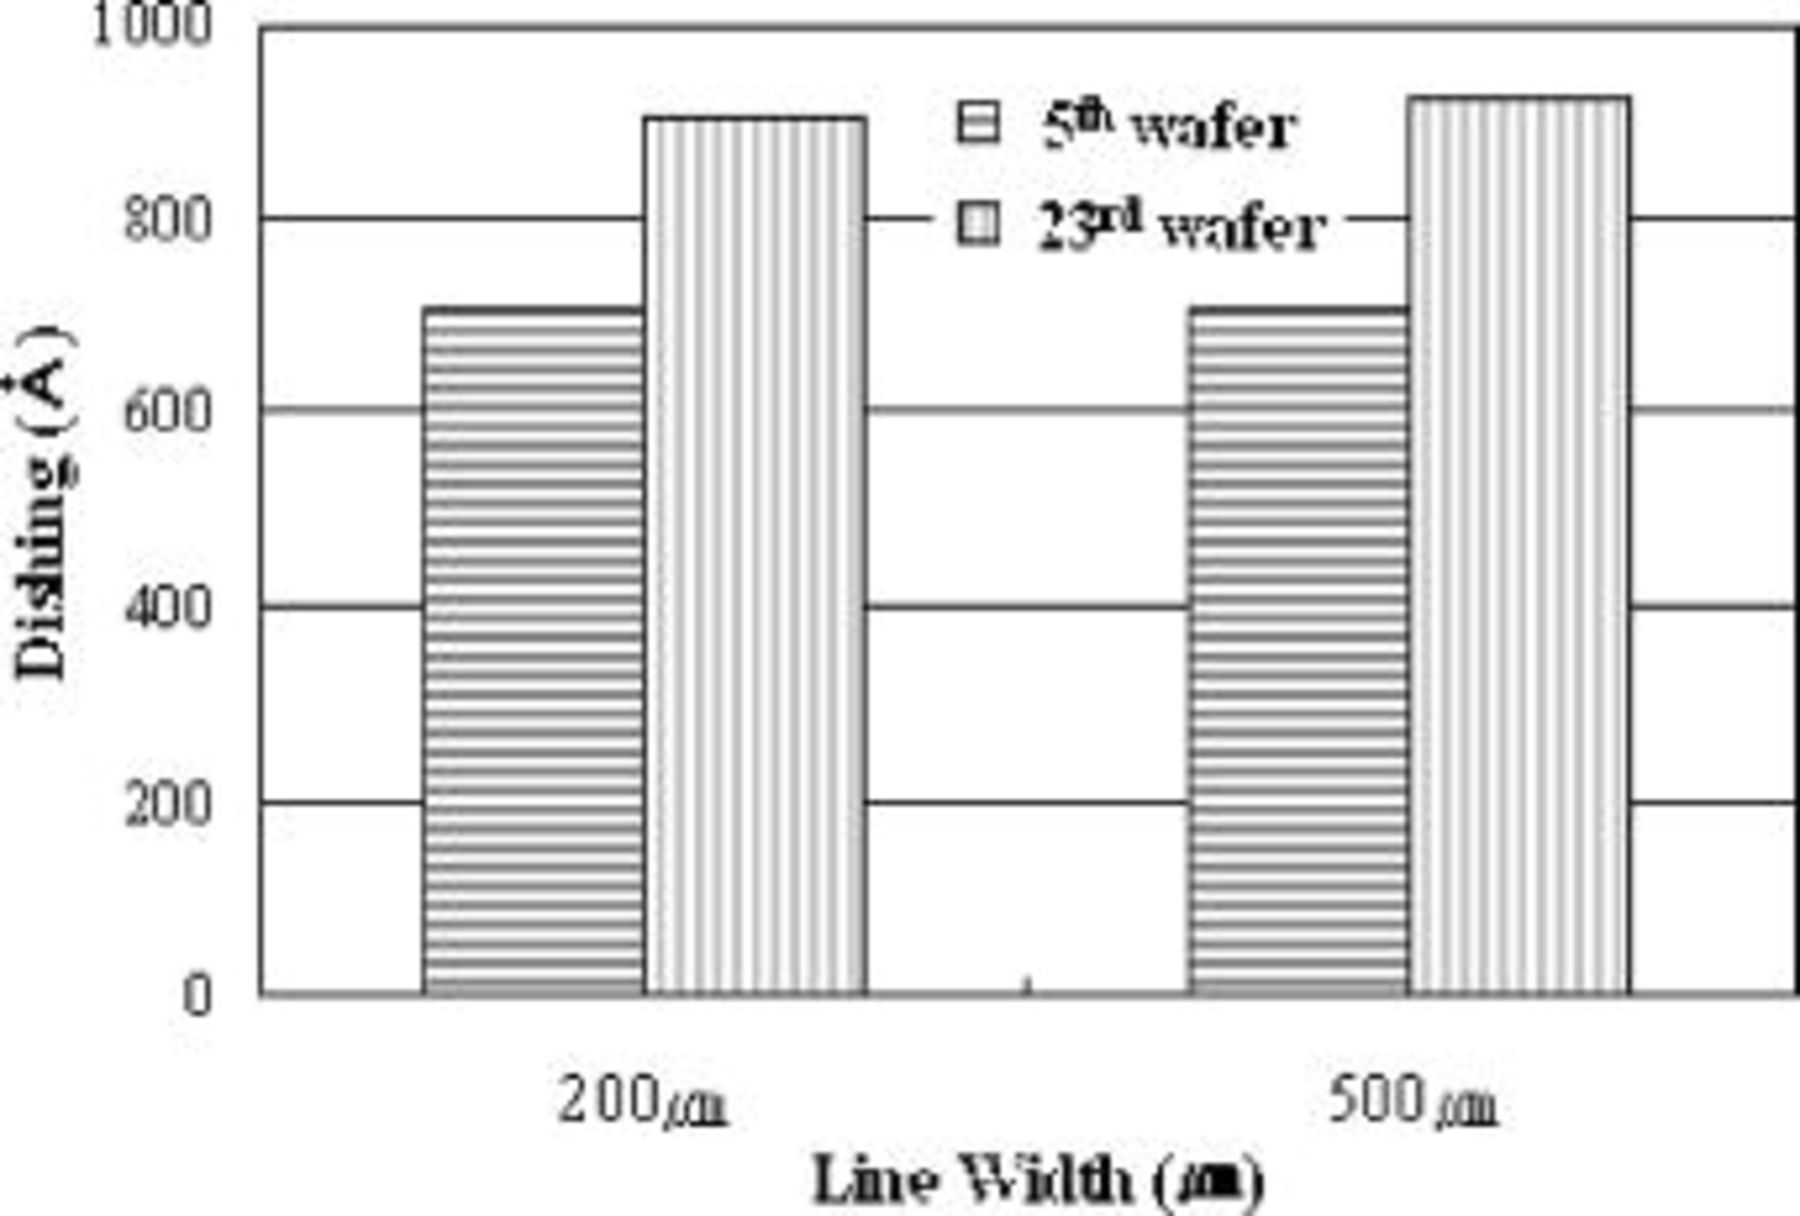
Figure 7. Dishing of 200 and  linewidth on the 5th and 23rd polished wafers.
Two kinds of commercial Cu slurries were evaluated in terms of the frictional behavior in the experiment. The first slurry, A, introduced severe stains on the pad; however, the second slurry, B, caused few stains during Cu polishing. Figure 8 shows the friction properties of Cu wafer polished with both slurries A and B. With slurry A, the friction force increased continuously with the polishing time, but with slurry B, the friction force became constant after  of polishing. It was believed that the increase of the friction force with slurry A was caused by the formation of polish by-products during CMP. The friction force was also dependent on the adhesion property between two contact materials.9 The work of adhesion between metal and metal is much higher than that between metal and polymer because the surface energy of metal is higher than that of polymer.10 In the CMP process, the friction force of Cu wafer-metallic by-product contact is stronger than that of Cu wafer-CMP pad contact. Therefore, the metallic by-product on the pad can increase the friction force during CMP. The high friction force has adverse effects on Cu/low-k CMP, resulting in the delamination and cracks on a low-k film. In Cu/low-k CMP, the low friction force must be required to prevent the low-k film from damages. The higher friction force generates more heat and increases the temperature on the pad. Figure 9 shows the change of the temperature on the pad with polishing time with two slurries. Slurry A shows the higher temperature because much heat was generated from higher friction. In slurry A, the high temperature can enhance etch rate of Cu.
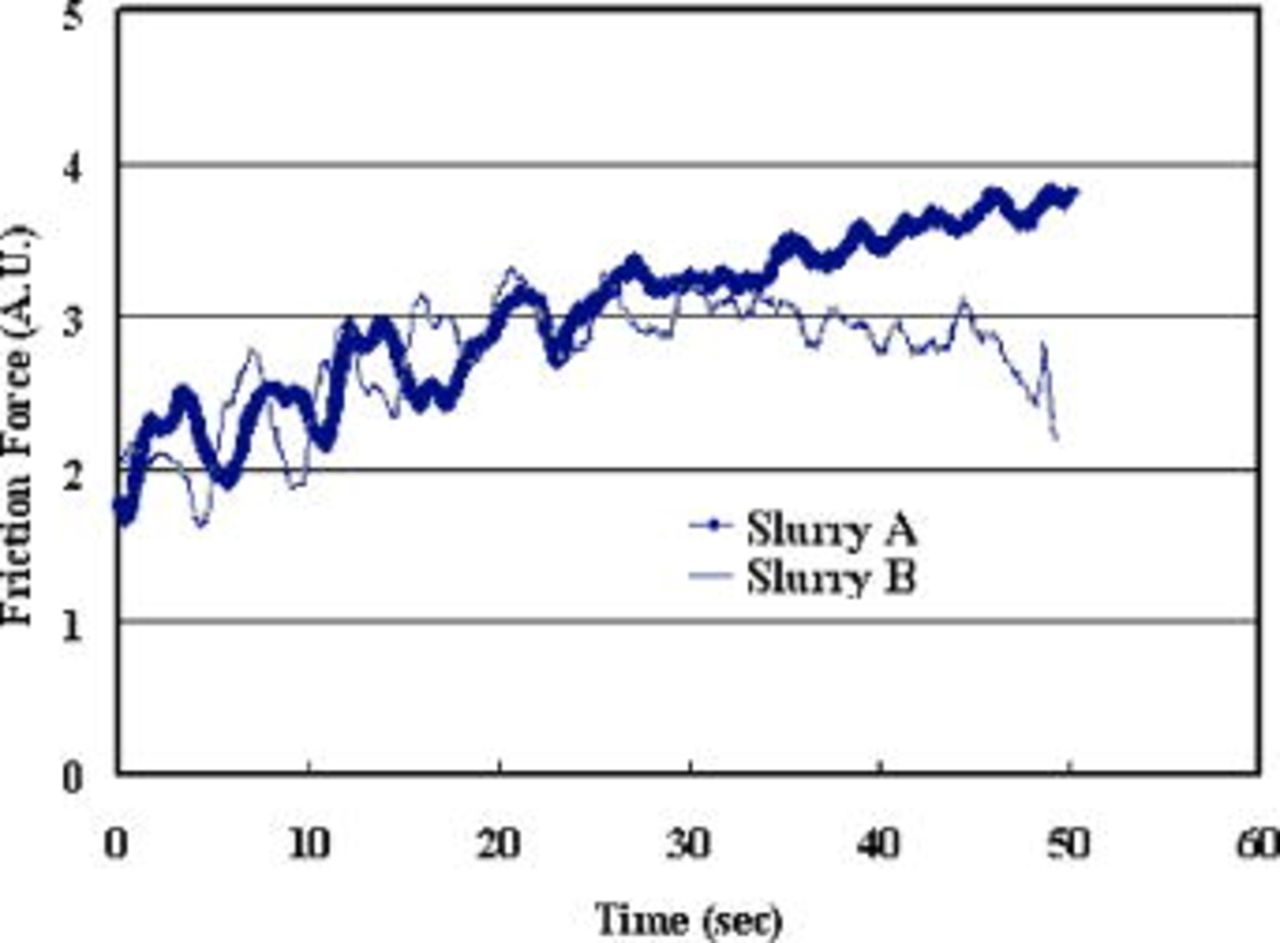
Figure 8. (Color online) Change of friction forces as a function of friction time when two different Cu slurries used.
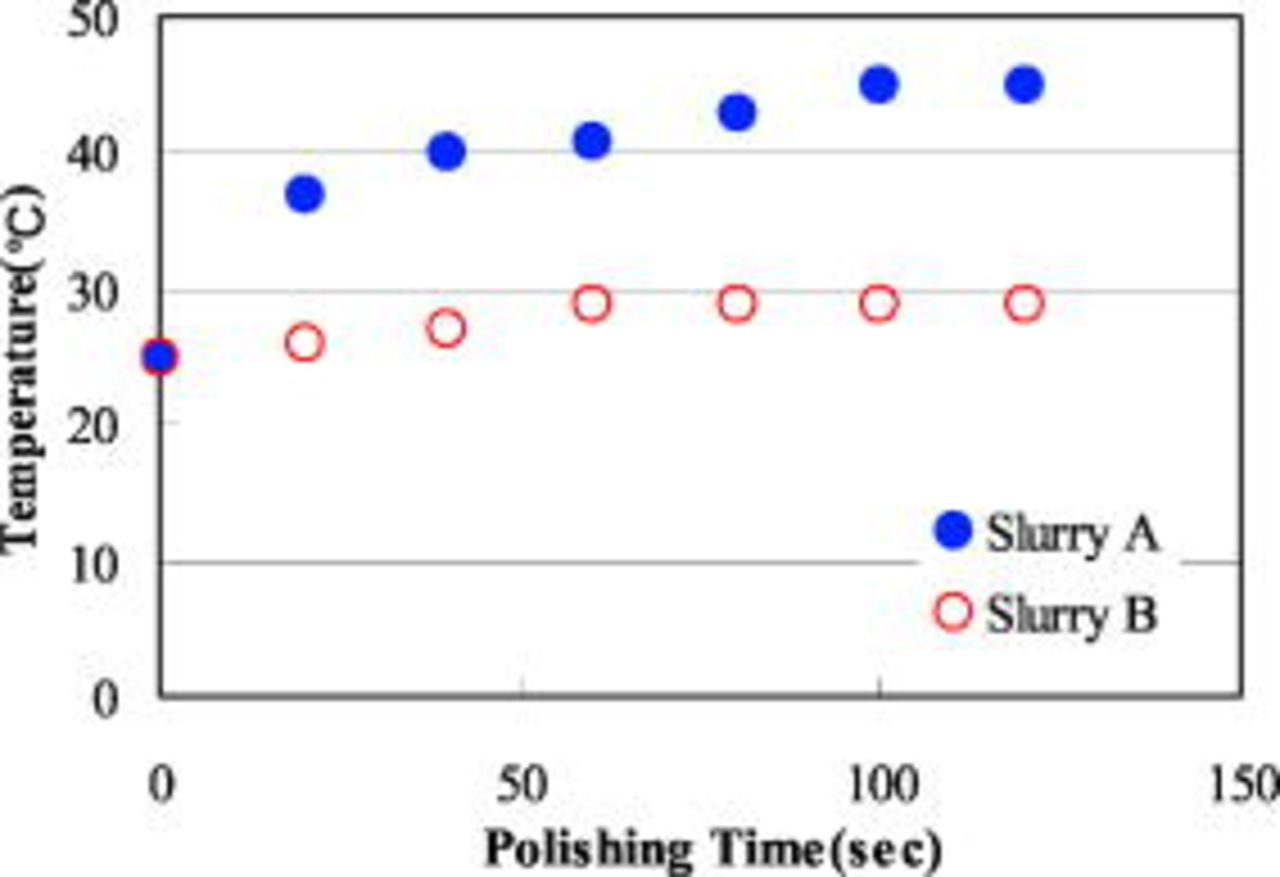
Figure 9. (Color online) Comparison of temperature change on pad during Cu CMP.
The corrosion current and potential of Cu were measured in slurry A at two different temperatures. Figure 10 shows Tafel plot of Cu in slurry A and Table III summarizes the corrosion current and potential. The high-temperature  caused two orders of magnitude higher corrosion rate than room temperature
 . The higher corrosion rate can enhance recess and dishing of Cu line. The stain on the pad causes a higher temperature, it results in the poor dishing.
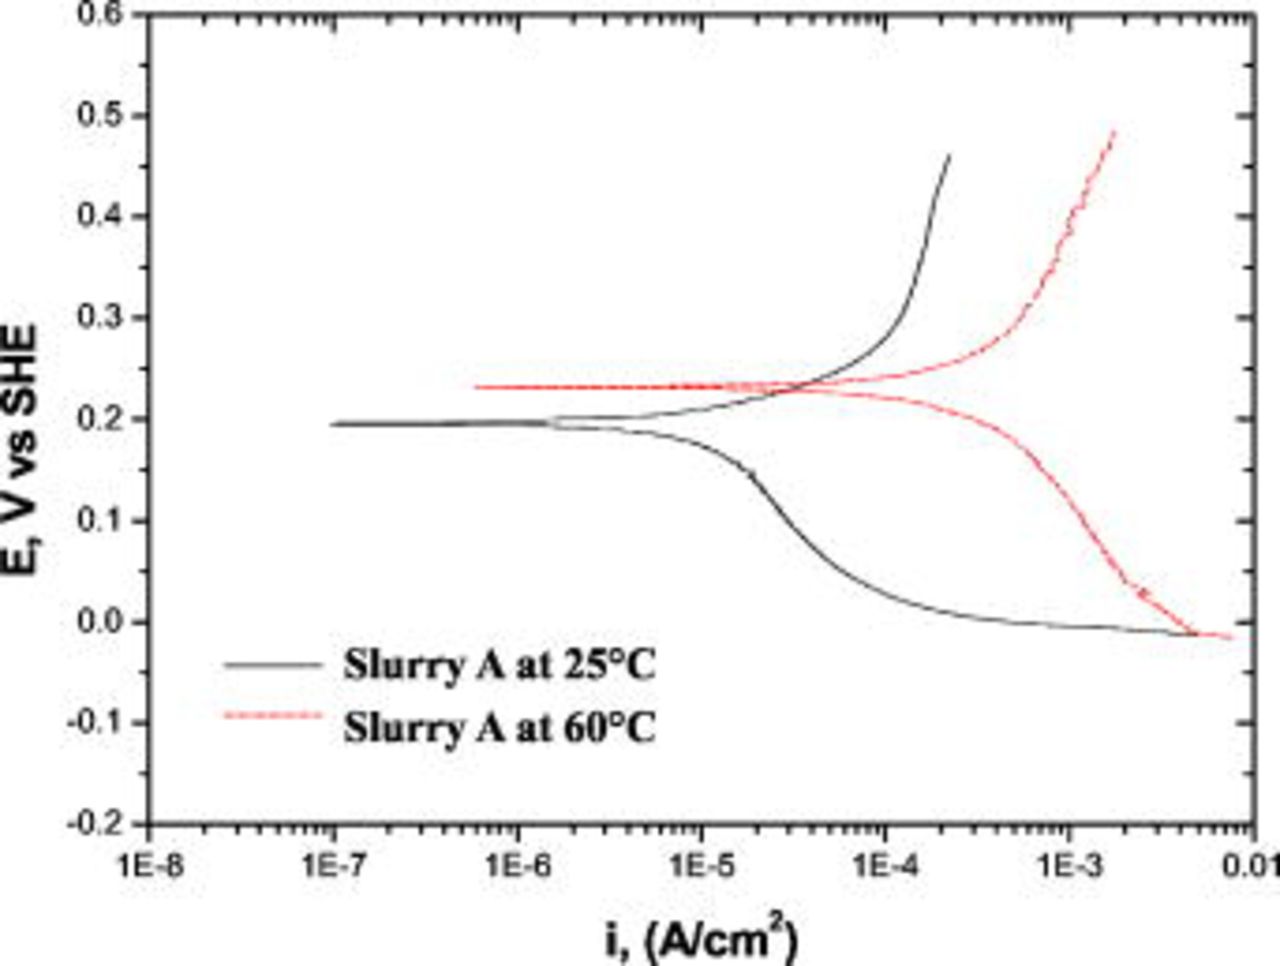
Figure 10. (Color online) Effect of slurry temperature on the polarization behavior of Cu.
Table III. Corrosion potential  and current
 of Cu in slurries of different temperatures.
 (mV) |
 
| |
|---|---|---|

| 196 |

|

| 213 |

|
Conclusions
The stain on the pad can be seen easily after Cu CMP. An EDS analysis showed that the stain was generated due to CMP by-products originating from a reaction between slurry and Cu film during CMP. The by-products were accumulated on pores and grooves of the pad and showed as the stains on the pad during CMP. The removal rate of Cu decreased while the removal rates of TaN and FSG increased as polish by-products remained on pad surfaces during polishing. As a result, the selectivity dropped more than 40%. Nonuniformity deteriorated with the degree of stain because CMP by-products stick to pores and accumulate in grooves on the pad, which interferes with the supply and flow of slurry to the wafer. The erosion and dishing also increased by 50% and 30%, respectively, when wafers were polished on the stained pad.
The increase of erosion and dishing can be explained by the decrease of the selectivity and the increased temperature on the pad. If the selectivity is low, the barrier metal (TaN or Ta) cannot act as a stopping layer and causes severe erosion on the patterned wafer. The higher the temperature on the pad, the faster the etch rate of Cu, causing more dishing and recess. The main reason for higher temperature is the frictional heat generated during CMP. The friction force was proportional to the degree of stain on the pad. The higher temperature caused two orders of magnitude of higher corrosion rate than room temperature.
Acknowledgment
Hanyang University acknowledges the financial support by the Ministry of Education and Human Resources Development (MOE), the Ministry of Commerce, Industry, and Energy (MOCIE), and the Ministry of Labor (MOLAB) through fostering of the project of the Lab of Excellence.
Hanyang University assisted in meeting the publication costs of this manuscript.
