
Abstract
The specific capacity and energy of batteries with  electrodes can be improved by the addition of
 to the cathodes, particularly at high rates.
 is a standard active material used in Li-ion batteries, and
 is a highly stable Li-insertion compound with high electronic and Li-ion conductivity. Batteries with
 and
 cathodes are compared to those with blends of the two active materials when discharged from
 at C/5 and 2C rates. The Li-ion batteries with a

 blend have a disproportionate increase of 25 and 36%, respectively, in their expected specific capacity and energy relative to
 when the batteries are charged and discharged at a 2C rate. X-ray diffraction of the electrodes at a high state of charge confirms that the
 and
 phases remain distinct in the electrodes. Analysis of the discharge curves in combination with electrochemical impedance spectroscopy shows that
 lowers the electrical resistance of the electrodes when combined in parallel with the
 . This simple approach may be used to improve the capacity of Li-ion batteries for high rate applications.
Many commercial Li-ion batteries use  or a partially substituted variation as the insertion material at the positive electrode. These layered structures have chemical and electrochemical stability,1, 2 relatively high capacity of approximately
 , and a discharge plateau of
 . Modern electronic applications increasingly demand more specific energy, motivating researchers to further increase the capacity of
 . Several strategies exist for improving the capacity of
 , such as using a carbon coating to increase electronic conductivity.3 In addition, metal oxide coatings, such as
 , MgO, and
 , and the heating methods used to apply the coatings, can enhance the capacity and capacity retention of
 .4, 5 Also, coating lithium metal oxides with other active insertion materials has resulted in some increase in capacity.6, 7
We are investigating the performance of  when combined with
 because ruthenium oxide and its related compounds have mechanical stability and desirable electrical properties. Hydrous
 is used as an electrode material for electrochemical capacitors because of its high protonic and electronic conductivity.8
 also inserts
 with high Coulombic efficiency but has an IR drop to a voltage plateau of
 .9
 has been shown to improve the capacity of
 10 and
 11 as determined by cyclic voltammetry in half-cells. However, in our laboratory, we have observed that
 mixed with
 also has a large IR drop when assembled in Li-ion cells and cycled at a constant current.
Lithium ruthenium oxides are also attractive for Li-ion battery cathodes because they possess low electronic resistivity and exhibit facile  insertion properties.12
 reversibly intercalates
 with high theoretical volumetric capacity13 and has two separate intercalating phases with voltage plateaus of 3.6 and
 . Despite its monoclinic symmetry,
 is isostructural to the cubic, layered
 and
 compounds.14 Research has shown that lithium ruthenates synthesized by wet chemistry techniques yield inefficient first charge/discharge cycles but then exhibit high capacity retention with cycling.13
In this paper, we show that the advantageous attributes of both  and
 can be leveraged when the two materials are combined in the positive electrode of a battery. The specific capacity of Li-ion and Li-metal cells, having
 and
 positive electrodes, is compared to that of cells containing physical blends of the two active materials. The effects of
 insertion and deinsertion on the crystal structure of the materials, as both single component and in blends, are evaluated with X-ray diffraction (XRD) and electrochemical impedance spectroscopy (EIS). The
 is synthesized in our laboratory, and characterized with scanning electron microscopy (SEM) and XRD.
Experimental
Materials
 was synthesized by mixing commercially available powders of
 and lithium carbonate
 following previously described guidelines.13, 14 Briefly, hydrous
 (Alfa Aesar) was dried at
 for
 to remove structural water. Afterwards, the
 was ground together with an equimolar amount of
 (Alfa Aesar), pelletized, and sintered in air at
 for
 . The pellets were then pulverized using an agate mortar and pestle and sieved to
 . To confirm a consistent synthetic process, each batch of
 was characterized by differential thermal analysis (TGA/DTA; Rheometric Scientific) and XRD (Cu
 radiation; Bruker D8 Advance). The particle morphology was surveyed with SEM (Leo Supra 55). Commercially available
 was used as the standard cathode active material.
Cathodes were made of  ,
 , or
 -rich mixtures of the two. One blend was a 2.3:1.0
 molar ratio (which is approximately a
 mixture) and another was 11.5:1.0 (approximately
 ).
Electrode fabrication
The active materials were formulated into inks using previously developed recipes.15 The cathode inks were a mixture of approximately  active cathode material, 2% Super P carbon (Ensaco), 4% KS6 carbon (Timcal), and 3% polyvinylidene fluoride (PVDF, Atofina). The carbon additives were ground with the active material or stirred in the slurry. The PVDF was dissolved separately in 1-methyl-2-pyrrolidone (NMP, Aldrich) and then combined with the active material/carbon powders to make a viscous ink for efficient deposition. For the Li-ion cells, anode inks were made from 90% mesoporous carbon microbeads (MCMB 25–28; Alumina Trading Co.), 1.5% Super P carbon, and 8.5% PVDF dissolved in NMP. An additional ink was prepared from 10% Super P carbon and 90% PVDF in NMP to serve as a conductive coating and adhesion layer to the current collectors.
The inks were deposited by hand on current collectors of aluminum and copper foils (All-Foils, Inc.) approximately  in area. The foils were pretreated by etching with
 potassium hydroxide and nitric acid solutions, respectively, followed by rinsing with water and then acetone. A layer of the conductive carbon ink was then added to their surfaces. The conductive coating/adhesion layer was dried on a hot plate at the lowest heat setting for approximately
 in order to obtain a homogeneous film. The anode and cathode inks were then spread onto the carbon-coated Cu and Al foils, respectively. The electrodes were subsequently dried again on the hotplate, and then vacuum-dried overnight at
 before transferring to an argon-filled glove box. The electrodes were not calendered or pressed.
Electrochemical investigation
The cathode materials were evaluated in both Li-metal and Li-ion cells at room temperature. The cells with Li-metal anodes were made by pressing the cathodes against a glass fiber membrane and a Li foil using stainless steel rods in a T-shaped polypropylene connector (Swagelok,  ). The liquid electrolyte was dripped onto the glass fiber prior to final assembly. The electrolyte was

 in a mixture of carbonates containing ethylene carbonate, propylene carbonate, ethyl methyl carbonate, and diethyl carbonate.
Li-ion microbatteries, or small packaged cells, were assembled using the procedures described previously.15 The separator, a microporous polymer film (Celgard 2730), was sandwiched between the  /carbon/aluminum and MCMB/carbon/copper electrodes. The cathode/separator/anode sandwiches were first held together by impulse sealing them in a transparent polymer bag (Saranex SX 23-P), followed by sealing in another pouch of a trilayer polyethylene-aluminum-polyester. During the sealing process, small holes were left in the polymer seals to allow electrolyte injection. After the battery was filled with the electrolyte, the pouch was fully sealed. With this packaging process, the Li-ion batteries were protected from ambient air and gently held together with no additional pressure on the electrodes.
The electrochemical testing of Li-ion cells was conducted using a battery tester (Maccor 2300) set to cutoff voltages of 2.0 and  for discharge and charge, respectively, and at constant currents at rates ranging from 2C to C/20, corresponding to current densities of
 . In this paper, we focus on experiments at 2C and C/5 rates, or discharge times of
 and
 , respectively. The test current densities were adjusted according to the total mass of active material(s), and the specific capacities initially measured for

 and

 . The weight of the active materials in the cathodes ranged from
 but had little impact on the electrode appearance and specific capacity. For the blends, appropriate currents were determined by normalizing the weighted averages of the single-component specific capacities.
Impedance measurements were carried out in ambient air on packaged microbattery cells with cathodes containing  ,
 , or

 . The cells were scanned from
 with a
 amplitude ac current using a frequency response analyzer and electrochemical interface (Solartron 1253/1286) controlled by commercially available software (ZPlot, Scribner). Cells were then discharged and charged at 2C or C/5 currents, with the cycles periodically interrupted for additional EIS measurement between 4.0 and
 . Circular fits were applied to the curves of relevant data points, and resistance values were calculated using Zplot. The circular fits of the data were chosen based on an optimization of the tradeoff between the maximum number of data points and the minimum deviation of the fit from the data.
Materials characterization after cycling
XRD was used to check for any cycle-based structural changes in the various blends and single-component cathodes in the metallic Li cell due to cycling. The cells were cycled five times, charged, and then slightly discharged to  , where they were held for
 to monitor any unexpected voltage drops. The deintercalated cathodes were then removed from the metallic Li cell while still in the glove box and clamped between Kapton sheets in a holder for the diffractometer. The encapsulated cathodes were then removed from the glove box and analyzed in the XRD with low resolution scans, using a step size of 0.01°
 and a step time of
 .
Results
The XRD of our synthesized  is shown in Fig. 1 and matches well to the JCPDS pattern for
 (no. 85–2000) as well as patterns in the literature.16, 17 The monoclinic structure of
 and the ordered nature of its
 planes have been used to explain the high reversibility of
 insertion into
 .14
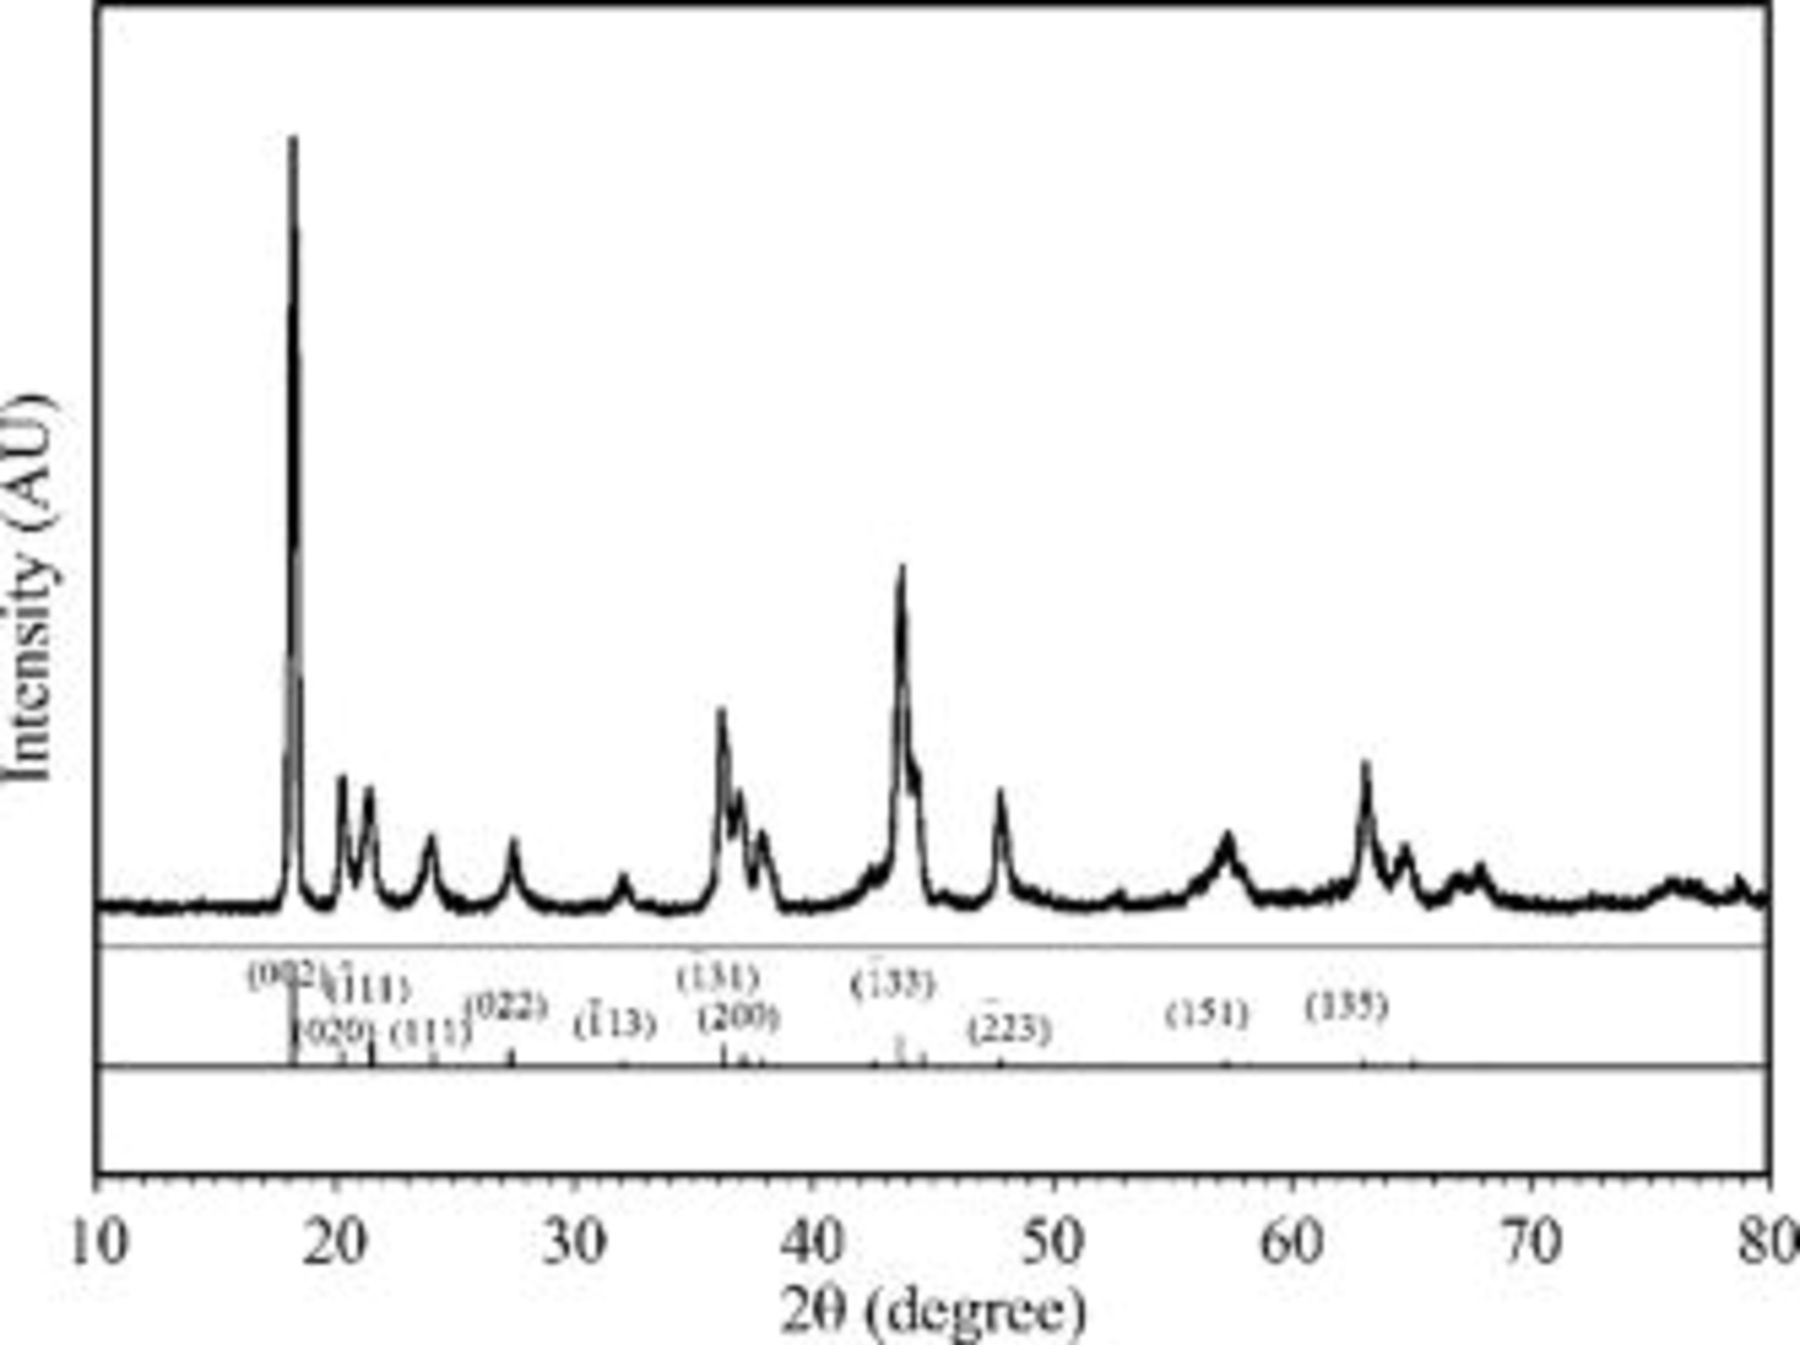
Figure 1. Powder XRD pattern of  . The indices of the JCPDS pattern for
 (no. 85–2000) are shown by annotation.
The scanning electron micrographs for  and
 are shown in Fig. 2a and 2b, respectively. The
 features
 particles in
 agglomerates while the
 has
 particles in
 agglomerates. The comparable sizes of the two compounds should foster intimate contact with each other and the carbon while allowing for electrolyte accessibility.
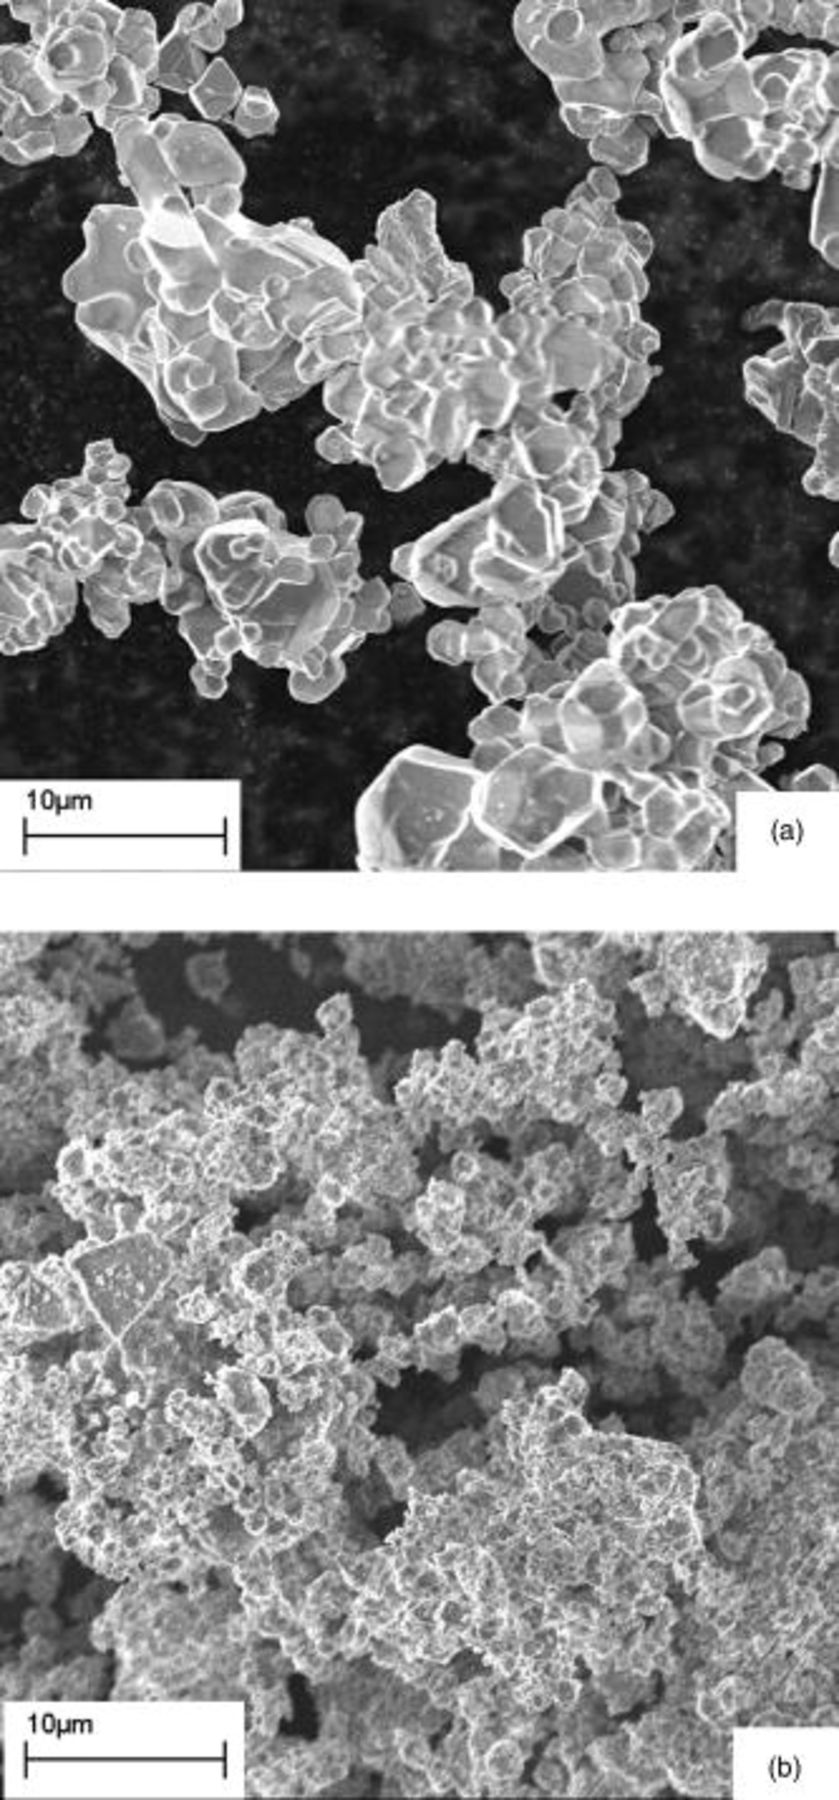
Figure 2. Scanning electron micrographs at  of (a) commercially available
 and (b)
 prepared by heating
 and
 .
The second and third cycles at a C/5 rate are shown for the four different cathodes vs Li metal in Fig. 3 as a function of specific capacity. Their specific capacities (mAh/g) and specific energies (mWh/g), as derived from the second cycle discharge curve, are reported in Tables I and II. The  has a single plateau at approximately
 on charge and
 on discharge (Fig. 3a), values consistent with the literature. The charge-discharge curves for the
 in Fig. 3b are similar to those previously described with plateaus at 3.4 and
 on charge and 3.4 and
 on discharge.14 These data also support prior observations that, while
 has a lower voltage plateau, it has a higher specific capacity than
 . As determined from the second discharge from
 , the specific capacities are
 for
 and
 for
 .
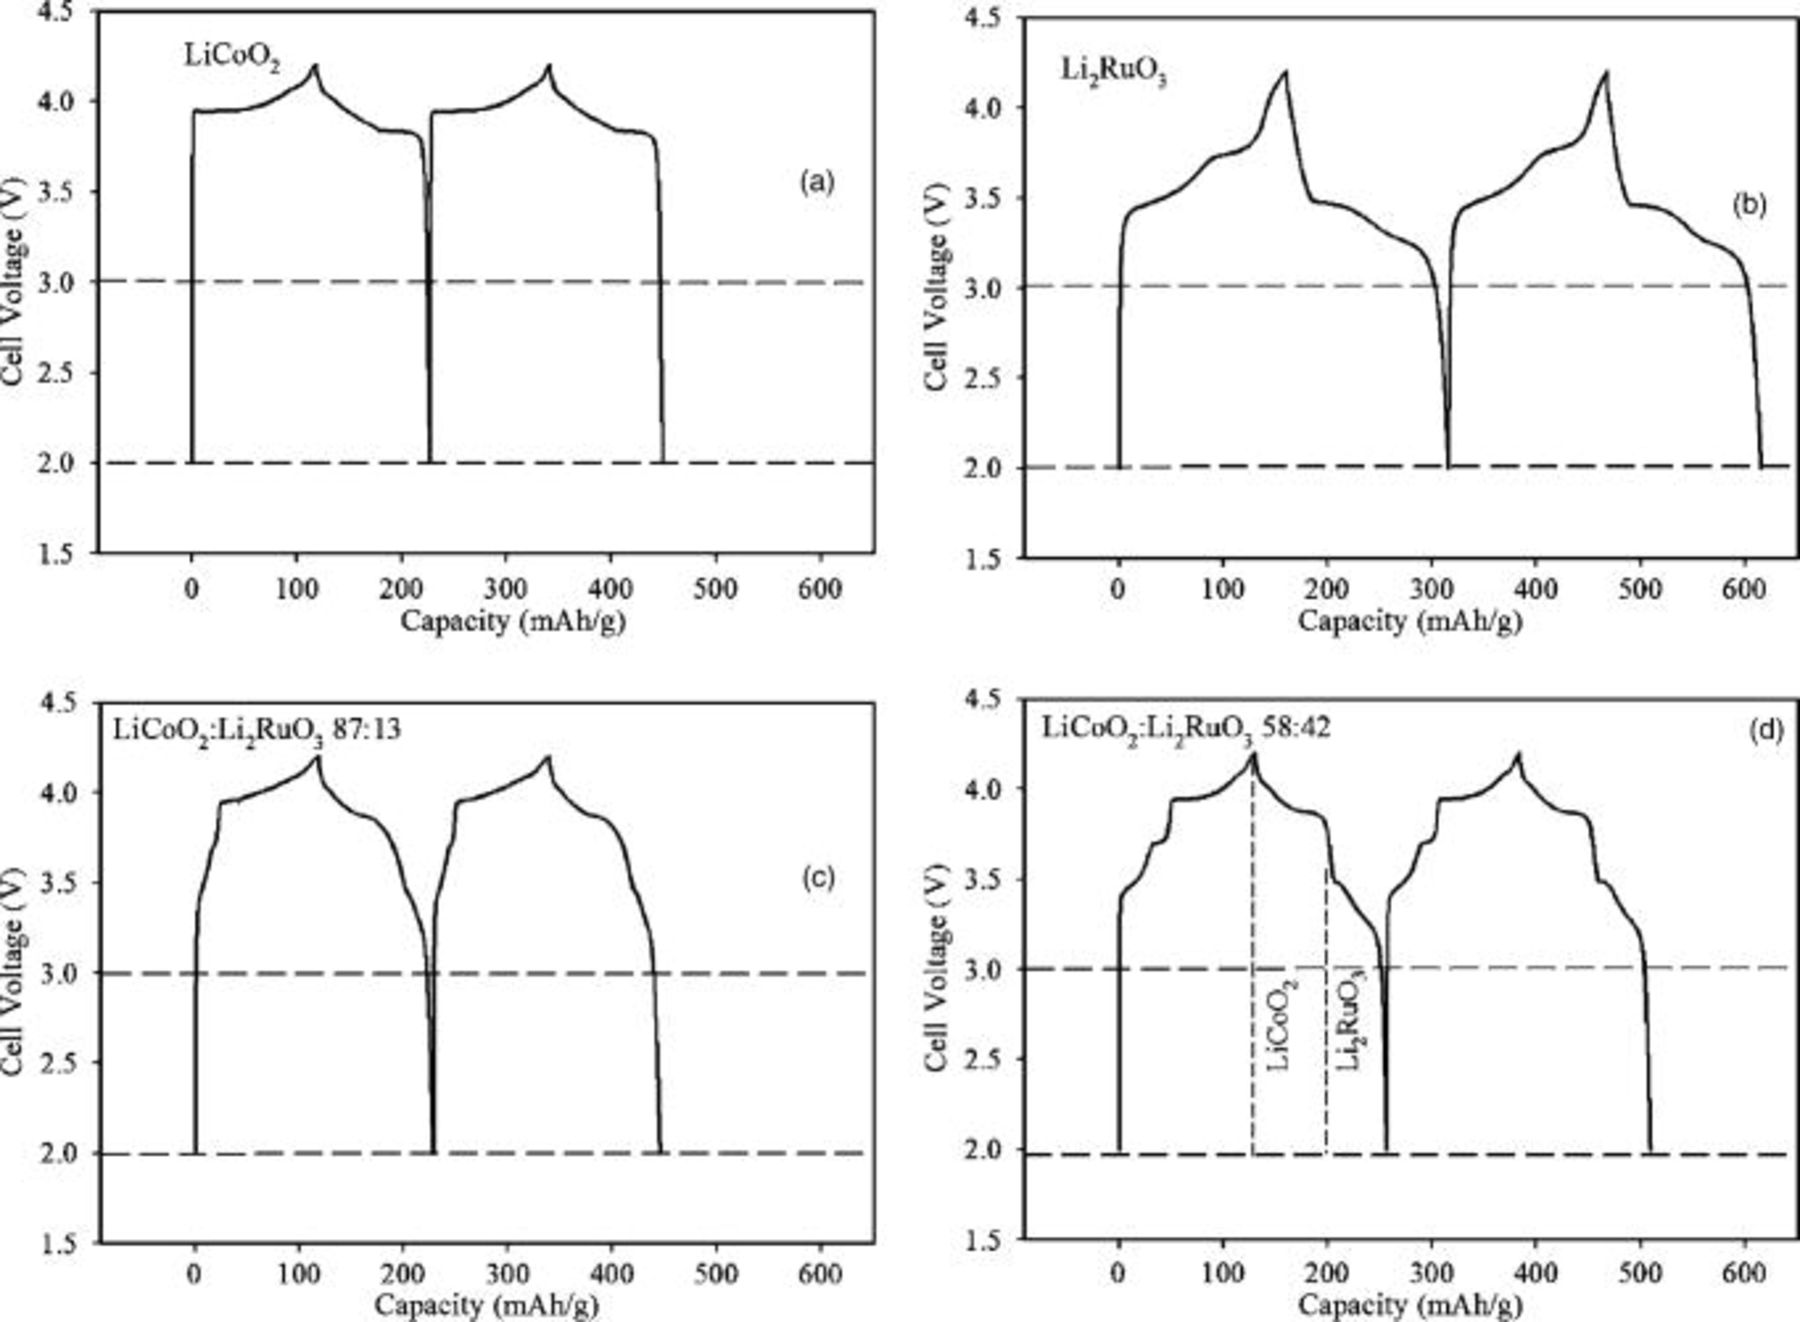
Figure 3. Second and third charge-discharge cycles for positive electrodes in metallic Li cells cycled between 2.0 and  at a C/5 rate. The composition of the active material in the cathode is varied: (a)
 , (b)
 , (c)

 and
 , and (d)

 and
 .
The Li-metal cells with physical mixtures of the  and
 (Fig. 3c and 3d) have discharge plateaus at both 3.8 and
 , reflecting a combination of the characteristic plateaus exhibited by each compound. However, analysis of the data indicates a 3–6% increase in capacity over the weighted average of the single-component specific capacities. That is, instead of the expected
 , the 87:13 mix has a specific capacity of
 at C/5 and similarly
 instead of
 for the 58:42 mix; the experimental error is 2% (Table I).
Table I. Capacities measured from the second discharge cycle of Li-metal and Li-ion cells with different cathode compositions at C/5 and 2C rates.
| Cathode | Li-metal C/5 capacity (mAh/g) | Li-ion cells C/5 capacity (mAh/g) | Li-ion cells 2C capacity (mAh/g) |
|---|---|---|---|

|

|

|

|
87:13 
|

|

|

|
58:42 
|

|

|

|

|

|

|

|
Table II. Specific energies calculated from the second discharge cycle of Li-metal and Li-ion cells with different cathode compositions at C/5 and 2C rates.
| Cathode | Li-metal C/5 specific energy (mWh/g) | Li-ion cells C/5 specific energy (mWh/g) | Li-ion cells 2C specific energy (mWh/g) |
|---|---|---|---|

|

|

|

|
87:13 
|

|

|

|
58:42 
|

|

|

|

|

|

|

|
The performance of the cathodes in Li-ion cells (Fig. 4) shows a similar trend with  content as seen at C/5 with the cathodes in the Li-metal cells, exhibiting a greater discharge capacity with increasing amount of
 in electroactive materials. As in the Li-metal cells, the discharge profile of the Li-ion cells with 58:42
 cathode appears to be a superposition of the discharge curves of the two different active materials. Additionally, as in the Li-metal cells, the capacity of the 58:42 blend is approximately 4% higher than expected from the weight-normalized capacities of the active materials.
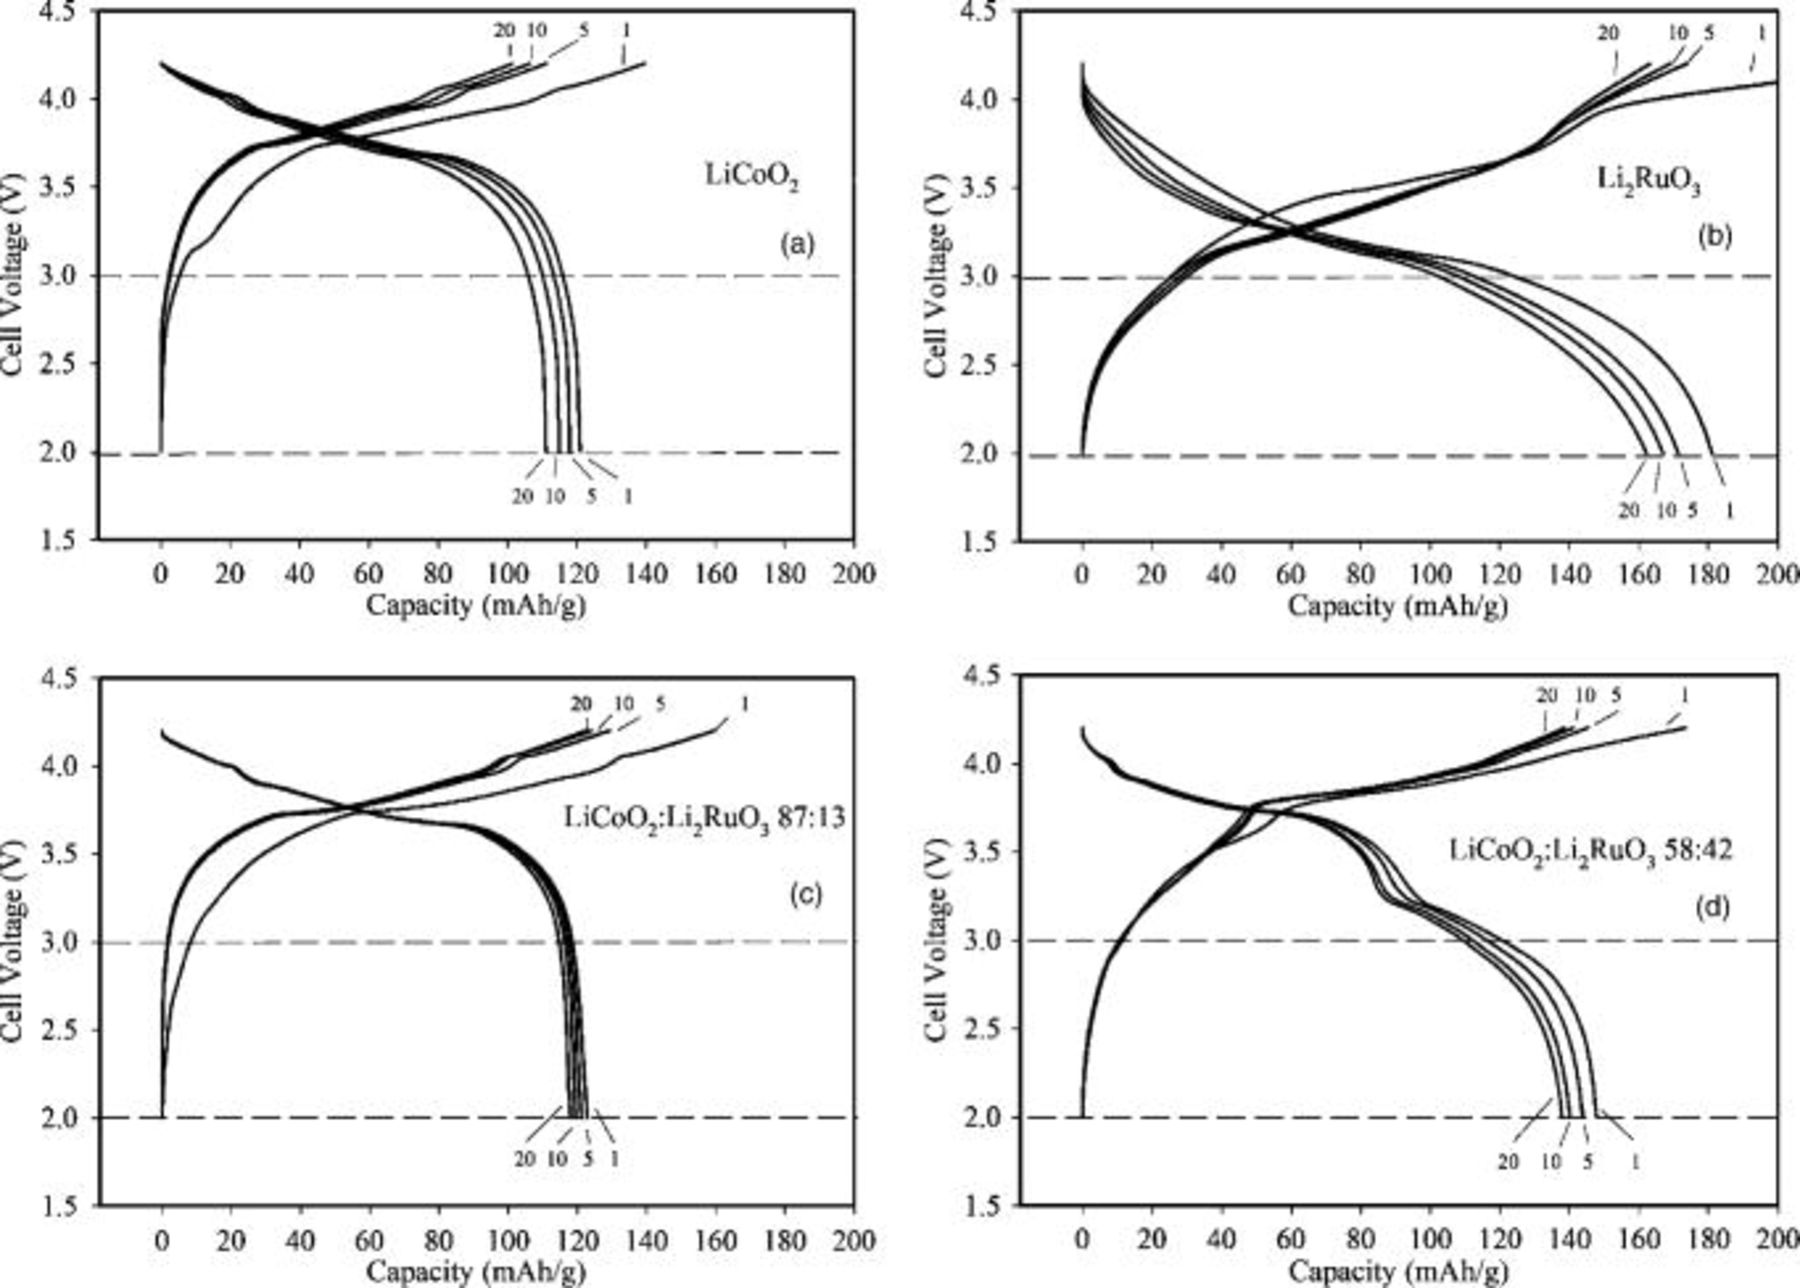
Figure 4. Charge-discharge characteristics for cycles 1, 5, 10, and 20 of Li-ion cells at C/5 rate and electrodes containing (a)  , (b)
 , (c) physical mixtures of

 and
 , and (d)

 and
 .
When current is increased from a C/5 to 2C rate, the loss of capacity and energy of the 58:42 blend is not as high as in the case of single-component electrodes, as shown by the data in Fig. 5 and Table I. The  has a discharge capacity of approximately
 at the fifth cycle. The
 starts with a discharge capacity of
 , but then it increases to
 with subsequent cycles. The 87:13 mix has a capacity of
 . However, the discharge capacity at 2C for the 58:42 mix
 is
 , which is not only greater than the weighted average of the specific capacities but is also greater than the discharge capacity of the single-component
 . In contrast, at C/5 rates, neither of the
 blends in Fig. 4c and 4d exceeds the
 capacity in Fig. 4b. A small addition of
 to the cathode recipe, as demonstrated by the 87:13 mix, results in a slight increase in specific capacity over
 for both cycling rates, 93 vs
 at 2C as in Fig. 5c and 5a, and also 123 vs 120 at C/5 as in Fig. 4c and 4a. The specific capacity increase with the 87:13 blend is slightly higher at 2C than the C/5 rate.
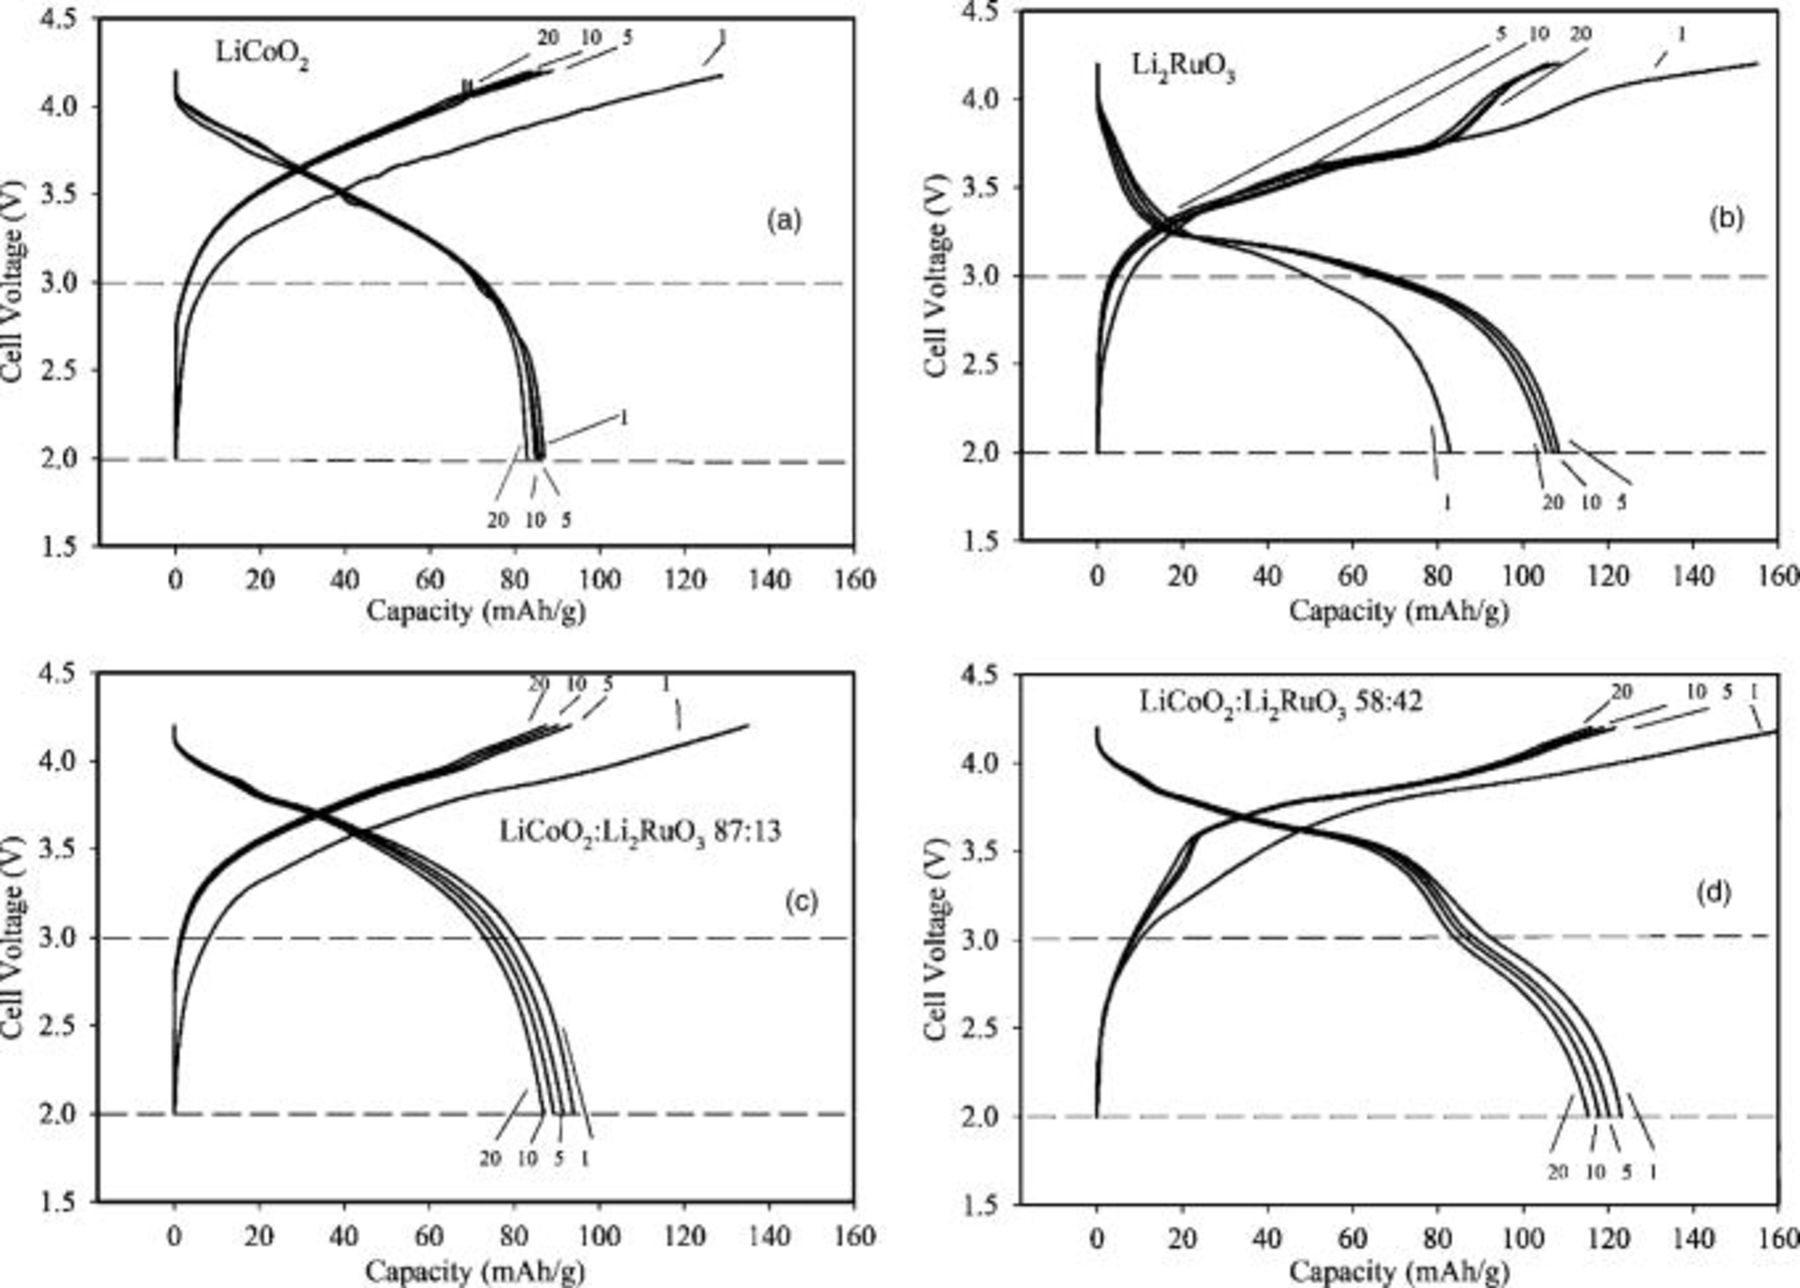
Figure 5. Charge-discharge characteristics for cycles 1, 5, 10, and 20 of Li-ion cells at 2C rate and electrodes containing (a)  , (b)
 , (c) physical mixtures of

 and
 , and (d)

 and
 .
The results of the  58:42 blend indicate that the
 component makes a greater contribution to capacity at the 2C rate than at the C/5 rate. The contribution of
 to capacity therefore depends on cycling rate. The improvement in capacity at this high rate can be observed visually in Fig. 6, which overlays the fifth discharge cycle for the four different electrodes and clearly shows that the 58:42 blend combines the high discharge voltage of the
 with the high capacity of the
 .
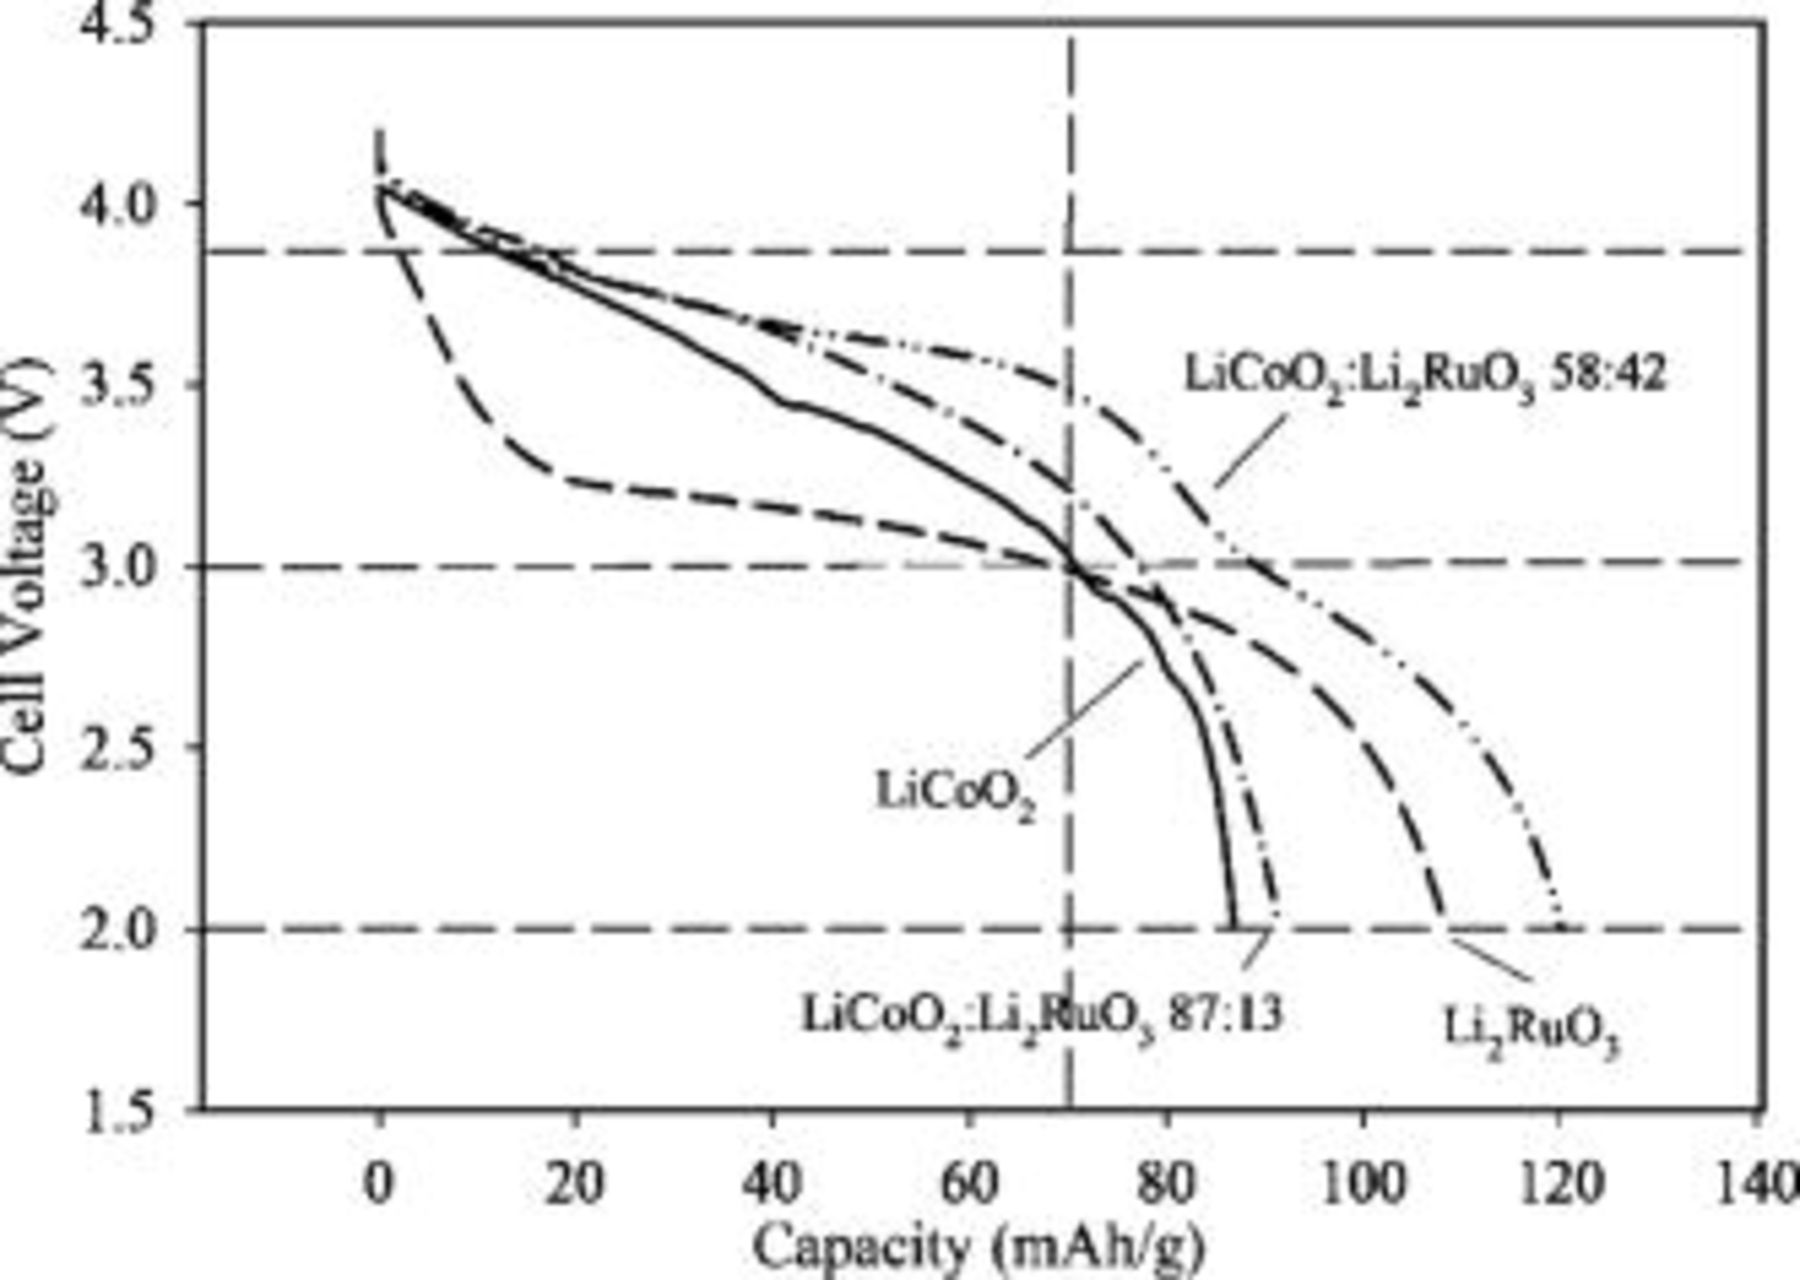
Figure 6. Fifth discharge profile of Li-ion cells at 2C rate with cathodes containing  (solid line),
 (dash), physical mixtures of
 and

 (dash dot), and
 (dash dot dot). Dashed lines are provided for 3.87, 3.0, and
 and
 as a guide for the eye.
The predicted and measured values for the specific energy and capacity are depicted by graph in Fig. 7. A linear increase in the normalized capacity of the cathodes is anticipated with the addition of the higher capacity  to the
 . However, the capacity (Fig. 7a) and specific energy (Fig. 7b) of the 58:42 mixture are disproportionately large when the batteries are cycled at the 2C rate.
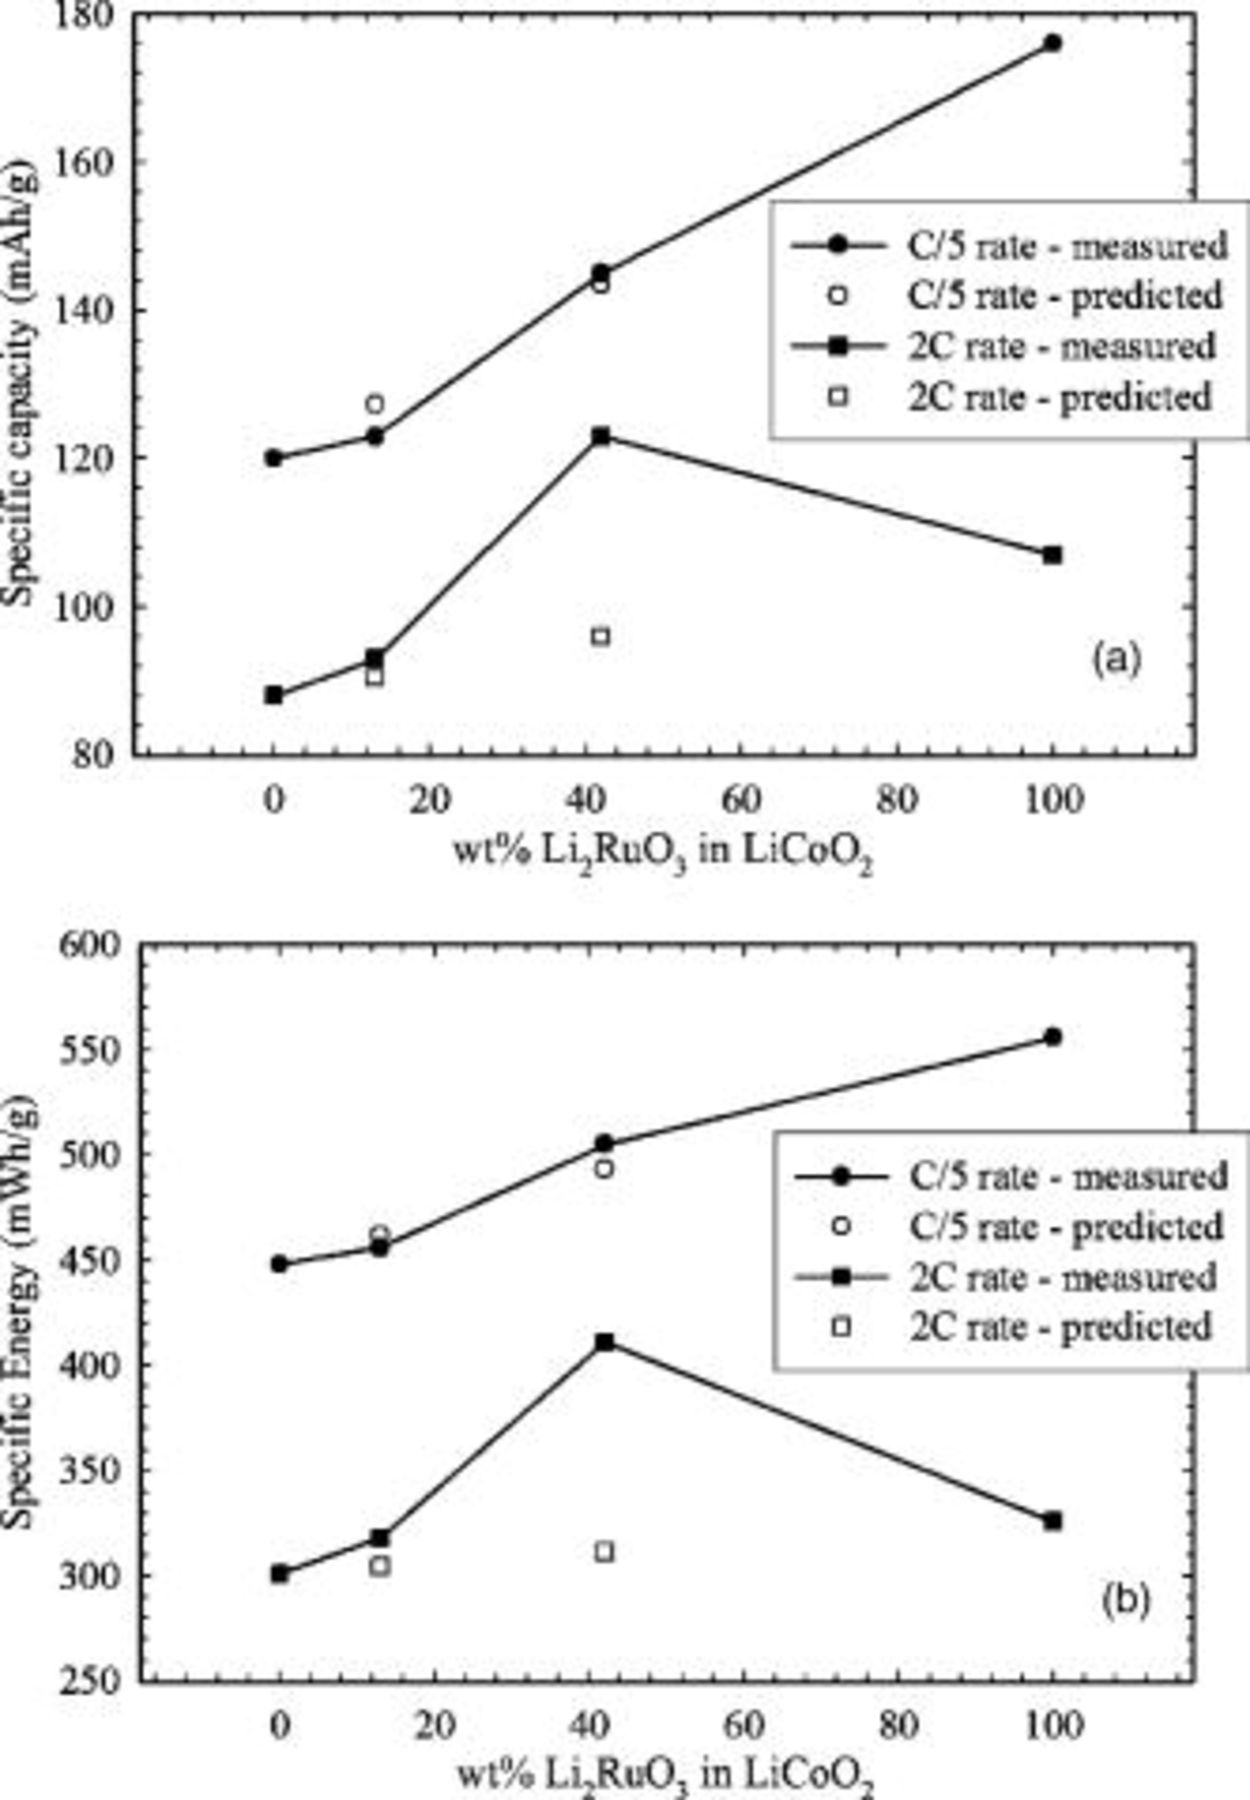
Figure 7. (a) Specific capacity and (b) specific energy of Li-ion cells cycled at C/5 and 2C rates as a function of  wt % in composite electrodes with
 . The predicted values are calculated from the weighted fractions of the specific capacities and energies of the pure materials.
The impedance spectra in Fig. 8 show that the charged batteries with  electrodes have higher impedance than those with
 or the 58:42 blend. The curvature is smaller in the case of
 than those of the
 and
 cathodes, indicating a higher resistance. This same trend is observed when the battery impedance is tested at 3.8 and
 .
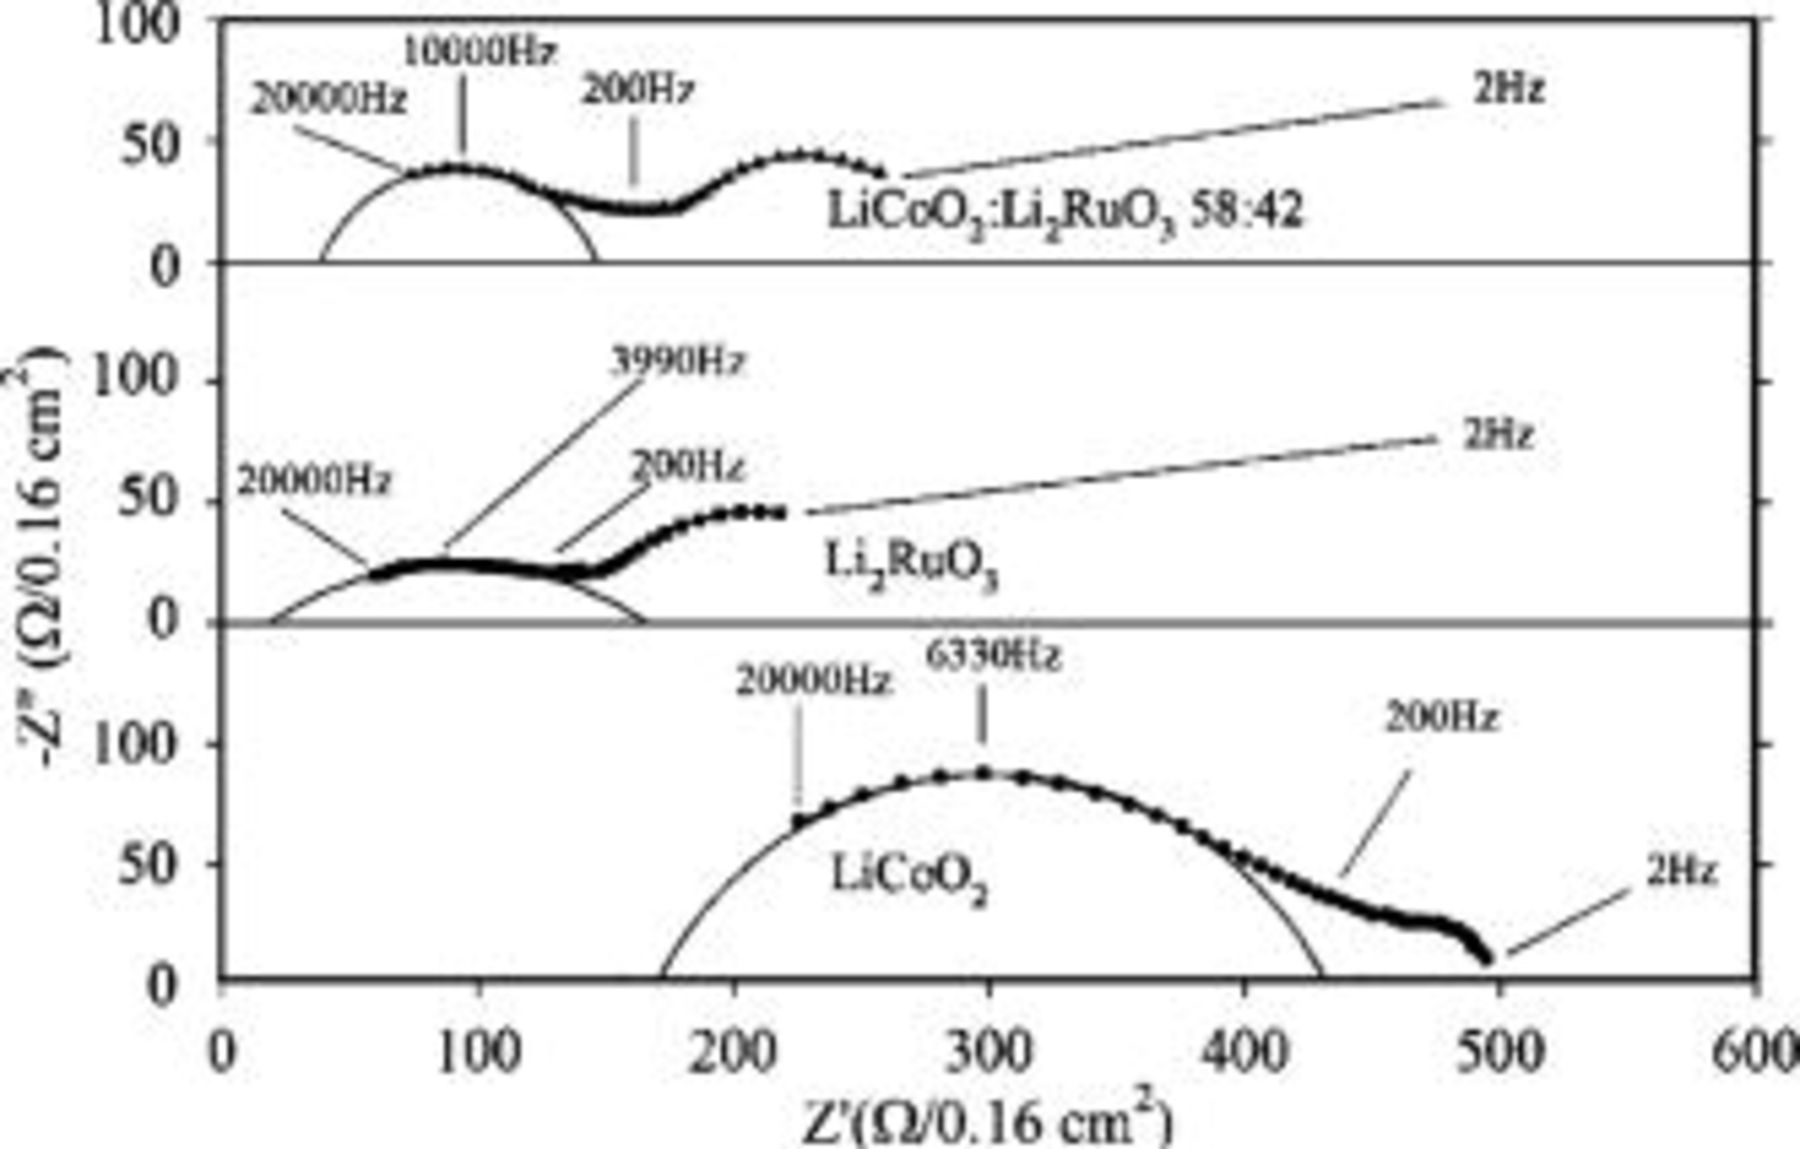
Figure 8. Impedance spectra for Li-ion cells charged to approximately  with cathodes comprising single-component
 (circles),
 (squares), and a

 and
 (triangles). Circular fits are shown for comparison.
Expanded views of the XRD patterns of as-prepared and charged cathodes are shown in Fig. 9. The deintercalated electrodes of  in Fig. 9a exhibit the expected shifts in the
 peaks from 45.1 to 45.5°
 due to the change in the (104) reflection.18 Changes to the
 structure, indicated by additional peaks near 40° in Fig. 9b, are also consistent with those previously reported.14 The rearrangement from cubic close-packed to hexagonal close-packed structures has been attributed to lithium deintercalation from the all-lithium layer of occupied octahedral sites, and is exhibited in the appearance of the (202) peak at 44.6°
 . The data in Fig. 9c and 9d show that the same peak changes present in the single-component
 and
 cathodes upon deintercalation are also present in the composite electrodes, suggesting that there is no physical interaction between the two phases as a result of charging and discharging. That is, the respective electrochemical
 insertion processes have similar effects on the structure of each material whether as a mixture or as a single component. We therefore view these electrochemical processes as distinct.
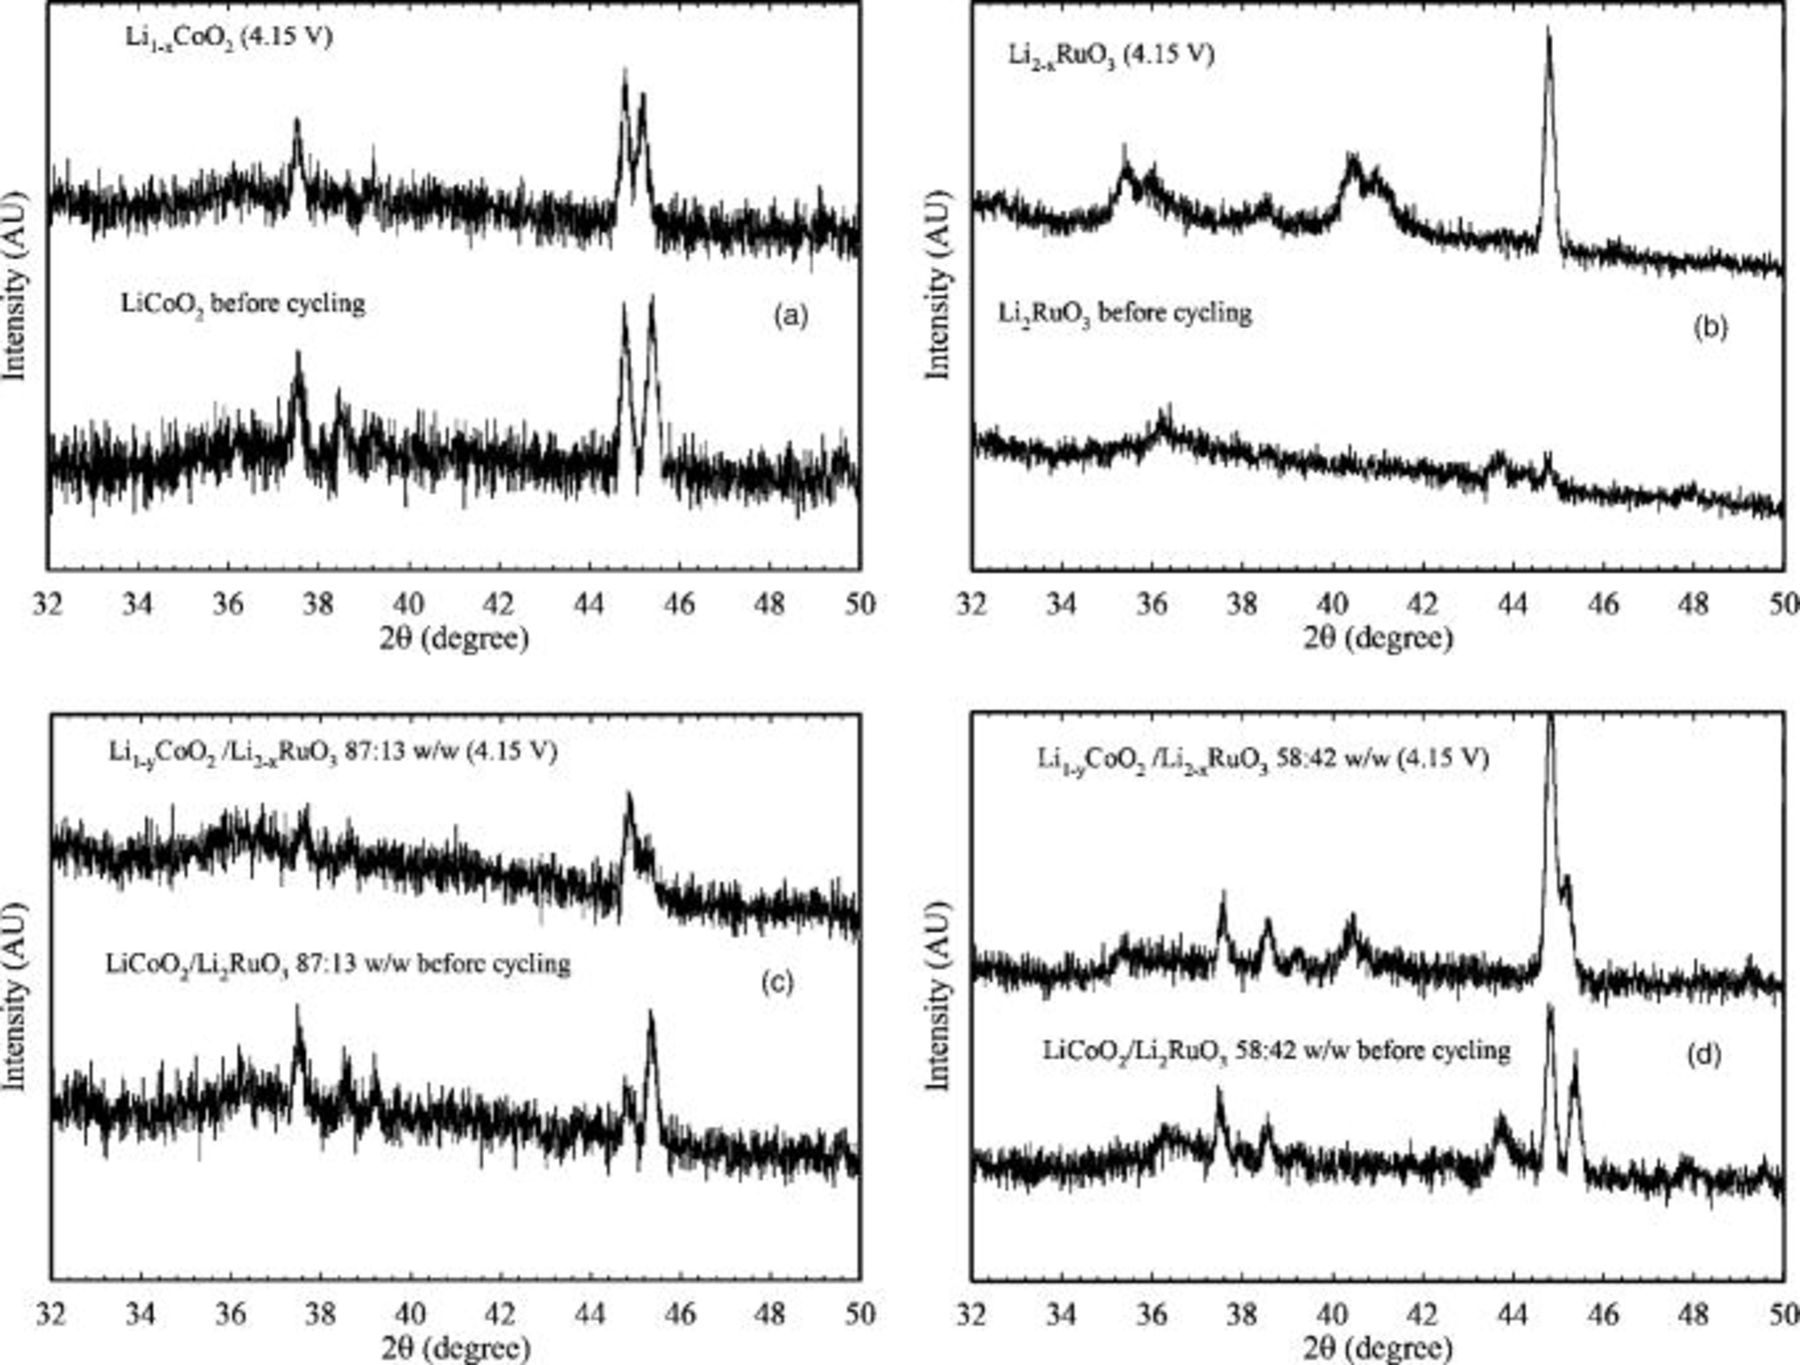
Figure 9. XRD patterns of Kapton-encapsulated electrodes before cycling (bottom) and at  (top). The represented electrodes all contain carbon, PVDF, but different active materials: (a)
 , (b)
 , (c)

 , and (d)

 .
Discussion
The addition of 
 to
 results in a disproportionate increase in specific capacity and specific energy of
 , particularly at 2C rates. The benefit of adding
 to
 is clearly displayed when the specific energy is calculated from integration of the discharge curves, where an expected improvement in capacity
 is observed at a C/5 rate (Fig. 4d) due to the higher capacity of the
 . The discharge profiles of the electrode comprising the 58:42
 blend simply appear to be a combination of the
 and
 electrodes. An unexpected 40% increase in capacity is measured at a 2C rate (Fig. 5d), and the
 significantly affects the discharge profiles of
 electrodes at this rate, as illustrated in Fig. 6. The
 plateau is seen in the 87:13 blend, and is pronounced in the 58:42 blend. The extended voltage plateau results in the high specific energy calculated for the 58:42 blend vs
 (411 vs
 ). Also, the specific capacity of the
 component at the
 plateau of the 58:42 blend does not vary appreciably with cycling rate and is near
 for the C/5 and 2C rates (Fig. 4d and 5d).
We considered a chemical interaction between the  and
 as the source of the anomalies in the capacities, but we rejected such a mechanism, because 1. the XRD shows no evidence of changes to the materials structure when they are in the blended electrodes, and 2. the capacity increases with decreasing discharge time, following the opposite trend to that expected from kinetics.
We therefore propose that the increased capacity of the blended  cathode is due to the lower resistance of the
 ; the resistivity of
 is
 12 and that of
 is between 1000 and
 .19, 20 We explore this hypothesis first by modeling the composite cathode as two resistors in parallel. The actual cell voltage is the difference between the open-circuit potential or redox voltage and the sum of the activation polarization, concentration polarization, and IR loss. Assuming the IR loss contributes the most to the difference between real and ideal open-circuit potential, internal IR losses can be determined from the discharge profiles and by impedance spectroscopy.
First, in the discharge profiles, the resistance is calculated from discharge curves via Ohm’s law using the discharge current and the difference between the actual and ideal cell redox voltages. An ideal cell voltage of  is used for the
 -containing compounds because it is considered the redox potential for
 insertion in
 determined by differential capacity.21 A value of
 is used as the ideal cell voltage for the
 . However, this applies only to a low state of charge such as beyond
 because a second higher voltage plateau at 3.6 had been reported for discharge to less than
 .14 The voltage of the actual cells is determined from the discharge curves at a selected capacity of
 in Fig. 6. The resistances of the single-component electrodes are calculated directly from the differences between the actual and ideal voltages, and the resistance of the blends is calculated from Eq. 1 for parallel resistors

The weight percent of the materials is an adequate approximation because the densities of the oxides are similar. The blend has 58%  , and substituting the proportions by weight gives

From the data in Fig. 6, at  , the voltage drops on the curve are calculated from
 for
 and the blend and from
 for
 (Table III).
Table III. IR loss  in batteries with cathodes of
 ,
 , and 58:42
 after discharging to
 (data extracted from Fig. 6), and resistance of the batteries as measured by EIS.
| Active material |

|

|

| Current 
| IR loss 
|
 from impedance 
|
|---|---|---|---|---|---|---|

| 3.87 | 3.06 | 0.81 | 125 | 6530 | 270 |

| 3.4 | 2.99 | 0.41 | 360 | 1140 | 154 |
 58:42 | 3.87 | 3.48 | 0.39 | 205 | 1880 | 111 |
The assumption that the  and
 serve as resistors in parallel in the blend is supported, as the IR loss
 values for
 and
 in Table III yield a weighted resistance average of
 , which is within 14% of the actual value of
 measured from the voltage plateau of the blend

The materials are compared at a discharge capacity of  because the
 component of the blend is still a contribution to the IR, and the relevant value of
 used for
 in the calculations has validity. For selected capacities closer to the cutoff of
 for
 , the discrepancy between calculated and measured resistances (using tabulated values from the discharge curves as in the method demonstrated in Table III and Eq. 2) is even smaller than for
 . For example, with
 the discrepancy between the calculated and measured resistance of the blend is only 6%.
The resistance values were also measured for the  ,
 , and 58:42 blend by EIS and are reported in Table III. In EIS of two-electrode cells, the curvature of the first impedance arc can provide information about charge‐transfer resistances while the high-frequency point of the arc is due to ohmic resistance. Thus, the EIS studies can be used as a comparison for the different electrodes in this study.
As above, from the resistances measured from EIS  for
 and
 and using a weighted average, we predict a resistance of


which is nearly double the measured value of  The resistance of the blended cathode is clearly lower than that of the single-component electrodes, as determined both from the IR drop of the discharge curves and from EIS, thereby confirming that the two materials serve as a parallel combination of Li-ion insertion materials. The discrepancy between the measured and calculated resistances from EIS is likely a result of measuring impedance on full cells, which makes it difficult to isolate the contribution of the cathode. Still, it is a direct comparison to similar cells used in other methods of characterization in this paper.
The model for parallel resistors is further supported by the observed increase in the capacity with increasing  content of the electrodes. The 87:13 blends of
 and
 show a smaller response to increased rate than the 58:42 blend, presumably because the concentration of
 is below the volumetric percolation threshold for connectivity throughout the electrode. This helps explain the 87:13 blended cathodes having only a slightly greater specific capacity than pure
 . The 58:42 blend has enough of both the
 and
 for the resistors to exist in parallel, resulting in a significant change of a observed capacities.
Because the effect reported in this study relies on optimization of percolation networks or connectivity, it is likely that adjustments to the materials’ particle size, morphology, and their relative concentration (or volume) can be made to further improve the performance of the electrodes. The use of nanoparticles in the blends may also improve the performance as ionic conductivity can increase with decreasing particle size, although the electronic conductivity may decrease;8 further experimentation would be needed to determine whether the ionic or electronic resistivity is the most important factor affecting the IR drop and impedance. Although  may be acceptable for applications requiring small amounts of active material, such as microbatteries, its benefit might not be economically viable for large batteries due to the high cost of ruthenium. It may be valuable to use the approach by Kobayashi et al. and Moore et al. to assess other lithiated transition metals, such as Mn, Ti, Sn, Zr, or Mo, which are structurally equivalent to
 .12, 13 Care must be taken to select combinations with a redox potential greater than
 , so that the
 structure is not stressed by discharge to low voltages.
Conclusions
In this paper, we have demonstrated the enhancement of the specific capacity and energy of batteries by the addition of  to
 , particularly at high cycling rates. This effect is observed even though the materials are utilized discretely in the cells and have no apparent chemical interaction. We show from the IR losses in the discharge profiles and impedance spectroscopy that the blended electrodes are effective because their parallel combination lowers the cell resistance, which decreases the IR drop and increases the capacity.
Although  may not be a practical material for large batteries, it may be useful for microbattery applications, in which its high cost will have little impact. Furthermore, microbatteries are typically sought for microdevices, and having a battery with the capability to perform well at high rates may allow the use of a single battery vs a battery/capacitor combination.
In summary, this paper shows that the simple mixture of two active materials in a cathode can have a significant impact on the resistive properties, discharge voltage, and specific capacities of batteries.
Acknowledgments
The authors are grateful to the Office of Naval Research for support of this research. A.M.S. is a National Research Council postdoctoral fellow.
Naval Research Laboratory assisted in meeting the publication costs of this article.
