
Abstract
To boost MOS transistor performance, thickness of the gate dielectric is continuously scaled down. This results in an increase of gate tunneling leakage current, which at some point prevents further downscaling. Desired parameters of alternative materials to  are a higher dielectric constant (high-k materials), stability, and compatibility with silicon. A general observation for one of the prime candidates,
 is formation of an interfacial layer between the silicon and the high-k material that limits scalability because of its low k-value. Hence, a thorough study of the formation of this layer and its contribution to the equivalent oxide thickness is of utmost importance. We studied the composition and growth kinetics of the interfacial layer formed during the deposition of
 by metallorganic chemical vapor deposition using
 and tetrakis-diethylamidohafnium as precursor. We found the composition and thickness of the interfacial layer to be dependent on the deposition parameters as well as on the starting surface. The layer’s composition is hafnium silicate-like and its thickness increases as a function of deposition time and temperature. It is therefore controlled by deposition of the
 layer. © 2004 The Electrochemical Society. All rights reserved.
 has been used for decades as the gate isolator material in complementary metal-oxide semiconductor (CMOS) technology. Downscaling of the gate dielectric to improve device performance is reaching physical limits where the gate material consists of only a few atomic layers, resulting in unacceptably high leakage currents.1 Reducing the leakage current through nitridation prolongs the lifespan of
 2 but according to the International Technology Roadmap for Semiconductors (ITRS), industry will from 2005 on abandon
 as a gate material and start replacing it with materials having a higher dielectric constant (high-k materials).3 The urgent need for these new materials has resulted in extensive research on several high-k candidates, such as


 etc. At present, Hf-based materials are the most likely candidates.
Si and  as a gate material are chemically perfectly compatible, which was, among others, one of the reasons for choosing Si and for the success of the silicon semiconductor industry. For high-k materials possible interactions between Si (both substrate and polySi electrode) and the high-k material are an additional concern needing to be addressed. For example, these interactions can result in silicide formation at the high-k/polysilicon interface, as has been observed for
 4
In addition, there is also an important difference in processing; whereas  as gate dielectric is grown simply by oxidation of the silicon substrate, high-k materials have to be deposited. Such deposition is not straightforward and it has been found that the deposition behavior of a high-k layer can be highly dependent upon the starting surface.5 Moreover, we have observed that metallorganic chemical vapor deposition (MOCVD) of
 on various starting surfaces results in the formation of an interfacial layer (IL) underneath the high-k layer, which obviously influences device performance. Furthermore, if this IL becomes too thick, the 1 and sub-1 nm equivalent oxide thicknesses (EOTs) targeted in the ITRS roadmap cannot be reached. Therefore, a very thorough characterization of the composition and growth kinetics of this IL as well as its impact on the
 growth behavior and electrical performance is vital.
In this paper we focus on the composition and growth kinetics of the IL as a function of various MOCVD deposition process parameters such as starting surface, deposition time, and temperature. The IL after deposition was studied with X-ray photoelectron spectroscopy (XPS) and time of flight secondary ion mass spectroscopy (TOF-SIMS).
Experimental
The  layers were deposited in an Applied Materials high-k MOCVD deposition chamber (based on the Tanox™ chamber). All
 layers were deposited on 8 in. Si(100) blanket wafers. The wafer surface was prepared in three different ways: (i) the native oxide was stripped in a 2% HF solution, resulting in a H-passivated Si surface; (ii) a wet chemical oxide was grown after an HF dip by means of an
 (DI)-based clean (IMEC clean);6 and (iii) a 1 nm thick
 layer was grown after an HF dip by rapid thermal oxidation (RTO). The
 layers were deposited by MOCVD using a liquid precursor [tetrakis-diethylamidohafnium (TDEAH)] and
 The deposition temperature was varied between 300 and 600°C.
The thickness and composition of the IL between the silicon substrate and the  layer were analyzed by means of XPS using a SSX-100 spectrometer using monochromatized Al Kα radiation (1486.6 eV) and a take-off angle of 35°. The samples were measured immediately after deposition to avoid possible effects of cleanroom air exposure (additional oxidation at the interface, especially for the thinnest layers). TOF-SIMS profiles were measured with an IONTOF IV instrument in the dual-beam configuration. The positive ion profiles were measured in the Ar (10 keV)-Ar (500 eV) configuration and the negative ion profiles were measured in the Ga (15 keV)-Xe (500 eV) configuration.
Results and Discussion
Interfacial layer composition.—
To study the influence of the starting surface on the composition of the IL, we deposited a  layer on three different types of starting surface: an H-passivated (HF-last), a dry oxide (1 nm RTO) and a wet chemical oxide
 IMEC clean). The
 layers were deposited with a fixed deposition time and temperature, 60 s and 485°C, respectively. This results in a layer thickness of approximately 4 nm, which allows XPS to probe the IL. Figure 1 shows the Si 2p XPS spectra recorded after the
 deposition on these three starting surfaces. For comparison, the spectra for a 1 nm RTO [binding energy
 and a Hf-silicate film with 66/34
 composition
 are included. Samples with compositions ranging from 78/22 to 46/54
 did show identical positions for the Si 2p and Hf 4f peaks, making the spectrum of the 66/34 sample representative for a Hf-silicate sample in this range. No substrate peak is visible for the Hf-silicate sample because of its thickness. The BE scale was fixed by setting the position of C 1s at 284.6 eV.
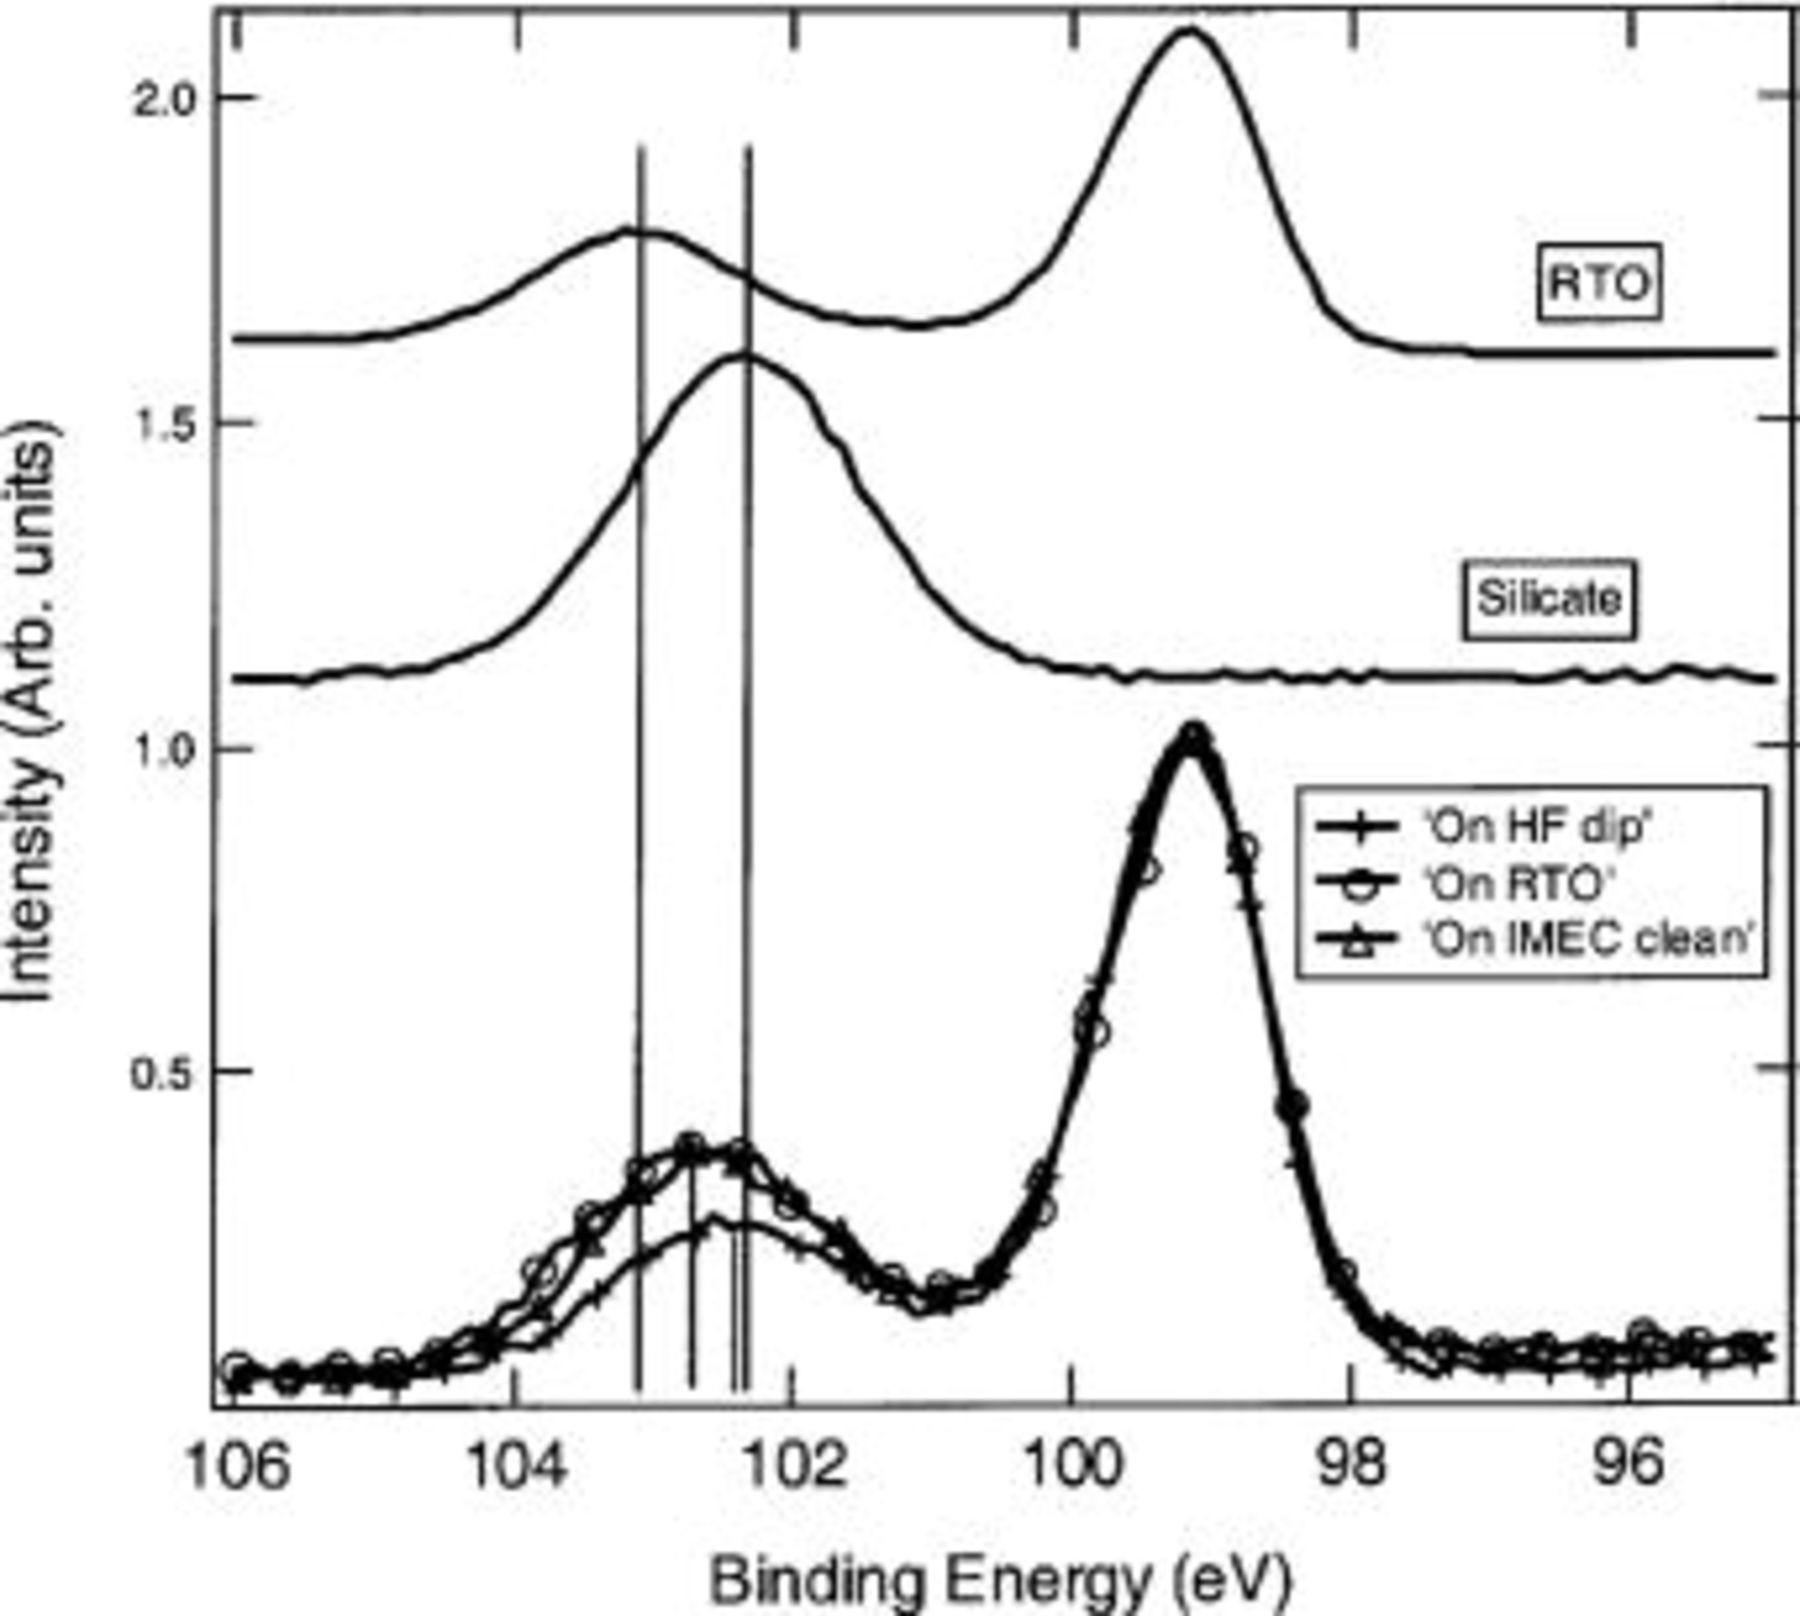
Figure 1. XPS spectra recorded for MOCVD  layers deposited at 485°C (60 s deposition time) on different starting surfaces. As a reference a 1 nm RTO and a Hf-silicate film are added. After deposition an Hf-silicate-like IL is formed for all starting surfaces.
It is clear from Fig. 1 that for the three different starting surfaces the position of the oxidized Si 2p peak shifted to lower BEs, suggesting a Hf-silicate-like composition.7 A slight variation in composition between the HF-last and  -type starting surfaces (RTO and IMEC clean) is probable because a small shift in BE can be observed. The difference in intensity of the oxidized Si 2p peak between the spectrum for the HF-last and the oxide-like starting surfaces can be explained by the difference in IL thickness (see the following section).
This result is remarkable because intuitively one would expect a clear difference between an HF-last starting surface and a  starting layer. For the HF-last surface, the Hf-silicate formation can be understood as simultaneous oxidation of the silicon surface and deposition of the
 with interdiffusion of Hf and O atoms. In contrast, the modification of the
 starting layer into a Hf-silicate implies the in-diffusion of the Hf into the
 layer and/or of the Si into the
 layer. The formation of a Hf-silicate-like IL independent of the type of starting surface indicates that the initial starting surface must be significantly modified during the MOCVD deposition process.
Besides starting surface, the deposition time is also seen to affect the composition of the IL. In Fig. 2, the BE for the interfacial layer (maximum value of the oxidized Si 2p peak) is shown as a function of the deposition time. The measured BEs for a pure RTO and Hf-silicate sample (66/34  are included as reference. When the composition of the IL becomes more Hf rich, the BE peak shifts to lower values because of the replacement of a Si atom by a Hf atom, which is more electropositive.8
9 Therefore, from Fig. 2 it can be concluded that in the course of the deposition the RTO starting surface becomes more Hf rich and hence is transformed from a
 into a Hf-silicate layer, as was suggested by Fig. 1.
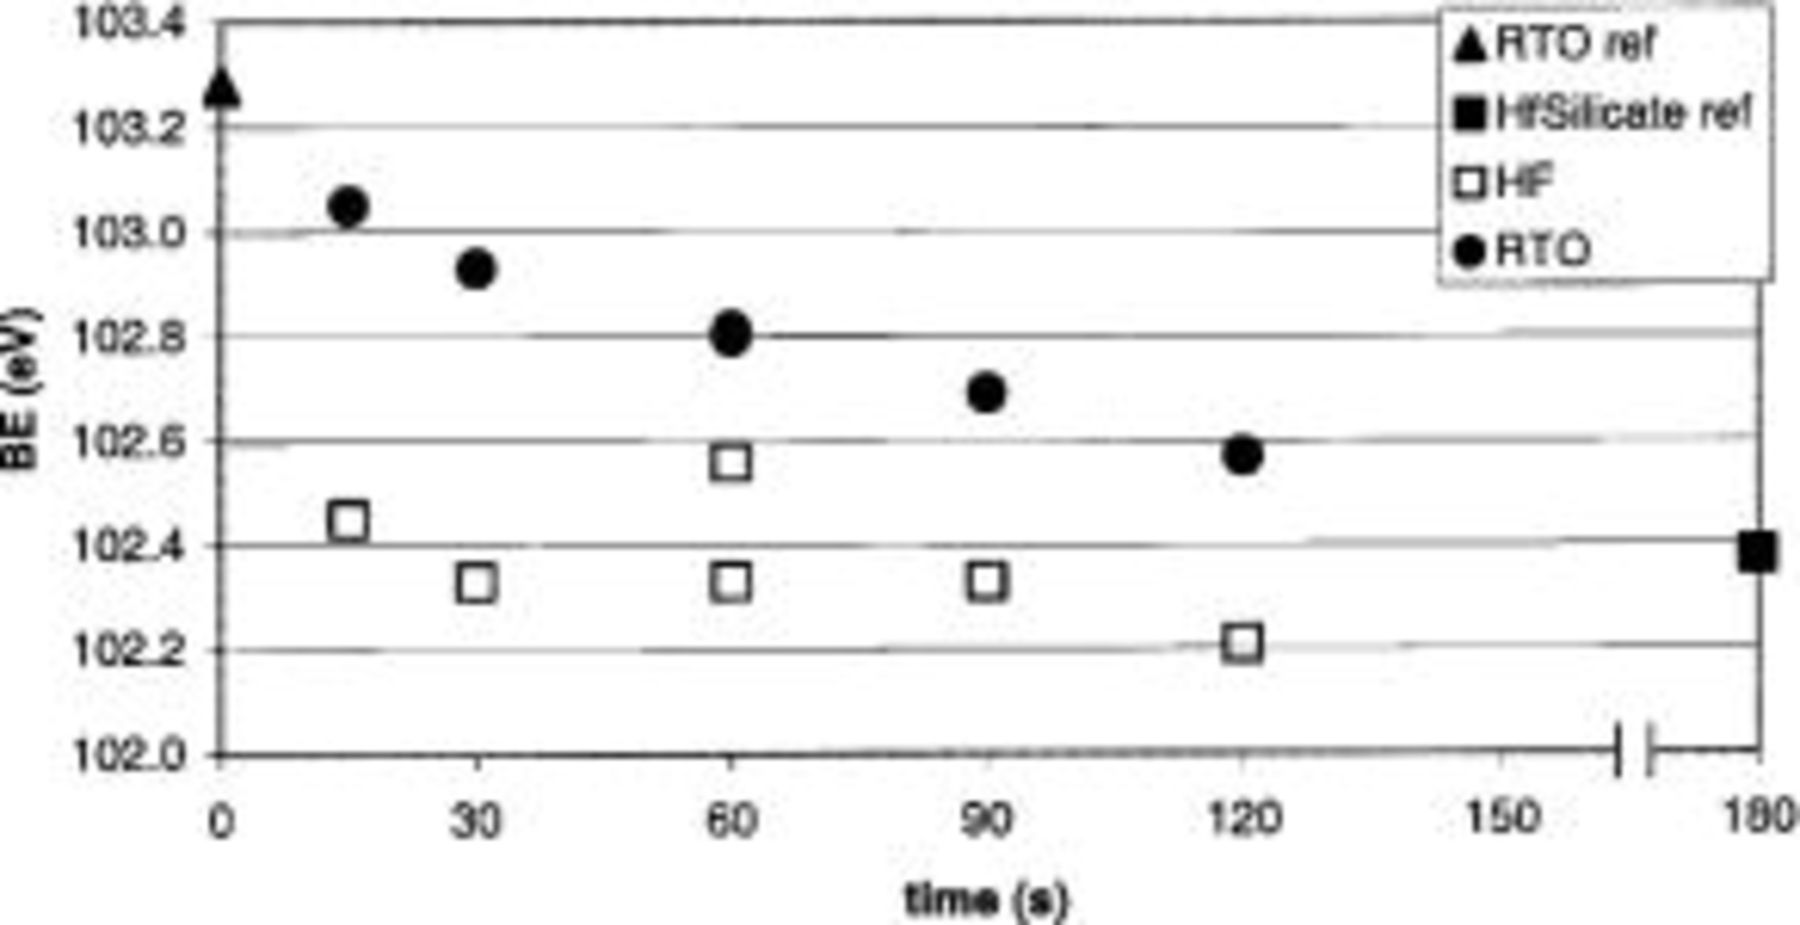
Figure 2. Maximum value of the BE of the oxidized Si 2p peak as determined from the XPS spectra, plotted as a function of the deposition time. All layers were deposited at 485°C.
The HF-last starting surface results in the formation of a Hf-silicate interfacial layer from the very beginning. A slight decrease in BE can be observed, suggesting that at longer deposition times the IL becomes somewhat more Hf rich. The major advantage of a more Hf-rich IL is the higher k value, which is important when downscaling EOT values.
Due to the important surface modification, subtle differences in surface preparation are most likely not going to be translated in the IL because the starting surface is “rebuilt” during deposition. However, this does not mean that the choice of starting surface is unimportant all together. Even if the IL underneath the  layer after deposition is similar, the growth behavior of the
 layer can still be different and influenced by this starting surface. For example, we have observed that other material properties, such as surface roughness, density, and leakage current density also strongly depend on the choice of the starting surface.10
As opposed to deposition time and starting surface, we did not observe a clear effect of the deposition temperature on the composition in the studied temperature range between 300 and 600°C.
We additionally confirmed the Hf-silicate formation by TOF-SIMS depth profiling, observing the simultaneous presence of Si, O, and Hf at the interface.
To study possible diffusion processes at the interface in more detail, we deposited  layers at 300, 485, and 600°C on a 2-3 nm thermal oxide grown in a
 -enriched ambient (the oxygen source was approximately 50/50
 . 60 and 120 s deposition times were chosen for each deposition temperature. All six samples were analyzed with TOF-SIMS. Depth profiles were recorded (Ga-Xe 500 eV) in the negative ion mode in order to determine the (re-) distribution of oxygen during the
 deposition (see Fig. 3).
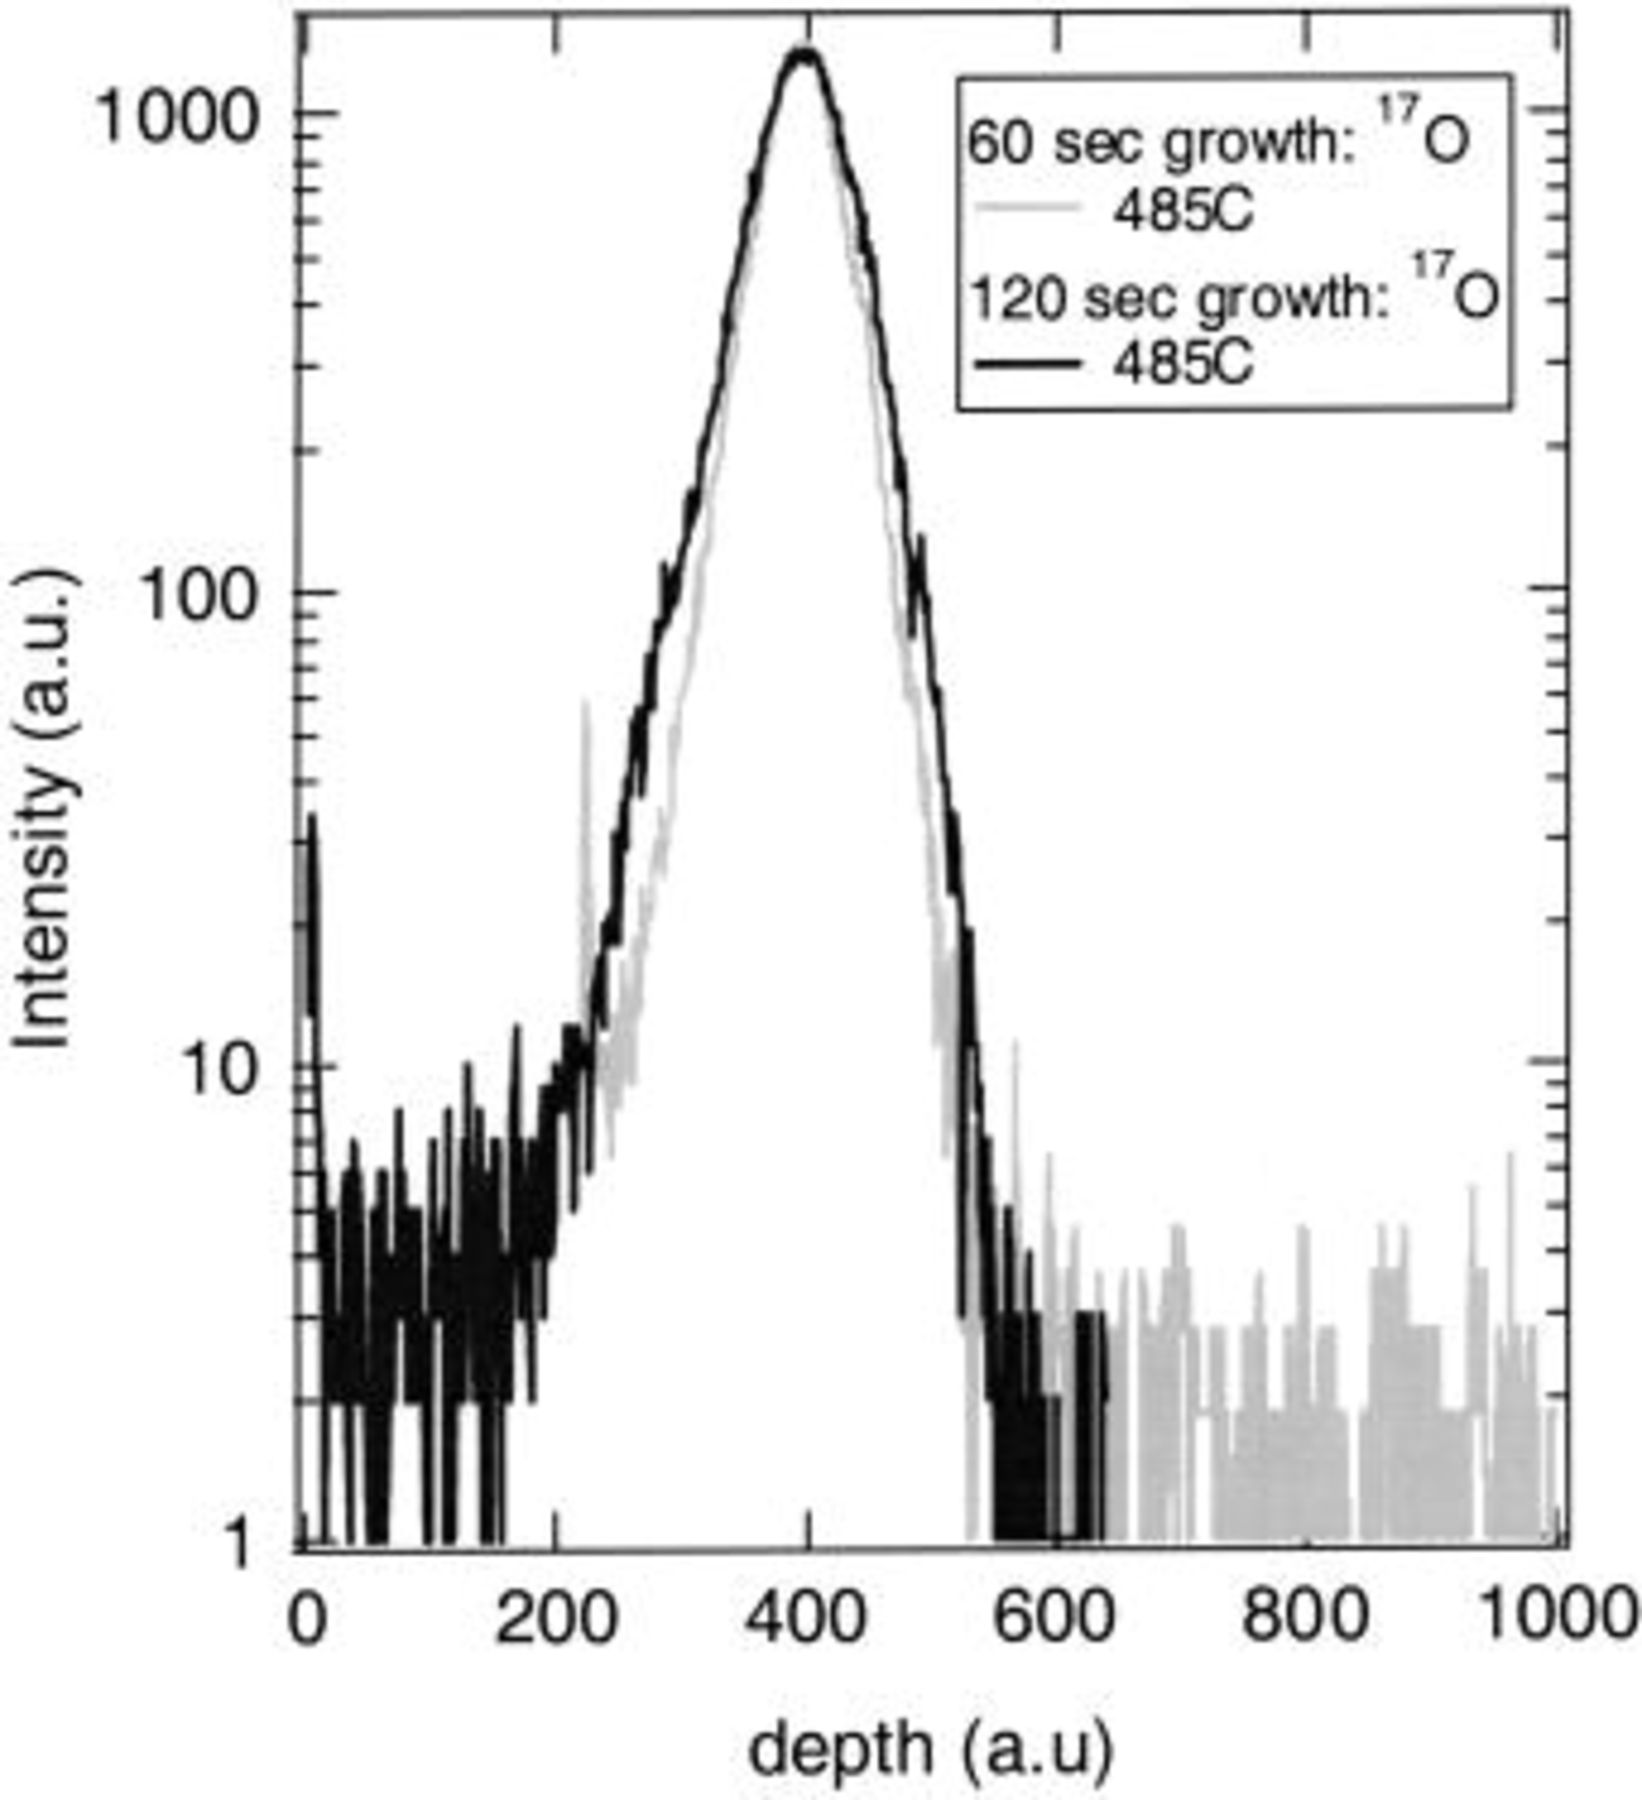
Figure 3. TOF-SIMS depth profiles of  layers deposited on a
 layer thermally grown in a
 -enriched oxygen ambient.
We concentrate on the rising slope of the profile, as the decay is likely to be mainly dominated by ion-mixing effect. No difference was observed as a function of deposition temperature; hence, we show only the TOF-SIMS profiles for the deposition at 485°C (60 and 120 s deposition).
If we compare the profile slopes for the samples with short and long deposition times, then clearly the slope for the thicker sample is less steep, indicating more diffusion of the  into the
 layer when growing thicker layers, which correlates with Fig. 2 (although it has to be noted that the observed difference in slope could also originate from a difference in surface roughness).
Interfacial layer thickness.—
Another key aspect of the IL, besides composition, is the thickness, which becomes very important when scaling down the gate isolator to sub-1 nm as mentioned before. The thickness of the IL was extracted based on XPS measurements because for the thicknesses under study, ellipsometry is not optimally suited for this exercise because of its inability to (accurately) discriminate between the  and the IL. We used a two-layer model to interpret the XPS results:
 assuming the IL to be a pure

 in
 .11
For three  layers deposited on an HF-last starting surface at 300, 485, and 600°C, we observed the intensity of the oxidized Si 2p peak in the XPS spectra to increase with increasing temperature, indicating that a higher deposition temperature results in a thicker IL. It would be oversimplifying, though, to state that an as-low-as-possible deposition temperature should be used in order to minimize the IL thickness, because the deposition temperature also determines important characteristics of the
 layer, e.g., the density and crystalline state of the layer, as well as the amount of contaminants present in the layer (for example, water, carbon, etc…).10 Consequently, a lower limit exists for the deposition temperature below which the deposition results in poor-quality
 layers.12
Furthermore, we have found that the IL distinctly grows with deposition time as shown in Fig. 4. We have plotted the IL thickness as a function of deposition time for an HF-last and RTO starting surface for a fixed deposition temperature of 485°C. We also added two data points for deposition temperatures of 300 and 600°C for a fixed deposition time of 60 s to indicate the effect of temperature. The growth rate of the IL is higher for a H-passivated than for an RTO starting surface. Up to 120 s of deposition time the IL thickness keeps increasing, although Fig. 4 suggests that the IL thickness stabilizes around 1.5 nm.
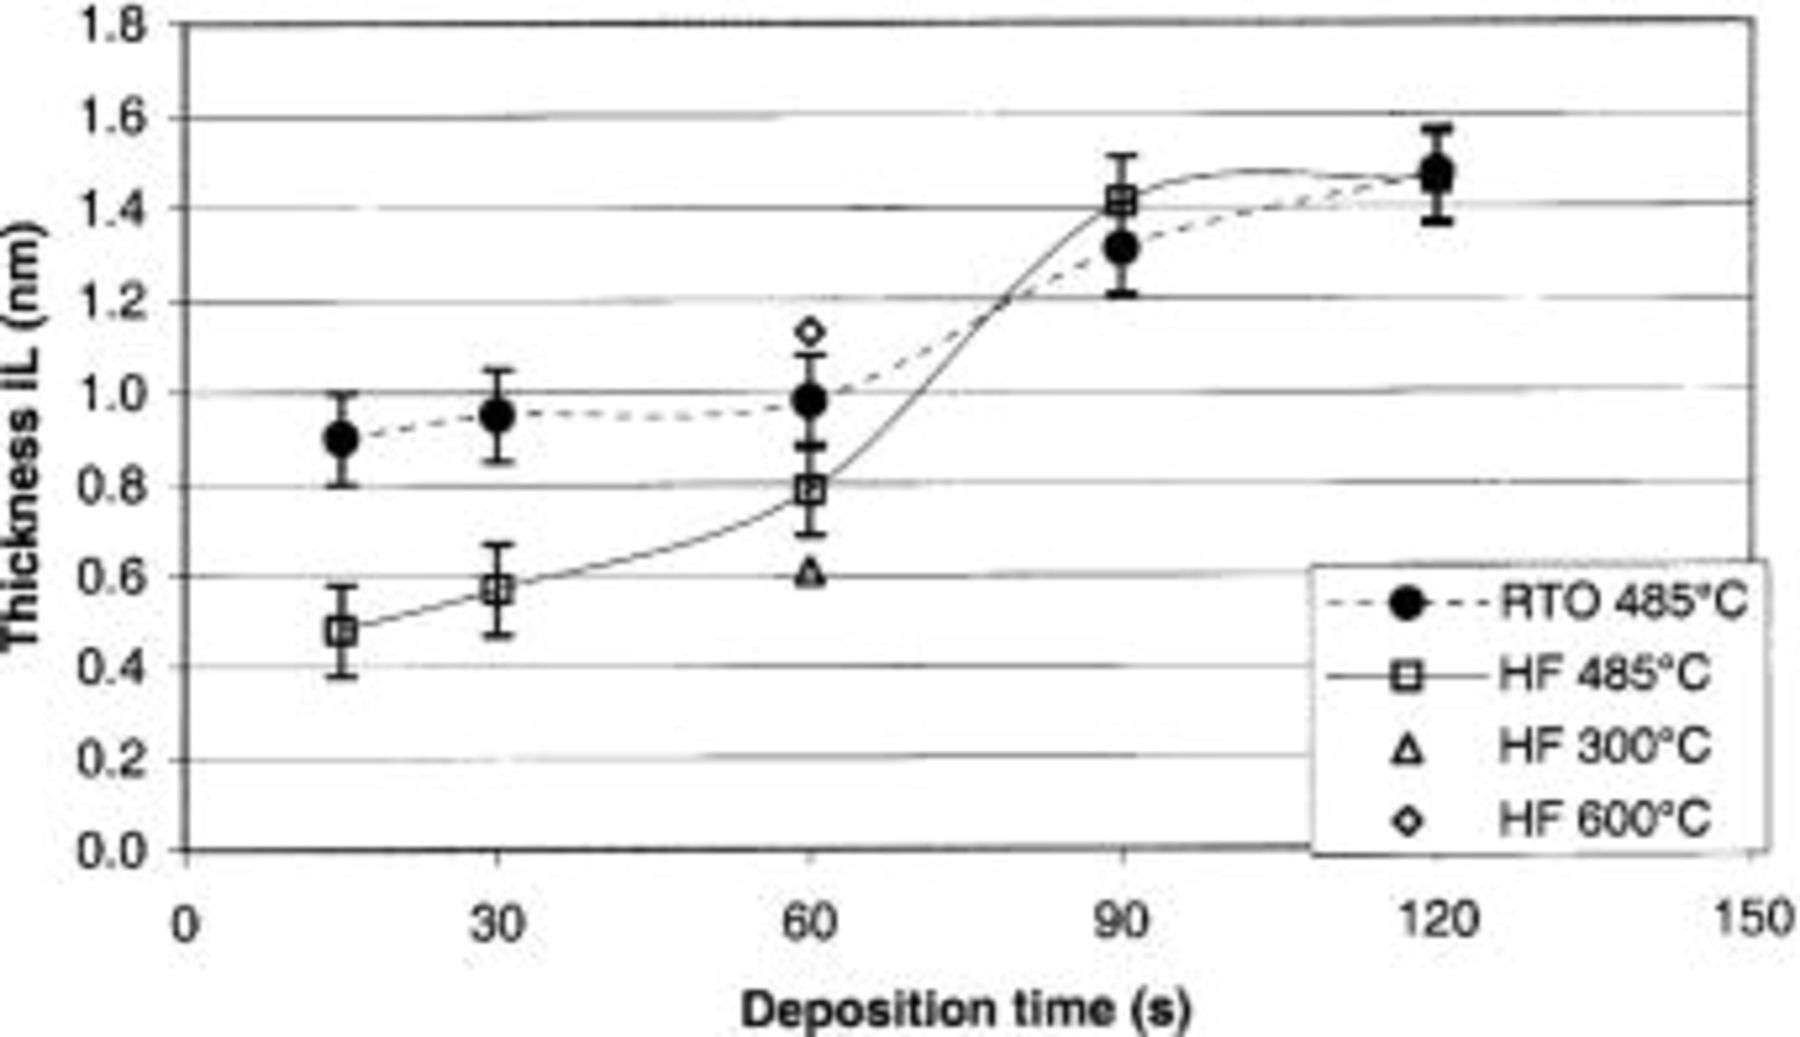
Figure 4. Thickness of the  and IL as a function of deposition time for an RTO and HF-last starting surface. Thickness of the IL is calculated assuming the IL to be pure
 IL thickness increases as a function of deposition time for both starting surfaces.
Figure 4 implies that for short deposition times the IL thickness is less for an HF-last starting surface, while for longer deposition times the thickness of the IL becomes independent of the starting surface. Therefore, it seems trivial that to minimize the EOT, short deposition times in combination with an HF-last starting surface should be preferred. However, a major drawback is the observation that an HF-last starting surface results in less favorable material properties of the deposited  10
Based on the change in composition and thickness as function of time (Fig. 2 and 4, respectively), it seems that for the HF-last starting surface there is a constant transport of silicon and/or hafnium, resulting in growth of the layer with a fixed composition. While less clear, a similar observation is made in the RTO case. The fact that even for deposition times exceeding 60 s (representing several nanometers of deposited  there is still a distinct growth of the IL indicates that the
 layer does not efficiently prevent further oxidation at the interface, and hence that the
 layer is very permeable for

Moreover, we have also found that the presence of the hafnium plays a role in the growth of the IL and it appears that the presence of  has a catalytic effect on growth of the IL. For this we have considered different experimental conditions, varying the duration of both Hf precursor (TDEAH) and
 flows. The deposition temperature is 485°C; all layers are deposited on an HF-last starting surface.
From Fig. 5, we can see that condition 1 (only  already results in a thin
 layer of 0.36 nm. (The thickness is determined according to Ref. 11.) For the same process time, if the TDEAH is flowing simultaneously (actual
 layer growth, condition 4) the IL thickness reaches 0.8 nm. This increase of the IL thickness could be ascribed to an enhanced (compared to condition 1)
 formation, the incorporation of
 or a combination of both. We know that some
 is added to the IL because after deposition the IL is transformed into a Hf-silicate, as was demonstrated by XPS and TOF-SIMS, but it is highly unlikely that the increase of the IL thickness is solely due to the incorporation of Hf. This can be shown from the analysis of the IL thickness resulting from conditions 2 (15 s
 and 3 (15 s
 followed by 45 s only
 . If we consider condition 2 vs. 3, then it is easy to see that even for an identical Hf flow, a longer oxidation time results in a further thickness increase, exceeding the value we obtain for the oxidation of a bare Si wafer. Hence, in the presence of the hafnium additional oxidation of the silicon is observed (condition 1 vs. 3), suggesting a catalytic effect of the
 Because
 transport toward the interface can never be more efficient than for an uncovered surface, i.e., the oxidation of a silicon surface, the catalytic effect probably has to be understood by assuming the dissociation of
 into more reactive species, for example, atomic oxygen. Also, Fig. 5B clearly demonstrates the enhanced growth of the interfacial layer as a function of the TDEAH flow.
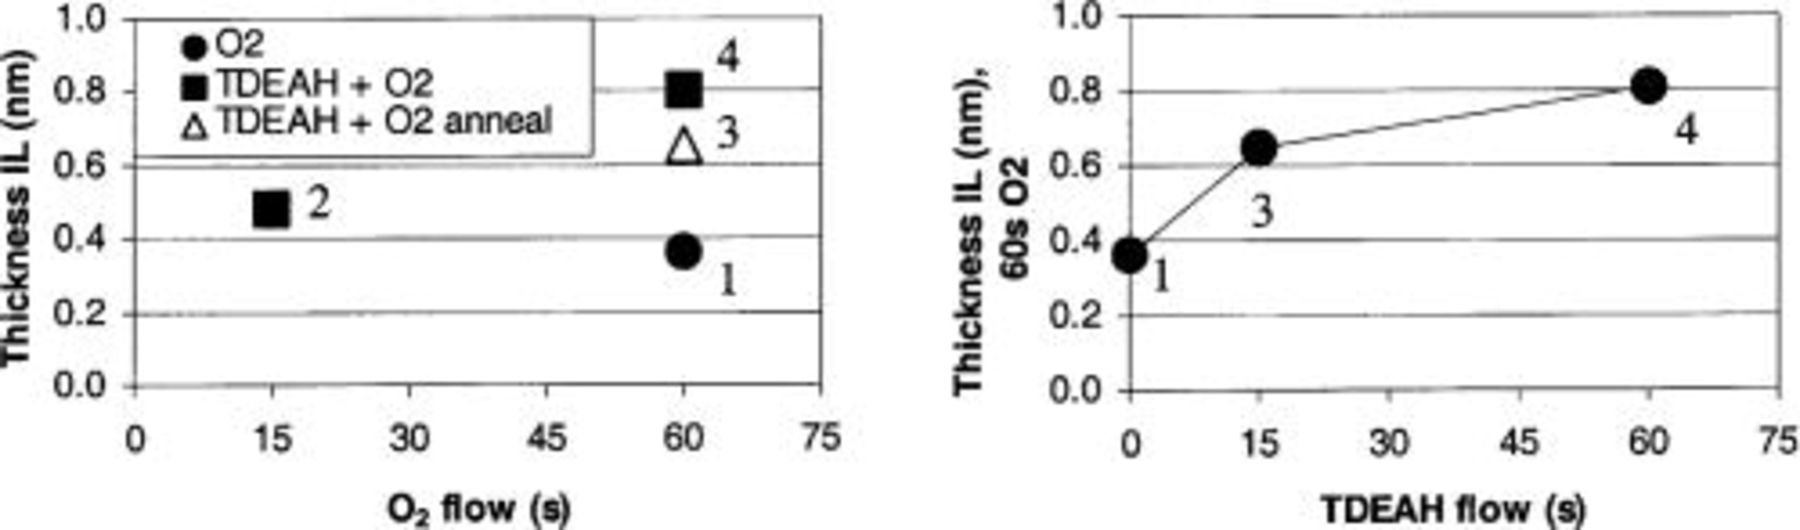
Figure 5. IL thickness measured by XPS for four different growth settings at 485°C: (1) only  flow; (2) 15 s
 flow; (3) same as (2) followed by 45 s
 flow; and (4) 60 s
 flow. The data are presented as a function of (left)
 flow time and (right) the TDEAH flow time for samples with a total processing time of 60 s.
In addition, we have observed by spectroscopic ellipsometry that the thickness increase after a thermal anneal in an oxidizing ambient is significantly different for  layers as compared to
 stacks. For identical anneal conditions the thickness increase was roughly twice as large for the
 stacks compared to
 wafers (0.4 vs. 0.2 nm). Although intuitively the opposite would be expected because of the screening of the Si by the
 layer, this is a clear indication of an enhanced oxidation due to the presence of the
 and can explain why we still observe significant IL growth for relatively thick
 layers. Furthermore, such enhanced oxidation at the interface during anneal in an oxidizing ambient of
 films has also been reported in the literature, supporting our observations.13
We have tried to model IL growth based on the theoretical models that can be found in literature describing the growth of thin  layers, e.g., Deal-Grove, Mott-Cabrera, and Fehnler-Mott.14
15
16 However, none of these models accurately describes growth of the IL and all of them demonstrate more or less the same degree of inaccuracy. This is probably partly due to the limited number of available data points, but mainly because of the transformation of the IL into a Hf-silicate, while the above-mentioned models deal with pure
 layers, and because of the catalytic influence of hafnium on the oxidation rate.
Conclusion
We have studied the growth kinetics and composition of the IL that is formed during the MOCVD  deposition process. We have shown that after
 deposition a Hf-silicate-like IL is formed underneath the
 for various starting surfaces. The thickness of this IL is a function of deposition time and temperature, and therefore can be controlled by varying the starting surface, the deposition time, and the deposition temperature. In addition, our results suggest that the presence of
 causes an enhanced oxidation at the interface. The IL growth can be limited using an HF-last starting surface, and by keeping the deposition temperature low and the deposition time short, with the major limitation that these parameters also determine the
 deposition process and the quality of the deposited
 layer. Therefore, careful process tuning and novel surface preparations are necessary in order to find the optimal compromise between a thin IL with a minimal EOT contribution and a high-quality high-k material.
Acknowledgment
The authors thank A. Stesmans for growth of the thermal oxides in a  -enriched ambient.
IMEC assisted in meeting the publication costs of this article.
