

Abstract
Preliminary computational data are presented related to shape changes in the distribution of participation ratios of electronic wavefunctions from 1D and 2D Fibonacci quasicrystals. They suggest a likely connection between a distorsion-induced metal-insulator transition and the golden number spanning the word sequence underlying the quasiperiodicity of these systems.
Export citation and abstract BibTeX RIS

Original content from this work may be used under the terms of the Creative Commons Attribution 4.0 licence. Any further distribution of this work must maintain attribution to the author(s) and the title of the work, journal citation and DOI.
1. Introduction
Since their discovery in 1984 by Shechtman [1], the electronic properties of quasicrystals (QCs) have always attracted special attention, as their quantum-mechanical wavefunctions can actually be considered intermediate in character between the extended states of a metal and the exponentially localized states of an insulating phase. Several authors analyzed the electronic properties of such systems, taking into account many-body effects in the Fibonacci chain [2] and the metal-insulator transition in two-dimensional (2D) QC from the Amman-Beenker tiling family in the framework of Random Matrix Theory (RMT) [3]. Investigations concerning the distorsion-induced metal-insulator transition in simpler tight-binding models for 1D or 2D QC tilings from the metallic-mean family [4] have not been published so far in literature. It would be far more interesting to explore the likely connection between the metallic number [5] defining the QC aperiodic structure and the onset of metal-insulator transition, not only on a fundamental science viewpoint but also with the aim of the designing new technological applications based on metamaterials [6] where this phenomenon can be controlled and eventually tuned.
2. Model and methodology
The present note is focused on the analysis of the shape change in the distribution of participation ratios of the computed QC electronic wavefunctions when the geometric aperiodic structure is distorted in order to drive a phase transition in the electronic spectrum of the system. The normalized participation ratios are defined accordingly to equation (7.7) in [7] in terms of eigenvector coefficients ei (Eν ) corresponding to states eν with energy Eν

where the sum over the orbital characters of the wavefunction α in the original reference has been dropped, since the investigation refers to a simplified model with a unique orbital character. The sums over index i appearing in the above expression run over all the N sites of the system. The (normalized) participation ratios pν quantify the degree of localization of an electronic wavefunction, namely pν ≪ 0. 5 points out for a localized wavefunction, whereas for pν ≳ 0. 5 it is extended. The electronic wavefunctions are numerically computed as the eigenvectors of the nearest-neighbor tight-binding hamiltonian matrix spanning the quasiperiodic lattice approximant of the system

where  are the second quantization electron creation and annihilation operators at sites j and k, respectively.
  gives the hopping matrix elements between electron states associated with the corresponding pair of sites. In a sparse-matrix representation of the hamiltonian graph, the off-diagonal elements given by
  are non-zero for vertices connected by an edge, otherwise
  . The actual values of
  depend on the length of the edge connecting two neighboring vertices. The on-diagonal parameter
  k
correspond to the on-site energies, but usually the simplification k
= 0 is adopted, as chosen here, so that no vertex is energetically favoured. This is the simplest model able to capture the essential electronic features of the system, since the aperiodicity is directly embedded in the graph modeling the QC patch and in the modulation of the hopping probabilities according to the distance between neighboring vertices.
k
correspond to the on-site energies, but usually the simplification k
= 0 is adopted, as chosen here, so that no vertex is energetically favoured. This is the simplest model able to capture the essential electronic features of the system, since the aperiodicity is directly embedded in the graph modeling the QC patch and in the modulation of the hopping probabilities according to the distance between neighboring vertices.
For an ideal aperiodic crystal the matrix to be diagonalized would be infinite; in practice, as chosen in this case, one usually approximate it with a finite QC patch with both a statistically significant and computationally manageable number of sites (i.e. ∼104) to extrapolate results valid for a large number N of sites. The simplest 1D quasicrystal models for patch construction are based on the Fibonacci quasiperiodic word sequence (see figure 1), which is obtained starting from a two-letter alphabet (L
S) and a substitution rule σ(L) = LS, σ (S) = L that can be iterated n times to give a reasonably large QC system [6]. The ratio of the frequencies of the two letters S and L in the limit of n tending to infinity is the golden number  , which is the first in the series of the metallic means family [5]. Therefore, by considering equation (2), the hopping matrix elements
  can either take the value assigned for L or S.

Figure 1. 1D Fibonacci quasicrystal with spacings L and S.
Download figure:
Standard image High-resolution imageFigure 2 shows a finite patch of a 2D Fibonacci QC with a square grid obtained by performing the tensorial product of two identical 1D Fibonacci quasiperiodic sequences of different spacings L (long) and S (short) on the grid axes.

Figure 2. 2D Fibonacci quasicrystal with square tiling built up from grid product of two identical 1D quasiperiodic sequences obtained after n = 4 iterations of the Fibonacci word substitution rule.
Download figure:
Standard image High-resolution image3. Results
To address the question of change in the electronic structure at the origin of the metal-insulator transition, the effects of the change of the L/S ratio on the Hamiltonian were investigated in a series of computations performed by setting L = 1 and varying S in the range 0 < S < 1 (at S = L = 1 the system is a periodic crystal) and then subsequently by letting S = 1 and 1 < L ≤ t1 with t1 ≫ τ, where the measure units are to be considered adimensional, because of the theoretical nature of the considered system. Histograms of the normalized participation ratios pν of the full set of the numerically computed tight-binding eigenvectors were collected for each L, S values in the above mentioned ranges with bin size set to 0.1.
It can be verified that the histogram distribution of normalized participation ratios obtained for L = 1, S = τ−1 ≈ 0.618 matches the one obtained from S = 1, L = τ ≈ 1.618 , as a consequence of the symmetry imposed by the Fibonacci substitution rule (figure 3). The change in the pν
distribution as a function of the L/S ratio can be more easily appreciated in the dynamical histogram plot reported in figure 4(a). When  , most pν
values concentrate on the left side of the histogram with 0.1 ≲ pν
≲ 0.3, meaning that all the wavefunctions are localized [7].
, most pν
values concentrate on the left side of the histogram with 0.1 ≲ pν
≲ 0.3, meaning that all the wavefunctions are localized [7].
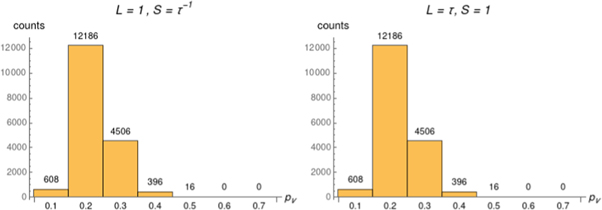
Figure 3. Histograms of normalized participation ratios pν from 1D Fibonacci chains with n = 20: the distributions of pν values computed at L = 1, S = τ−1 and S = 1, L = τ match as a consequence of the system symmetry.
Download figure:
Standard image High-resolution image
Figure 4. (a): Dynamical histogram for 1D Fibonacci QC. (b): Dynamical histogram for 2D Fibonacci QC. Histograms of normalized participation ratios pν at different L/S ratios as animated GIFs for 1D (n = 20) and 2D (n = 9) Fibonacci QCs (see supplementary videos stacks.iop.org/IOPSN/1/025203/mmedia).
Download figure:
Standard image High-resolution imageBy increasing S, a change in the histogram shape occurs around L = 1, S = τ−1, with the largest fraction of pν
values concentrating now around 0.5, i.e. wavefunctions are now stepping into the delocalized or extended regime. For  , the system is completely in the metallic regime, since all participation ratios now accumulate on the rightmost part of the histogram with pν
≃ 0.7. This situation is mirrored in the range
, the system is completely in the metallic regime, since all participation ratios now accumulate on the rightmost part of the histogram with pν
≃ 0.7. This situation is mirrored in the range  , where the pν
bins start to move back from right to left, with a change occuring again at L = τ. From that point on (leftwards), the system enters again the localized regime with
, where the pν
bins start to move back from right to left, with a change occuring again at L = τ. From that point on (leftwards), the system enters again the localized regime with  . This fact was reproducibly verified for several increasing n values in the substitution sequence. Here only the results for n = 20 system were reported, which correspond to a matrix size of 17 712, the largest which could be straightforwardly diagonalized on an ordinary laptop computer and a working Python software installation for numerical computing. A similar result is found for the 2D Fibonacci QC patch, as reported in figure 4(b) for n = 9 (corresponding to a matrix size equal to 8100).
According to the definition of unnormalized participation ratios  , which quantifies the number of lattice sites over which the wavefunction is extended (i.e.
  ), the full set of Pν
values for the 1D Fibonacci QC with n = 20 was tentatively fitted against the Polya-Aeppli (compound geometric Poisson) probability distribution with shape parameters r and q
1
.
), the full set of Pν
values for the 1D Fibonacci QC with n = 20 was tentatively fitted against the Polya-Aeppli (compound geometric Poisson) probability distribution with shape parameters r and q
1
.
The plots reported in figure 5 show the r, q values resulting from distribution fitting with the Wolfram Mathematica® function  using the builtin
  option for different L, S settings corresponding to the localized regime (top left, bottom right panels), the critical ratios at τ−1, τ (top and bottom center panels) and the extended regime (top right, bottom left panels).

Figure 5. Fitting results for the unnormalized participation ratios Pν at different L, S settings against a Polya-Aeppli distribution of parameters r and q for a 1D Fibonacci QC with n = 20.
Download figure:
Standard image High-resolution imageFigures 6(a), (b) summarize the corresponding trends of r and q parameters reported on a logarithmic scale as a function of the L/S ratio in the 1D and 2D QCs, respectively. Both plots show the divergence of r, q values at the quasiperiodic-to-periodic transition at L = S = 1 marked by q = − 1. The q parameter is very close to 1 and has a very weak dependence on L/S ratio for the 1D system. The values of the size parameters r and q at τ−1 and τ are highlighted with dashed vertical lines. The turning point close to r = 20 is also marked by a dashed horizontal line as a guide to the eye for both systems. By numerically interpolating the r values as a function of the corresponding L/S ratios, a flex in such functional dependence can be found in the proximity of the critical ratios (τ−1, τ), which can be interpreted as the metal-insulator transition point for the 1D system. For the 2D QC a small dip is found at τ2. In the latter case the computed r, q values refer to a global average over the whole set of participation ratios, without discriminating the Pν values according to the QC orthogonal axes x and y.

Figure 6. Fitted parameters r and q obtained from fitting the unnormalized Pν values against the Polya-Aeppli probability distribution at different L/S ratios from a Fibonacci 1D QC with n = 20 (left) and a 2D QC with n = 9 (right).
Download figure:
Standard image High-resolution imageA weakly oscillating behaviour of the r values as a function of the QC size n can be seen in figure 7, which shows that the electronic properties of the 1D QC system are symmetry dependent on n parity. However, the numerical differences in the values of r according to the n parity become smeared out after n = 20 where both r trends pair asymptotically while slowly continuing to decrease.

Figure 7. Fitted r, q values obtained for L = τ, S = 1 of 1D Fibonacci QCs of different lengths n. The plot for L = 1, S = τ−1 is identical by symmetry.
Download figure:
Standard image High-resolution image
If more computing resources were available in terms of memory and time, it would be possible to obtain participation ratio datasets for larger n values, not only for the 1D system but also for the 2D Fibonacci QC, in order to address the scaling of the distribution shape parameter r with the system size n. In particular, it would be helpful to ascertain the existence of a limit value for the fitting parameter r, as reported in figure 7. Certainly, it would be far more interesting to provide a more in-depth physical interpretation for the shape parameters for other structures spanned by other metallic numbers beside the Fibonacci golden ratio. More generally, on a theoretical sideview, it would be compelling to investigate the relationship between the distribution of participation ratios in presence of disorder and the distributions of the energy level spacings known from RMT, according to the recently found linear algebra identity between eigenvalues and eigenvector modules [8].
4. Conclusion
In summary, the analysis of the participation ratios from single-particle eigenfuctions for low-dimensional Fibonacci quasicrystals suggests a metal-insulator transition related to a Peierls distorsion in a quasiperiodic tight-binding model with nearest-neighbour staggered hopping amplitudes (half-filled Su-Schrieffer-Heeger model) which likely occurs at a lattice distortion ratio corresponding to the golden number or its inverse, according to the chosen hamiltonian parametrization.
Acknowledgments
The author gratefully acknowledges Istituto d'Istruzione Superiore Cattaneo-Mattei PDIS003009 in Monselice-Conselve (Padova, Italy) for the supportive environment.
Data availability statement
The data that support the findings of this study are available upon reasonable request from the authors.
Code availability
The Python code for reproducing the results is available upon request from the author.
Footnotes
- 1
In statistics textbooks and software manuals the shape parameters are usually denoted as θ and p but here r, q are chosen, respectively. This is done in order to avoid any confusion with the n iterations used for obtaining QC word sequences and the p used for the normalized participation ratios.