
Abstract
This work investigates the green synthesis of silver nanoparticles (AgNPs) utilizing the aqueous leaf extract of Ocimum sanctum L. A change in colour to dark brown from yellow and an absorption maximum at 460 nm provided evidence for the synthesis of AgNPs. Several reaction conditions namely leaf extract volume, AgNO3 concentration and duration of incubation were optimized. Maximum synthesis of AgNPs could be achieved with 1 ml of 5% aqueous leaf extract, 1 mM AgNO3 and 2.5 h incubation period. DPPH (2, 2—diphenyl − 1 - picrylhydrazyl) assay revealed that AgNPs are better than the leaf extract in terms of antioxidant potential. These results strongly recommend the application of green-synthesized AgNPs as effective antioxidants against oxidative stresses associated with degenerative diseases. Characterization of AgNPs were then carried out using certain methods namely as x-ray diffraction (XRD) measurement, Fourier transform infrared spectroscopy (FTIR) and scanning electron microscopy (SEM). XRD study confirmed the synthesis of face-centered cubic-shaped AgNPs that are of crystalline nature. The mean particle size of the synthesized AgNPs computed employing the Debye–Scherrer formula, was 22 nm. FTIR study demonstrated that the AgNPs consisted of certain functional groups of O. sanctum which might have helped in reducing AgNO3 and capping AgNPs. SEM images showed the synthesis of AgNPs of various shapes viz. globular, cubical and flaky. The scattered AgNPs were found to have a size close to 20 nm, which roughly matches with the XRD analysis of the current study.
Export citation and abstract BibTeX RIS

Original content from this work may be used under the terms of the Creative Commons Attribution 4.0 licence. Any further distribution of this work must maintain attribution to the author(s) and the title of the work, journal citation and DOI.
1. Introduction
Nanotechnology is a dynamic, interdisciplinary discipline in material science, which mainly aims on synthesizing nanoparticles with antimicrobial and antioxidant attributes that can be used against several degenerative diseases including cancer (Nazem & Mansoori 2008). Several metals namely silver, gold, magnesium, titanium, zinc and copper are used to synthesize nanoparticles. Silver nanoparticles (AgNPs) are advantageous than other nanoparticles because of their attributes and increased use in diverse areas namely nanodevice fabrication, drug delivery, imaging, bio-sensing, catalysis and home gadgets (Wijnhoven et al 2009). AgNPs were found to inhibit the growth of both gram-positive and gram-negative bacteria (Mintiwab & Jeyaramraja 2021).
AgNPs synthesis can be accomplished using biological, chemical or physical approaches. Physicochemical ways to synthesize nanoparticles make use of ultrasonic fields, photochemical reduction and UV irradiation (Magnusson et al 1999). Synthesizing nanoparticles using chemical compounds of non-biodegradable nature is very dangerous to the biological system and environment (Phull et al 2016). The biological method or green method of AgNPs synthesis is eco-friendly this method avoids using toxic chemicals, high temperature or pressure. Besides, this method is very economical i.e., it can be scaled up with ease for AgNPs synthesis in bulk. Bacillus spp. was used to synthesize nanoparticles (Elbeshehy et al 2015). There are reports on growing metal nanoparticles by enzymes (Willner et al 2006). Synthesis of metal nanoparticles was performed, employing various plants, such as Ricinus communis (Mintiwab & Jeyaramraja 2021), Caesalpinia pulcherrima (Moteriya & Chanda 2018), Azadirachta indica (Ahmed et al 2016) and so on. Nanoparticle synthesis by making use of plant extracts is much beneficial because they aid in the formation of stable nanoparticles and also, they help in faster reduction rate of metal ions (Moteriya et al 2017). AgNPs synthesis using plant extracts requires less time (Phull et al 2016).
O. sanctum is known in different parts of the world as an important medicinal plant. Many studies have been done in the past (table 1) on the use of O. sanctum to synthesize AgNPs but the optimization of leaf extract volume and AgNO3 concentration, were not done in any of those studies. Moreover, the antioxidant potential of AgNPs synthesized using O. sanctum leaf extracts was not studied before (table 1). So, this investigation was taken up to optimize the volume of leaf extract and AgNO3 concentration for the maximal synthesis of AgNPs employing O. sanctum. Antioxidant potential of AgNPs was investigated by DPPH assay. Characterization of AgNPs was carried out using XRD, FTIR and SEM.
Table 1. Reports on O. sanctum mediated AgNPs synthesis found in literature as compared to the present investigation.
| Publications | Source of O. sanctum | Plant age | % leaf extract used | Extraction conditions | Optimization of reaction conditions (leaf extract volume, AgNO3 concentration & duration of incubation) | AgNP synthesis | Antioxidant activity of AgNPs |
|---|---|---|---|---|---|---|---|
| Current study | Areka Agricultural Research Center, Wolaita zone, SNNPR, Ethiopia | 4 to 6 months | 5% aqueous leaf extract | 60 °C in water bath for 20 min | Yes | 1 ml leaf extract + 100 μl of 100 mM AgNO3 + 8.9 ml dH2O | Studied by DPPH radical scavenging method |
| (Mallikarjuna et al 2011) | Surroundings of Tirupati, Andhra Pradesh, India. | Unknown | 20% aqueous leaf extract | Boiled for 5 min | No | Leaf extract (0.5 ml)+ 10 ml of AgNO3 (1 mM) | Not studied |
| (Ramteke et al 2013) | Unknown | Unknown | 20% aqueous leaf extract | Boiled for 5 min | No | Leaf extract (10 ml) + AgNO3 (90 ml) so as to make a final concentration to 1 mM | Not studied |
| (M. Z. H. Khan et al 2017) | Jessore district in Bangladesh | Unknown | 20% aqueous leaf extract | Boiled for 20 min | No | 10 ml leaf extract + 90 ml of 1 mM AgNO3 | Not studied |
| (Malapermal et al 2017) | Tropical Garden Nursery in KwaZulu Natal, South Africa | Unknown | 10% aqueous leaf extract | Boiled for 10 min | No | Leaf extract (10 ml) + 1 mM of AgNO3 (45 ml) | Not studied |
| (Yadav et al 2018) | Rajasthan Agriculture Research Station, Durgapura, Jaipur, India | Unknown | 15% aqueous leaf extract | Boiled for 15 min | No | Not described | Not studied |
| (Jacob et al 2019) | Pattoor, Alappuzha, Kerala, India | Unknown | 20% aqueous leaf extract | Boiled for 5 min | No | 10 ml leaf extract + 90 ml AgNO3 to make final conc. To 1 mM | Not studied |
| (Baruah et al 2021) | Local market of Shillong, Meghalaya, India | Unknown | 5% aqueous leaf extract | 60 °C for 60 min | No | Leaf extract (150 μl) + 2 mM AgNO3 (5 ml) | Not studied |
2. Materials and methods
This work was performed in the Biology Department laboratories, College of Natural Sciences, Arba Minch University, Ethiopia from February 2020 to February 2021.
2.1. The plant material
Leaves of O. sanctum were obtained from Areka Agricultural Research Center in Wolaita zone, Southern Nations, Nationalities, and Peoples' Region of Ethiopia. Leaves of healthy, disease-free, 4 to 6 months old O. sanctum plants were collected during February 2020. The plants were identified and authenticated by plant taxonomists in Arba Minch University.
2.2. Preparation of aqueous leaf extract
Leaves of O. sanctum were cleaned with distilled H2O before cutting them into tiny bits. From these finely cut pieces, 5 g was soaked in 100 ml distilled H2O and this mixture was incubated in a water bath at 60 °C for 20 min. After bringing the extract to room temperature, it was filtered through Whatman No. 1 filter paper and the filtrate was kept at 4 °C for subsequent analysis.
2.3. Optimization of parameters for biosynthesis of AgNPs
50 ml of 100 mM stock solution of AgNO3 was prepared by weighing 0.84g AgNO3 in a 50 ml volumetric flask and making up the volume to the mark using distilled water. To determine the optimum leaf extract volume and AgNO3 concentration for the maximum synthesis of AgNPs, the 'one factor at a time' procedure was used. This design of experiment implies that one experimental variable was adjusted at one time keeping the remaining factors constant. In the first optimization experiment, AgNPs synthesis was studied by varying the volumes of leaf extract, as given in table 2. In this experiment, leaf extracts of varying volumes (0, 0.5, 0.75, 1, 1.25 and 1.5 ml) were pipetted out separately to each test tube and the AgNO3 concentration was kept constant at 1 mM (table 2).
Table 2. Biosynthesis of AgNPs using varying volumes of leaf extract.
| Components | Test tube1 | Test tube2 | Test tube3 | Test tube4 | Test tube5 | Test tube6 |
|---|---|---|---|---|---|---|
| Leaf extract (ml) | 0 | 0.5 | 0.75 | 1 | 1.25 | 1.5 |
| 100 mM AgNO3 stock (μl) | 100 | 100 | 100 | 100 | 100 | 100 |
| Distilled H2O (ml) | 9.9 | 9.4 | 9.15 | 8.9 | 8.65 | 8.4 |
| Concentration of AgNO3 (mM) | 1 | 1 | 1 | 1 | 1 | 1 |
| Final volume (ml) | 10 | 10 | 10 | 10 | 10 | 10 |
In the next optimization experiment, synthesis of AgNPs was investigated by adjusting AgNO3 concentration (0 mM-1.5 mM) and keeping the volume of leaf extract constant (1 ml), as given in table 3. After preparing the reaction mixtures as detailed in tables 2 and 3, they were kept in dark for 0.5 h before analyzing their absorption spectra between 350 to 650 nm.
Table 3. Biosynthesis of AgNPs using varying concentrations of AgNO3.
| Components | Test tube1 | Test tube2 | Test tube3 | Test tube4 | Test tube5 | Test tube6 |
|---|---|---|---|---|---|---|
| Leaf extract (ml) | 1 | 1 | 1 | 1 | 1 | 1 |
| 100 mM AgNO3 stock (μl) | 0 | 50 | 75 | 100 | 125 | 150 |
| Distilled H2O (ml) | 9 | 8.95 | 8.925 | 8.9 | 8.875 | 8.85 |
| Concentration of AgNO3 (mM) | 0 | 0.5 | 0.75 | 1 | 1.25 | 1.5 |
| Final volume (ml) | 10 | 10 | 10 | 10 | 10 | 10 |
To optimize the duration of incubation required for the maximum synthesis of AgNPs, a third experiment was conducted in which synthesis of AgNPs was carried out with optimum levels of leaf extract volume and AgNO3 concentration. In this experiment, UV–visible absorption spectrum was studied in a range of 350–650 nm with 10 nm increments. The AgNPs synthesis was observed at different time intervals such as 10 min, 0.5 h, 1 h, 1.5 h, 2 h, 2.5 h and 3 h.
2.4. Purification of synthesized AgNPs
The AgNPs solution obtained using optimal leaf extract volume and optimal concentration of AgNO3 at optimal duration was purified to remove the water-soluble biomolecules. The solution of AgNPs was spun at 10000 rpm for 15 min and the pellet was re-dispersed in acetone. The AgNPs were air dried and refrigerated at 4 °C for characterization studies. For studies on antioxidant activity, 5mg dry powder of AgNPs was dissolved in 100μl of distilled H2O to arrive at a concentration of 50 μg μl−1.
2.5. Estimation of antioxidant potential
DPPH assay was performed to estimate the antioxidant potential of AgNPs and leaf extracts. Here, 2 ml of 0.63 mM DPPH methanol solution was mixed with 2 ml distilled water (control) or 2 ml sample (AgNPs solution/leaf extract). Then, the mixture was vortexed and incubated for 0.5 h in the dark at room temperature in the dark. Because of the DPPH radical scavenging activity of the samples, the colour of the solution changed to yellow from violet. The optical density of the solution was then studied at 517 nm. Ascorbic acid (60 μg ml−1) was employed as a reference standard.
The percentage of the DPPH radical scavenging activity was calculated as:

where Absorbance of control is the absorbance by DPPH + H2O, Absorbance of sample is the absorbance by DPPH + sample (leaf extract or AgNPs solution).
2.6. Characterization using XRD, FTIR and SEM
XRD provides information on crystal structure, composition and crystalline grain size of the synthesized AgNPs. This technique is also employed to identify unknown compounds by comparing the data on diffraction against a data archive of the International Centre for Diffraction Data (ICDD). In the present work, the crystalline structure of AgNPs was investigated using XRD-7000 diffractometer (Shimadzu) fitted with Cu Kα radiation with a scan range of 20 ° to 80 ° (λ = 1.5406 Å). The size of the crystallite domain was computed from the XRD peaks width using the Scherrer's formula, considering that they are free from non-uniform strains (Jemal et al 2017).

Where D is particle diameter size, k is Scherrer constant (0.94), λ is the x-ray radiation wavelength (if use Copper radiation Kα, 0.154 nm), β is the full width half maximum of the XRD peak at the diffraction angle θ, and θ is the Bragg diffraction angle.
Nanoparticle surface chemistry and possible functional groups in O. sanctum L. leaf extract that might have roles in AgNPs synthesis and stability were examined employing FTIR spectroscopy. The instrument used for this purpose was Shimadzu IR-Affinity-1S FTIR spectrophotometer, that was recording the spectrum between 400 to 4000 cm−1. SEM helps to get data on the shape, size and size distribution of nanoparticles. SEM (JSM-6610, Jeol, Tokyo, Japan) was used to determine the morphology and the shape of the AgNPs.
2.7. Statistical analysis
Leaf extract preparation, AgNPs synthesis and DPPH assay were carried out in triplicates. Critical difference (CD) values were computed at 1% level to see if there are statistically significant differences among treatments. In addition, coefficient of variation (CV %) was calculated. Data analysis was done using Web Agri Stat Package 2.0 (https://ccari.icar.gov.in/wasp2.0/index.php).
3. Results
3.1. Optimum leaf extract volume for maximum AgNPs synthesis
It can be seen in figure 1 that the test tube with 0 ml leaf extract (1 mM AgNO3 solution alone) did not have any colour and hence, did not give any peak (figure 2). When varying volumes of the leaf extract was blended with colourless AgNO3 solution to a final 1 mM concentration, the solution turned its colour after 0.5 h of incubation in dark. When 0.5 ml leaf extract was used, the solution turned its colour to yellow. When 0.75 ml leaf extract was used, the colour became light brown; 1 ml leaf extract resulted in brown colour. Both 1.25 ml and 1.5 ml resulted in dark brown colour. In other words, the colour intensity increased with an increase in leaf extract volume.

Figure 1. Photograph showing the colour change due to AgNPs synthesized using varying volumes of aqueous leaf extracts (0–1.5 ml) of O. sanctum.
Download figure:
Standard image High-resolution image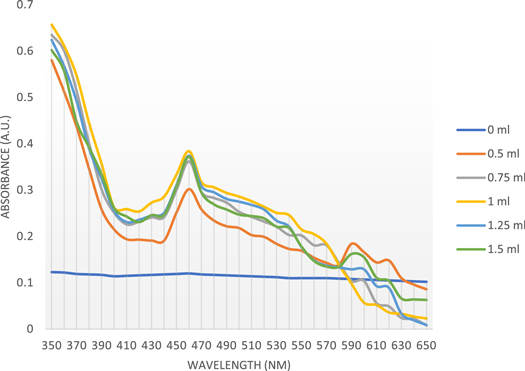
Figure 2. Effect of varying volumes of leaf extracts of O. sanctum on AgNPs synthesis.
Download figure:
Standard image High-resolution imageThe effect of varying volumes of leaf extract of O. sanctum on AgNPs synthesis was studied using UV–Vis spectroscopic analysis (figure 2). The data revealed that the surface plasmon resonance (SPR) band occurred at 460 nm and changed in intensity with a change in leaf extract volume, without any shift in the wavelength. In this way, UV–Vis absorption spectrum proved that there was AgNPs synthesis. Figure 2 illustrates that 1 ml of leaf extract is optimum for the maximal synthesis of AgNPs.
3.2. Optimum AgNO3 concentration for maximum AgNPs synthesis
The test tube in figure 3 that contained only leaf extract (0 mM AgNO3), was light yellow in colour. The leaf extract alone did not give any peak (figure 4). When 1 ml of leaf extract was mixed with AgNO3 solution to a final concentration ranging from 0.5 to 1.5 mM, the colour of the solution turned, ranging from yellow to dark brown, after 0.5 h of incubation in dark (figure 3). The colour intensity increased with a rise in AgNO3 concentration.

Figure 3. Photograph showing the colour change due to AgNPs synthesized using varying concentrations of AgNO3 (0 mM–1.5 mM).
Download figure:
Standard image High-resolution image
Figure 4. Influence of different concentrations of AgNO3 on AgNPs synthesis.
Download figure:
Standard image High-resolution imageThe influence of varying concentrations of AgNO3 on AgNPs synthesis was investigated (figure 4) using UV–vis absorption spectrum. The SPR band occurred at 460 nm and gradually changed in intensity with a change in AgNO3 concentration, without any shift in the wavelength. Thus, AgNPs synthesis was proved. It can be deduced from figure 4 that 1 mM AgNO3 is optimum for the maximal synthesis of AgNPs.
It is imperative to note that no peak was observed when either 1 mM AgNO3 solution alone or leaf extract alone was used (figures 2 & 4). However, when the leaf extract was mixed with AgNO3 solution, an absorption maximum was observed at 460 nm. This therefore, proved the synthesis of AgNPs.
3.3. Optimum duration for maximum AgNPs synthesis
The effect of incubating 1 ml leaf extract in 1 mM AgNO3 in dark for varying durations on AgNPs synthesis was studied using UV-Vis spectroscopic analysis (figure 5). It was observed that the band of SPR occurred at 460 nm and slowly increased in intensity as duration of incubation increases, with no change in the wavelength of absorption. It can be inferred from figure 5 that 2.5 h is the optimum incubation duration for the maximal AgNPs synthesis. Colour intensity rose with an increase in incubation period and in the end, the colour changed to dark brown (figure 6).

Figure 5. Effect of varying incubation durations on AgNPs synthesis.
Download figure:
Standard image High-resolution image
Figure 6. Photograph showing the colour change due to AgNPs synthesized by 1 ml leaf extract + 1 mM AgNO3 reaction mixture, incubated for varying durations (10 min − 3 h) in dark.
Download figure:
Standard image High-resolution image3.4. Antioxidant potential
The antioxidant potential of the leaf extract (50 μg μl−1), AgNPs (50 μg μl)−1 and ascorbic acid (60 μg ml−1) was determined using DPPH method (figure 7). It was found out in the current study that AgNPs exhibited better antioxidant potential compared to that of the leaf extract. The DPPH radical scavenging activity of ascorbic acid (standard) was significantly higher than that of the AgNPs.

Figure 7. DPPH radical scavenging activity of O. sanctum leaf extracts (50 μg μl−1), A−1g−1N−1P−1s−1 (50μg μl)−1 and Ascorbic acid (60 μg ml−1). Error bars indicate standard deviation from three separate experiments. There were noteworthy differences in antioxidant potential among leaf extract, AgNPs and ascorbic acid at P <0.01. CD (0.01) = 6.92; CV % = 2.97.
Download figure:
Standard image High-resolution image3.5. X-ray diffraction analysis
The peaks obtained in the XRD pattern of biosynthesized AgNPs are quite sharp and well-defined (figure 8), indicating the high crystalline nature of the AgNPs.

Figure 8. XRD pattern of drop-coated film of AgNPs.
Download figure:
Standard image High-resolution imageThe average size of the AgNPs was computed employing the Debye–Scherrer formula and the obtained result is presented in table 4. The average size of AgNPs was found to be 22 nm.
Table 4. Size of AgNPs from XRD data using Debye–Scherrer equation.
| 2θ of intense peak (degree) | θ of intense peak (degree) | Cos θ | FWHM (degree) | FWHM (radian) | hkl | Particle size(nm) |
|---|---|---|---|---|---|---|
| 27.84 | 13.92 | 0.971 | 0.369 | 0.0064 | 111 | 22.173 |
| 32.26 | 16.3 | 0.959 | 0.341 | 0.0056 | 200 | 24.299 |
| 38.15 | 19.07 | 0.945 | 0.607 | 0.0105 | 111 | 13.854 |
| 44.33 | 22.15 | 0.926 | 0.683 | 0.0119 | 200 | 12.561 |
| 46.26 | 23.13 | 0.919 | 0.354 | 0.0061 | 220 | 24.413 |
| 54.84 | 27.42 | 0.887 | 0.35 | 0.0061 | 311 | 25.583 |
| 57.5 | 28.75 | 0.876 | 0.36 | 0.0062 | 222 | 25.203 |
| 64.42 | 32.21 | 0.846 | 0.344 | 0.006 | 220 | 27.315 |
| 76.77 | 38.38 | 0.783 | 0.506 | 0.0088 | 420 | 20.054 |
| Average | 22 |
3.6. Fourier transform infrared spectroscopy analysis
This technique was performed to determine the biomolecules or functional groups that could play vital roles in synthesizing AgNPs. FTIR spectrum of biosynthesized AgNPs is illustrated in figure 9. The FTIR spectrum revealed major sharp absorption peaks at 1230, 1630 and 3310 cm−1.

Figure 9. FTIR spectrum of biosynthesized AgNPs.
Download figure:
Standard image High-resolution imageIR Spectrum table (https://www.sigmaaldrich.com/technical-documents/articles/biology/ir-spectrum-table.html) by Frequency Range was used to assign peaks to different functional groups. The absorption peak at region 3310 cm−1 corresponds to O-H stretching of alcohol. The absorption peak at 1630 cm−1 may represent C=C stretching of cyclic alkene, N-H bending of amine, C=C stretching of conjugated alkene or C=C stretching of alkene. The peak at 1230 cm−1 corresponds to C–N stretching of amine.
3.7. SEM analysis
SEM analysis exhibited the synthesis of high-density poly-dispersed AgNPs of several sizes (figure 10). The SEM images showed the synthesis of various structures of AgNPs viz. globular, cubic and flakes shaped. Most of the AgNPs aggregated and only a few of them were scattered. Some nanoparticles are larger.

Figure 10. SEM image of the synthesized AgNPs at different scales.
Download figure:
Standard image High-resolution image
4. Discussion
4.1. Leaf extract volume and AgNO3 concentration optimization
A change in colour owing to the mixing of AgNO3 solution and the leaf extract suggested the formation of AgNPs. When aqueous Ag+ ions are treated with leaf extract, there will be the reduction of Ag+ ions to Ag°; thus, synthesis of AgNPs takes place (Jemal et al 2017; R. M. Tripathi et al 2013). Extracts from Zea mays, Basella alba, Helianthus annus, Oryza sativa, Sorghum bicolor and Saccharum officinarum could be used to reduce silver (Leela & Vivekanandan 2008). There was a change in the colour due to the excitation of SPR of AgNPs (R. M. Tripathi et al 2013). When the free electrons oscillate in a metal particle, localized surface plasmon results (Noginov et al 2007). In the current investigation, the SPR band occurred at 460 nm and it was found that 1 mM AgNO3 and 1 ml leaf extract are optimum for the maximal synthesis of AgNPs. Optimum concentrations of AgNO3 to synthesize AgNPs employing an extract obtained from the bark of Acacia nilotica, were found to be both 0.1 M and 3 mM (Zubair et al 2022). In line with the current study, the optimum concentration of AgNO3 to synthesize AgNPs using the aqueous Citruslimon zest extract was determined to be 1 mM (Khane et al 2022).
Similar to the current study, a peak was noticed for the AgNPs made employing the aqueous leaf extracts of Iresine herbstii at 460 nm (Dipankar & Murugan 2012). AgNPs were synthesized using an aqueous leaf extract of Azadirachta indica (A. Tripathi et al 2009) and a maximum absorbance between 440 and 500 nm was observed. Many scientists reported the SPR band at various wavelengths (table 5) for the AgNPs synthesized using O. sanctum extracts. Such differences could be attributed to the variations in the plant source, plant age, per cent leaf extract used, extraction conditions and the ratio of leaf extract volume mixed with AgNO3 solution (table 1).
Table 5. Synthesis of AgNPs using O. sanctum in the current and previous studies.
| Publications | Ag SPR band | Optimum duration for AgNPs synthesis |
|---|---|---|
| Current study | 460 nm | 2.5 h |
| (Mallikarjuna et al 2011) | 436 nm | 60 min |
| (Ramteke et al 2013) | 450 nm | 60 min |
| (M. Z. H. Khan et al 2017) | ∼ 450 nm | 75 min at 60 °C |
| (Malapermal et al 2017) | 439 nm | 36 h |
| (Yadav et al 2018) | 427 nm | 20 min at 60 °C |
| (Jacob et al 2019) | 428 nm | Not studied |
| (Baruah et al 2021) | 400–450 nm | After ∼ 24 h |
The patterns of the SPR are due to certain attributes of nanoparticles such as their size, particles adsorbed on their surface, molecules that help in their stabilization and medium's dielectric constant (Nithya Deva Krupa & Raghavan 2014). Spherical nanoparticles result in one SPR band, while anisotropic molecules result in 2 or more SPR bands (Krishnaraj et al 2010). As a single major SPR band was observed in the current investigation, the AgNPs formed are most likely of spherical nature.
4.2. Optimizing duration of incubation
It was observed in the present study that 2.5 h is the ideal incubation duration to synthesize maximum AgNPs. The optimum duration to synthesize AgNPs employing various plant extracts ranged from few minutes to several hours.
It was reported that 30 min of incubation was enough for synthesizing AgNPs employing the root extract of Helicteres isora (Bhakya et al 2016), while maximum AgNPs synthesis employing Aegle marmelos fruit extract occurred owing to 24 h of incubation (Nithya Deva Krupa & Raghavan 2014). Even among the AgNPs synthesized using O. sanctum extracts in various studies, variations in terms of optimum incubation period were observed (table 4) which might be due to differences in the sources/ages of plants used, extraction conditions etc. as shown in table 1. Finding an optimum duration is necessary since AgNPs agglomerate beyond the optimum incubation period, thus may lead to bigger particles sizes (Veerasamy et al 2011).
4.3. Antioxidant potential
During the normal metabolism of the cell, harmful byproducts known as free radicals are generated. The free radicals damage the biomolecules viz. proteins, lipoproteins and nucleotides, thus lead to inflammation, brain ischemia, cancer, physiological aging, mutagenesis and dementia (Ren et al 2001). It was suggested that exogenous antioxidant compounds can help to cure diseases and degenerative processes triggered by free radicals (Acker et al 2009). Hence, evaluation of the antioxidant activity of AgNPs was performed in the present study. It was observed that AgNPs made employing the leaf extract of O. sanctum had 1.65-fold higher antioxidant potential than that of the O. sanctum leaf extract. Moreover, AgNPs showed 75% of the antioxidant potential of ascorbic acid. These results strongly recommend the application of AgNPs as useful effective antioxidants in the treatment of various oxidative stresses related with degenerative diseases.
4.4. XRD analysis of AgNPs
In the current study, the intense peaks (figure 8) observed at 2θ angles of 27.84°, 32.26°, 38.15°, 46.26°, 54.84°, 64.42°, and 76.77° correspond to 111, 200, 111, 220, 311, 220 and 420 Bragg's reflection, respectively. According to ICDD card no. 004–0783, these diffraction peaks are in line with face-centered cubic structure. The intense Braff reflections indicate firm x-ray scatterings that center in the crystalline AgNPs, and this is likely because of capping agents (Haldar et al 2013). A small number of unassigned peaks are identified near the representative peaks, indicating that the bioorganic phase adsorbed on the AgNPs crystallized (Amargeetha & Velavan 2018). Thus, the XRD study confirmed the successful synthesis of the face-centered cubic structured AgNPs using O. sanctum leaf extract and the current XRD results are well correlated with the existing literature (Boken et al 2014; Gecer et al 2022; Mallikarjuna et al 2011; Rout et al 2012; Singhal et al 2011). Based on Debye–Scherrer formula, the AgNPs size was determined to be 22 nm.
4.5. FTIR analysis of AgNPs
The major peaks at 1230, 1630 and 3310 cm−1 (figure 9) observed in the present study signify that plant molecules act as capping agents that were bound on AgNPs. It can be inferred from the data obtained that amines, alcohols and alkenes existing in the extracts obtained from the leaves of O. sanctum play vital roles in AgNP synthesis. Carbonyl groups present in proteins and amino acids can bind metal strongly, showing that proteins are able to act as capping agents that bound on AgNPs surface (Sathyavathi et al 2010). This indicates that biomolecules likely carry out the synthesis and stabilization of AgNPs in a medium of aqueous nature. The results of the current investigation are in agreement with those reported in the literature (M. Z. H. Khan et al 2017; N. S. Khan et al 2015; Venkat Kumar et al 2017).
4.6. SEM observation of AgNPs
Formation of AgNPs with different shapes might be due to various biomolecules from the leaf extracts acting as capping agents on AgNPs surface. This is corroborated by the shifts and variations in peak areas observed in the FTIR study (figure 9). The average grain or particles size of the scattered AgNPs was determined by using ImageJ software and it was close to 20 nm, which matches with the XRD result of the current study (table 4). Few AgNPs are relatively bigger due to the aggregation of AgNPs that occurs because of their extreme surface tension and extreme surface energy. Similar phenomenon was reported earlier (M. Z. H. Khan et al 2017; N. S. Khan et al 2015; Rout et al 2012).
5. Conclusions
In this work, green synthesis of AgNPs was optimized employing an aqueous leaf extract of O. sanctum. Ideal conditions for the maximum AgNPs synthesis were found to be leaf extract volume of 1 ml, AgNO3 solution of 1 mM concentration and 2.5 h of incubation in dark. The occurrence of biosynthesized AgNPs was proved using UV-visible spectrophotometry at 460 nm. The biosynthesized AgNPs exhibited 1.65-fold higher antioxidant activity than that of the leaf extract. XRD study proved that the AgNPs are crystalline. The size of the AgNPs was 22 nm as determined by XRD. FTIR spectrum proved the existence of different functional groups which could work as capping agents on AgNPs surface. SEM analysis revealed the formation of AgNPs with different shapes such as spherical, cubic shaped, and flakes. SEM study revealed that many AgNPs coalesced and a small number of AgNPs were dispersed. Further studies on acute toxicology in invertebrate models are expected to provide more information on the dosage of AgNPs for various applications.
Acknowledgments
The authors thank Adama Science and Technology University, Ethiopia for XRD and SEM analyses. The authors also thank Addis Ababa University (Arat Kilo Campus), Ethiopia for FTIR Spectroscopy analysis.
Data availability statement
The data that support the findings of this study are available upon reasonable request from the authors.
Funding
The authors declare that no funds were received for this study.
Conflict of interest
The authors declare that they have no conflict of interest.
Ethical approval
This article does not contain any studies with human participants or animals performed by any of the authors.
Author contributions
Melkamu collected literature, performed lab experiment and collected the results. Jeyaramraja conceived the idea, analyzed the data and prepared the manuscript. Paulos contributed in the characterization of AgNPs using XRD, FTIR and SEM. All the authors read and approved the final manuscript.