

Abstract
Silver nanoparticles (AgNPs) are an important class of nanomaterials, which have used as antimicrobial and disinfectant agents due to their detrimental effect on target cells. In the present study it was explored to deliver a novel tamoxifen drug system that can be used in breast cancer treatment, based on chitosan coated silver nanoparticles on MCF-7 human breast cancer cells. AgNPs synthesized from Adenia hondala tuber extract were used to make the chitosan coated AgNPs (Ch-AgNPs), in which the drug tamoxifen was loaded on chitosan coated silver nanoparticles (Tam-Ch-AgNPs) to construct drug loaded nanoparticles as drug delivery system. The morphology and characteristics of the Ch-AgNPs were investigated by UV, FTIR, zeta potential and FESEM. Furthermore, the toxicity of AgNPs, Ch-AgNPs, Tam-Ch-AgNPs was evaluated through cell viability, lactate dehydrogenase leakage, reactive oxygen species generation, caspase-3, DNA laddering, and TUNEL assay in human breast cancer cells (MCF-7) and HBL-100 continuous cell line as a control. Treatment of cancer cells with various concentrations of AgNPs, Ch-AgNPs, Tam-Ch-AgNPs for 24 h revealed that Tam-Ch-AgNPs could inhibit cell viability and induce significant membrane leakage in a dose-dependent manner. Cells exposed to Tam-Ch-AgNPs showed increased reactive oxygen species and hydroxyl radical production when compared to AgNPs, Ch-AgNPs. Furthermore, the apoptotic effects of AgNPs, Ch-AgNPs, Tam-Ch-AgNPs were confirmed by activation of caspase-3 and DNA nuclear fragmentation. The present findings suggest that Tam-Ch-AgNPs could contribute to the development of a suitable anticancer drug delivery.
Export citation and abstract BibTeX RIS

Original content from this work may be used under the terms of the Creative Commons Attribution 3.0 licence. Any further distribution of this work must maintain attribution to the author(s) and the title of the work, journal citation and DOI.
1. Introduction
Breast cancer is one of the most common cancers in women; nearly 1.7 million new women worldwide are diagnosed with breast cancer. Although there have been significant advances in breast cancer treatment over the past several decades, current therapeutic approaches are limited by non-specific systemic distribution, inadequate drug concentrations reaching the tumor and multidrug resistance. The application of nanotechnology to medicine helps to overcome limitations relating to chemotherapy. Nanoparticles with enhanced surface properties are able to diffuse with greater ease inside the tumour cells delivering a high amount of drug selectively to tumor cells with significant reduced toxicity. In the near future, the use of nanotechnology could revolutionize the concept of breast cancer treatment [1].
The design of metal nanoparticles/polymer composites has attracted much attention in the last few years due to their wide range of applications, for example as catalysts and in the biomedical field [2]. Many of these nanocomposites use a polymer as a stabilizer and supporting material. Considering the potential of such polymer composites for biological applications [3], it is very surprising that the number of metal nanoparticles/bio-polymer networks reported so far is very limited.
Chitosan is a polysaccharide [4], which is biocompatible, can be degraded by enzymes in human body, the degradation products are nontoxic. Commercial chitosan is a semi-crystalline polymer and crystallinity plays an important role in adsorption efficiency [5] which exhibits a broad spectrum of antimicrobial activity by binding to the negatively charged bacterial cell wall followed by attachment to the DNA, inhibiting its replication. For the improvement of bioactivity on chitosan, it is often combined to other bioactive materials, such as drugs.
Silver nanoparticles (AgNPs) have high therapeutic potential and exhibit good antimicrobial activity. AgNPs have a wide range of antimicrobial activities and exhibit high performance even at a very low concentration. Therapeutic uses of these NPs are safe, free from side effects and effective in a variety of diseases [6]. AgNPs have been identified to possess good potential for the treatment of cancer [7]. But the major disadvantage of using silver alone is that it is not specific at targeting the cancer cells and also it is toxic to the normal cells when exposed for a longer time when the size of silver used is >20 nm [8].
Chitosan-silver (Ch-Ag) nanocomposite is one of the rare composite materials that are seen to possess a capability of being used as a biosensor as well as in the treatment of cancer as the chitosan present in the nanocomposite, which is very specific to the cancer cells. It prolongs the action of silver on the affected cells while preventing the normal cell from the effect of silver. One more advantage of this nanocomposite is the biodegradability, making it suitable for the treatment of cancer. Apart from the treatment of cancer, the nanocomposite also possesses good antimicrobial [9] and biosensing activity.
In view of these developments, the aim of this paper was to explore a novel drug delivery system based on chitosan coated silver nanoparticles, which is synthesized from Adenia hondala that are chemically stable, environmentally friendly and non-cytotoxic. This could provide simple and easy way to enable intelligently controlled release of drug and enhance its chemotherapeutic efficiency. This work is mainly designed for the drug tamoxifen delivery system with chitosan coated AgNPs for stimuli-sensitive drug delivery system. We previously demonstrated the synthesis and characterization of AgNPs using Adenia hondala tuber extract [10]. AgNPs synthesized by this process were used to make the chitosan coated AgNPs (Ch-AgNPs), since the size of the AgNPs could be easily controlled without the use or production of hazardous materials. Tamoxifen was loaded on chitosan coated silver nanoparticles (Tam-Ch-AgNPs) to construct drug loaded particles as drug delivery system. The morphology and characteristic of the Ch-AgNPs were studied by UV–Vis spectroscopy, Fourier transform infrared spectroscopy (FTIR), zeta potential and scanning electron microscopy (SEM). The drug loading and drug release efficacy of Tam-Ch-AgNPs were investigated. The cytotoxic effect of AgNPs, Ch-AgNPs and Tam-Ch-AgNPs was investigated with series of assays such as lactate dehydrogenase (LDH) leakage, reactive oxygen species (ROS) generation, caspase-3 activity, DNA fragmentation and terminal deoxynucleotidyl transferase deoxyuridine triphosphate nick-end labeling (TUNEL) assay against MCF-7 breast cancer cell line and HBL-100 normal breast cell line.
2. Materials and methods
The human breast cancer cell line (MCF-7) and epithelial continuous cell line (HBL-100) was procured from National Centre for Cell Science (NCCS, Pune). Water soluble chitosan (purified viscosity grade 50 cps; molecular weight (MW) 150 kDa; deacetylation degree 85%), 3-(4, 5 dimethylthiazolyl-2)-2, 5-diphenyltetrazolium bromide (MTT), fluorescent iso-thiocynate (FITC), propidium iodide (PI), PCR 50–2000 bp marker for electrophoresis of PCR fragments was purchased from Sigma–Aldrich (Bangalore). Analytical grade reagents were purchased from Sigma Aldrich (Bangalore). All the samples were prepared in milli-Q water.
2.1. Drug loaded polymer coated AgNPs
Chitosan solution (100 µl, 10 mg ml−1) was mixed with AgNPs solution (0.25–4.5 ml) and 40 µl of 5 M NaOH at room temperature, followed by vigorous stirring to precipitate the Ch-AgNPs. The obtained Ch-AgNPs were centrifuged at 6000 rpm for 10 min. The supernatant was analyzed using a UV visible spectrometer (JASCO V-630, Tokyo, Japan) to estimate the amount of unreacted AgNPs. Centrifuged composites were washed with 1 ml PBS, followed by centrifugation at 6000 rpm for 10 min. The washing process was repeated twice. The washed Ch-AgNPs were suspended in 250 µl PBS. Synthesis of the Ch-AgNPs composites was carried out in a laminar flow cabinet to prevent biological contamination. Tamoxifen loaded chitosan coated AgNPs were prepared by incubating 2.5 mg of Ch-AgNPs overnight in 1 ml of tamoxifen solution (0.2 mg ml−1).
2.2. Characterization of drug loaded polymer coated silver nanoparticles
2.2.1. Microscopic observations.
The surface morphology of Ch-AgNPs was observed using a HITACHI-SU 6600 FESEM. SEM specimens of the composites were prepared by casting 5 µl of a water dispersion of the Ch-AgNPs, followed by drying at room temperature. Osmium plasma coating was conducted to enhance the conductivity of the specimens. Dried samples were coated using a plasma multi-coater PMC-5000 (Meiwafosis Co., Ltd, Tokyo, Japan)
2.2.2. FTIR studies and zeta potential.
FTIR spectra of AgNPs, chitosan, Ch-AgNPs, tamoxifen and Tam-Ch-AgNPs were recorded on a Jasco, FTIR-430 (Japan). About 2 mg of the samples were ground thoroughly with KBr and the pellets were prepared using a hydraulic press under a pressure of 600 kg cm−2. Spectra were scanned between 500 and 4000 cm−1. The particle sizes were measured by electrophoretic laser Doppler anemometry, using a zeta potential analyzer (Brookhaven Instruments Corporation, USA). The samples were diluted 1:15 with distilled water prior to measurement.
2.2.3. Drug loading and encapsulation efficiency.
The drug loading efficacy was calculated by two ways, first based on indirect method by estimating the drug content of the supernatant and second based on direct estimation of the drug content present in the pellet obtained after centrifugation. The drug concentration in supernatant and redispersed pellets were determined by measurements of its UV absorbance at 254 nm using UV–visible spectroscopy and the percentage loading of drug onto nanoparticles was estimated by the following formulae [11]


where W0 is the weight of drug enveloped in the chitosan coated silver nanoparticles, W and W1 are the weights of chitosan coated silver nanoparticles and the drug added in the system, respectively
2.2.4. Drug release study (in vitro).
The efficiency of drug tamoxifen released from nanoparticles was investigated based on its pH. The experiments were carried out at three different pH, at PH 4.0 (approximate pH in endosomes or lysosomes), pH 6.0 (pH of the environment around the tumor), and pH 7.4 (pH of physiological blood). Tamoxifen-loaded chitosan coated silver nanoparticles were dispersed in phosphate-buffered saline (PBS) (pH 7.4, 5 ml) and transferred into a dialysis bag (Spectra/Por, Spectrum Laboratories, Inc., Rancho Dominguez, CA). The dialysis bag was then immersed in 95 ml of PBS at pH 5.0, 6.0 or 7.4. The release medium was continuously agitated with a stirrer at 37 °C. At predetermined time intervals, 2 ml of the external medium was collected and replaced with the same fresh PBS. The amount of released tamoxifen in the medium was then determined at 254 nm [12].
2.3. Cytotoxic studies
MCF-7 and HBL 100 cells were grown adherently and maintained in Dulbecco's modified eagle medium (DMEM) containing 10% fetal calf serum and 1% antibiotic solution containing penicillin and streptomycin at 37 °C in 5% CO2. All the experiments were performed in six well plates, unless stated otherwise. Cells were seeded onto the plates at a density of 1 × 10⁶ cells per well and incubated for 24 h prior to the experiments. The cells were washed with PBS, pH 7.4.
Cell viability was measured using the 3-[4, 5-dimethylthiazol-2-yl]-2,5-diphenyltetrazoilum bromide (MTT) dye reduction assay to determine the cytotoxic effect of AgNPs, Ch-AgNPs, Tam-Ch-AgNPs at various concentrations. Briefly, cells were plated onto 96-well flat-bottom culture plates with various concentrations (20–100 µg ml−1). All cultures were incubated for 24 h at 37 °C in a humidified incubator. After 24 h of incubation (37 °C, 5% CO2 in a humid atmosphere), 10 µl of MTT (5 mg ml−1 in PBS) was added to each well, and the plate was incubated for a further 4 h at 37 °C. The resulting formazon was dissolved in 100 µl of dimethyl sulfoxide with gentle shaking at 37 °C, and absorbance was measured at 595 nm with an enzyme linked immunosorbent assay reader (SpectraMAx; molecular devices, Sunnyvalc, CA, USA). The results were given as the means of three independent experiments. Concentrations of samples showing a 50% reduction in cell viability (i.e. half-maximal inhibitory concentration (IC50) values) were then calculated.
2.4. Membrane integrity
Cell-membrane integrity of MCF-7 cells was evaluated by determining the activity of LDH leaking out of the cell according to the manufacturer's instructions (TOX7 in vitro toxicology assay kit, Sigma Aldrich). The LDH assay is based on the release of the cytosolic enzyme LDH from cells with damaged cellular membranes. Thus, in cell culture, the course of AgNPs, Ch-AgNPs, Tam-Ch-AgNPs induced cytotoxicity was followed quantitatively by measuring the activity of LDH in the supernatant. Briefly, cells were exposed to various concentrations of AgNPs for 24 h, and then 100 µl per well of each cell-free supernatant was transferred in triplicate into wells in a 96-well plate, and 100 µl of LDH-assay reaction mixture was added to each well. After 3 h incubation under standard conditions, the optical density of the color generated was determined at a wavelength of 490 nm using a microplate reader.
2.5. Determination of ROS
Intracellular ROS were measured based on the intracellular peroxide-dependent oxidation of 2',7'-dichlorodihydro fluorescein diacetate (DCFH-DA, Life Technologies) to form the fluorescent compound 2',7'-dichlorofluorescein (DCF). Cells were seeded onto 24-well plates at a density of 5 × 10⁴ cells per well and cultured for 24 h. After washing twice with PBS, fresh medium containing 6 µg ml−1 of AgNPs, Ch-AgNPs, Tam-Ch-AgNPs and 1 µM doxorubicin was added as positive control, and the cells incubated for 24 h. For the control, 20 µM of DCFH-DA was added to the cells, and incubation continued for 30 min at 37 °C. The cells were rinsed with PBS, 2 ml of PBS was added to each well, and fluorescence intensity was determined with a spectrofluorometer (Gemini EM, molecular devices) with excitation at 485 nm and emission at 530 nm.
2.6. DNA laddering
MCF-7 (106 cells ml−1) were seeded in six-well microplates and treated with 6 µg ml−1 of AgNPs, Ch-AgNPs, Tam-Ch-AgNPs. After 24 h of treatment, the culture medium was removed and the cells harvested by scraping with 1 ml of PBS and lysed with 500 µl of lysis buffer (20 mM tris-HCl with pH 8.0, 5 mM ethylenediaminetetraacetic acid (EDTA), 400 mM NaCl, 1% sodium dodecyl sulfate, and 10 mg ml−1 proteinase K) for 1 h at 55 °C. Fragmented DNA was extracted with phenol/chloroform/isoamyl alcohol (25:24:1 v/v/v), precipitated with ethanol, and resuspended in tris-EDTA buffer (TE, pH 8.0) containing 20 µg ml−1 RNase A. For quantitative analyses of DNA content, an equal amount of DNA was loaded and run on a 1.0% agarose gel containing 1 µg ml−1 ethidium bromide at 80 V, and the DNA fragments were visualized by exposing the gel to UV light, followed by photography.
2.7. Apoptosis
2.7.1. Apoptosis by TUNEL assay.
Apoptotic DNA fragmentation was also detected by using a DNA fragmentation imaging kit (Roche, Basel, Switzerland), following the manufacturer's instructions. Based on the terminal deoxynucleotidyl transferase deoxyuridine TUNEL reaction, fluorescence detection of cells with apoptotic DNA strand breaks was performed. To examine total cell numbers, nuclei were labelled simultaneously with 4',6-diamidino-2-phenylindole. Merged images of both channels were shown using a fluorescence microscope (Olympus, Tokyo, Japan) at 100× magnifications.
2.7.2. AO/EtBr staining.
MCF-7 cells and HBL-100 were grown (1 × 10⁵ cells/cover slip) and incubated with AgNPs, Ch-AgNPs, Tam-Ch-AgNPs at their IC50 concentration and then they were fixed in methanol:acetic acid (3:1, v/v). The cover slips were gently mounted on glass slides for the morphometric analysis. Morphological changes of MCF-7 and HBL-100 cells were analyzed under the Nikon (Japan) bright field inverted light microscopy at 40× magnification. Approximately 5 µl of dye mixture (100 mg ml−1 acridine orange (AO) and 100 mg ml−1 ethidium bromide (EtBr) was mixed with 9 ml of cell suspension (1 × 10⁵ cells ml−1) on a clean microscopic cover slip. After incubation for 2–3 min, cells were visualized under fluorescence microscope (Nikon Eclipse, Inc., Japan) at 40× magnification with excitation filter at 510–590 nm. Percentage of apoptotic cells was determined by the following formula

where Nt is total number of apoptotic cells, N is total number of normal and apoptotic cells.
2.7.3. DAPI staining.
MCF-7 cells were treated with the above methods for 48 h, and then fixed with methanol: acetic acid (3:1, v/v) prior to washing with PBS. The washed cells were then stained with 1 mg ml−1 4,6-diamidino-2-phenylindole, dihydrochloride (DAPI) for 20 min in the dark. Stained images were recorded with fluorescent microscope with appropriate excitation filter.
2.7.4. Rhodamine staining.
Staining of filamentous or F-actin with rhodamine phalloidin was performed to observe actin filament organization. In brief, 1 × 10³ cells were seeded onto cover slips placed in 6-well plates. After 2 days in culture, the media were removed, and the cover slips containing the cells were washed with PBS; permeabilized with a mixture 10X PBS, triton X-100, and paraformaldehyde; and stained. Cells were visualized and photographed with an Olympus BX60 fluorescent microscope. Cells in randomly selected fields were counted and scored according to the presence or absence of staining of the cell periphery.
2.8. Caspase-3 activity
For gene expression analysis, MCF-7 cells (2 × 10⁵ cells/well in a 6-well plate) were grown for 24 h and subsequently treated with required amount of AgNPs, Ch-AgNPs, Tam-Ch-AgNPs. Expression of apoptotic signalling gene caspase-3, was examined using reverse transcriptase-polymerase chain reaction (RT-PCR). The housekeeping gene β-actin was used as internal control. Total RNA was isolated from entire cell population in each well using Tri reagent (Sigma-Aldrich, USA). cDNA was generated from total denatured RNA (3 µg) by reverse transcription performed at 37 °C for 50 min using M-MLV reverse transcriptase (Sigma-Aldrich, USA) in a total mixture of 20 µl. Initial denaturation (94 °C for 2 min) was followed by a PCR cycle of denaturation (94 °C for 15 s), annealing (55 °C for 30 s), extension (68 °C for 1 min), and final extension (68 °C for 5 m). The PCR products were finally resolved on a 1.2% agarose gel and visualized by ethidium bromide staining under UV light. For real time PCR reaction, reactions were performed with 2 µl of cDNA sample in a total volume of 25 µl including SYBR Green PCR master mix (Applied Biosystems, CA) according to manufacturer's instructions. Amplification was carried out in an Applied Biosystems 7500 real time PCR system, with cycle parameters as the initial denaturation (95 °C for 10 min) (for activation of ampli-taq gold present in SYBR Green PCR master mix) was followed by a PCR cycle of denaturation (94 °C for 15 s), annealing (55 °C for 30 s), extension (68 °C for 1 min), and final extension (68 °C for 5 m). The PCR products were finally resolved on a 1.2% agarose gel and visualized by ethidium bromide staining under UV light. Each PCR reaction was performed in triplicate. Relative quantification of the target gene transcripts normalized to endogenous control β-actin and relative to a calibrator (non treated control cells) was calculated by SDS software (provided with the Applied Biosystems 7500 real time PCR system) based on ΔΔCt method. Thus the gene expression in control sample has a value of 1 and expression in treated sample is expressed as an n-fold difference relative to control. The primers used were β-actin forward: 5'-CTGTCTGGCGGCACCACCAT-3' and reverse: 5'-GCAACTAAGTCATAGTCCGC-3' and caspase 3 forward: 5'-TTTGTTTGTGTGCTTCTGAGCC-3' and reverse: 5' ATTCTGTTGCCACCTTTCGG-3'
3. Results and discussion
AgNPs were coated with the polymer chitosan at different concentrations (100, 200, 300, 400 and 500 mg ml−1) by mixing a chitosan acidic aqueous solution with an AgNPs suspension. Chitosan is water soluble in acidic condition due to the protonation of primary amines in the chitosan chains. The AgNPs suspension is acidic (pH 5.23–6.25) in nature [13]. Although the acidity of these two solutions was maintained during mixing, partial precipitation of polymer coated silver nanoparticles were observed at all conditions, suggesting that decreased solubility of the chitosan chains was induced by the binding of silver nanoparticles to the amino and hydroxyl groups of chitosan [14]. Addition of excess NaOH completely precipitated the composite. Figure 1 shows the UV–Vis spectra of the original AgNPs suspension and of the post reaction mixture of AgNPps and chitosan at different concentrations (100–500 mg ml−1). Since AgNPs provide a peak near 400 nm, the absence of this peak shows that the AgNPs are not present in the supernatant of the post reaction mixture and that the AgNPs were completely bound to the chitosan.

Figure 1. UV visible spectra of the AgNPs and the mixture of AgNPs with chitosan at different concentrations of 100, 200, 300, 400 and 500 mg ml−1.
Download figure:
Standard image High-resolution imageThe surface morphology of AgNP coated with chitosan was analyzed using the field emission scanning electron microscope (FESEM) technique. The FESEM image of chitosan shows that the particles are in the form of bundles with leaf morphology (figure 2(a)). The FESEM image (figure 2(b)) of silver nanoparticles shows cubical shaped particles. The size of the particles is seen to be almost uniform. The FESEM image (figure 2(c)) of chitosan coated AgNP shows a mixture of chitosan and Ag wherein the silver nanoparticles are seen to be enveloped by the chitosan polymer.

Figure 2. Field emission scanning electron microscopy images of (a) chitosan shows leaf morphology, (b) silver nanoparticles shows cubical shaped particles, (c) chitosan coated AgNP and (d) well dispersed synthesized composite.
Download figure:
Standard image High-resolution imageThe synthesized particles are in the form of aggregates. Prepared nanoparticles showed low dispersibility and high stability. The reduction of agglomeration is seen to occur while the chitosan is allowed to dissolve for a longer duration of time, followed by the dispersion of silver nanoparticles in the chitosan solution for about an hour before the process of reduction. The FESEM image of such a well dispersed and stabilized synthesized composite is shown in figure 2. It is observed that the silver nanoparticles are embedded in a matrix of chitosan and also that the size of the composite is confined to the nano range.
The polymer coated AgNPs, has been characterized by FTIR spectra analysis. The FTIR spectra of AgNPs, chitosan and chitosan coated AgNPs are compared in figure 3. The overlapped spectra were observed between AgNPs and chitosan coated AgNPs. The characteristic amide I (due to C=O stretching) and amide II bands (out of phase combination in NH in plane bending and CN stretching) of AgNPs are observed as broad peak around 1658.78 cm−1 and 1597.06 cm−1, respectively. In case of chitosan (dry powder) the peaks at around 1643.59 cm−1 and 1556.16 cm−1 are assigned as amide I and amide II bands. The presence of these two amide bands of both AgNPs and chitosan is expected in the FTIR spectra of chitosan coated AgNPs, which are observed at around 1639.49 cm−1 and 1564.27 cm−1. Amide III band (in-phase combination of NH in- plane bending and CN stretching) at around 1413.82 cm−1 is enhanced in FTIR spectra.
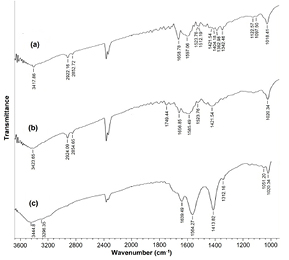
Figure 3. The FTIR spectra of (a) AgNPs, (b) chitosan and (c) chitosan coated AgNPs.
Download figure:
Standard image High-resolution imageSpectra of polymer coated AgNPs, which is an indication of formation of amide bonds between carboxylate groups of AgNPs and amine moieties of CH contributing to the C–H stretching. Hence, apart from electrostatic interaction, covalent bond contributes to the stability and assembly. The peak at around 1421.54 cm−1 corresponding to CH2 bending in AgNPs is preserved in the FTIR spectra of polymer coated AgNPs. The band at around 1023.30 cm−1 is from the saccharide structure of chitosan, which is observed at around 1020.34 cm−1 in the case of chitosan coated AgNPs. The comparison of the FTIR spectra of chitosan coated AgNPs with those of AgNPs and chitosan gives an elementary ideas of the presence of both of the constituents in the self assembles polymer coated AgNPs. Tamoxifen loaded chitosan coated AgNPs with high drug payload was successfully prepared and characterized by FTIR spectra. The FTIR spectra of tamoxifen alone and tamoxifen loaded chitosan coated AgNPs are shown in figure 4. The three characterization peaks at 3379.29 cm−1 (−OH), 1527.62 cm−1 (C–O–C) and 1095.57 cm−1 (N–H) were taken into account. In comparison, the peak at 3379.29 cm−1 of tamoxifen loaded chitosan coated AgNPs was much wider than tamoxifen, indicating the stretching of hydrogen bonds. The peak at 1658.78 cm−1 noticed in tamoxifen was found to be shifted in tamoxifen loaded chitosan coated AgNPs with a peak at 1689.64 cm−1.

Figure 4. The FTIR spectra of (a) tamoxifen alone, (b) tamoxifen loaded chitosan coated AgNPs.
Download figure:
Standard image High-resolution imageFrom the dissolution point of view, the salvation of chitosan coated AgNPs is related to the protonation of free amine groups and breakdown of strong intra- and inter-molecular hydrogen bonding. The H − bonding established through –NH2 linkage makes the molecule behave as a resonating structure owing to unshared electron pairs that are less available for protonation. In addition, nitro groups withdraw electrons, making them less accessible at the secondary amide and primary amide groups during interaction. It is evident from the graph that there is a possible interaction between tamoxifen and chitosan coated AgNPs. A shift in the peak of tamoxifen loaded chitosan coated AgNPs indicates the interaction of chitosan coated AgNPs with tamoxifen. The change indicates encapsulation of tamoxifen to form chitosan coated AgNPs successfully.
Dynamic light scattering (DLS) analysis showed the size distribution of particles with maximum intensity at 90 nm (figure 5). The hydrodynamic diameters of prepared tamoxifen loaded chitosan coated AgNPs measured by DLS were around 60–140 nm. Such ranged nanoparticles may accumulate more accurately in tumour due to the enhanced permeability and retention (EPR) effect, known as 'passive' targeting.
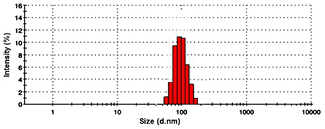
Figure 5. DLS examination of the particle size distribution.
Download figure:
Standard image High-resolution imageThe drug loading on chitosan coated AgNPs is done and the amount of drug loaded is displayed in table 1. The result evidently indicates that the amount of drug loading depends on the ratio of drug and carrier. The drug loading percentage increases when the amount of chitosan coated AgNPs is increased, and it decreases when the amount of drug is increased for a given amount of chitosan coated AgNPs. The amount of drug loaded per mg of chitosan coated AgNPs has been calculated. The amount of drug loaded per mg of chitosan coated AgNPs decreases with increase in the chitosan coated AgNPs and it increases with increase in the amount of drug. At a ratio of 2:1, the maximum amount of drug is loaded per mg of chitosan coated AgNPs. When the amount of drug is increased, there is no further increase in the amount of drug loaded per mg of chitosan coated AgNPs. 0.9 mg of tamoxifen is the maximum of the drug loaded per mg of chitosan coated AgNPs.
Table 1. Drug loading in percentage for different ratios of tamoxifen and chitosan coated AgNPs.
| Types of formulation | Tamoxifen:Chitosan coated AgNPs | Drug loading (%) | Tamoxifen (mg) / Chitosan coated AgNPs (mg) |
|---|---|---|---|
| I | 1:1 | 54.6 | 0.61 |
| II | 1:2 | 65.24 | 0.33 |
| III | 1:4 | 87.45 | 0.21 |
| IV | 2:1 | 40.5 | 0.80 |
| V | 4:1 | 20.5 | 0.80 |
As shown in the figure 6, the release of drug molecules depended on pH of the medium and release time. Drug release at pH 7.4 was slow and sustained with release ratio at about 30% ± 0.65% within 48 h. However, tamoxifen release rate was much faster at lower pH, with approximately 44% ± 0.50% (pH 6.0) and 58% ± 0.41% (pH 4.0) of the drug released within 48 h. Protonation of the drug occurred at lower pH, which released chemisorbed drug molecules in to the medium. Furthermore, the surface charge of chitosan coated AgNPs turned positive at lower pH, which blunted the electrostatic interaction of drug and chitosan coated AgNPs and facilitated the drug release process. These results demonstrate pH-triggered drug release behavior from the novel tamoxifen delivery system. It may be hypothesized that most of the drug will remain in the carrier for a considerable time period at normal physiological conditions (pH 7.4), indicating the potential for prolonged drug retention time in blood circulation and thereby greatly reducing the side effects of normal tissues. On the other hand, once drug loaded chitosan coated AgNPs are taken up by the tumor cells via endocytotic process, a faster release may occur at lower pH i.e. surrounding the tumor site or inside the endosome and lysosme of tumor cells, leading to significant improvement in cancer treatment efficacy.

Figure 6. In vitro drug release profile from chitosan coated AgNPs at neutral condition (pH 7.4) and also pH 6.0, pH 4.0 at 37 °C. Each point represents the mean ± SD.
Download figure:
Standard image High-resolution imageThe cell viability assay is one of the most important parameters for toxicology analysis that explains the cellular responses to toxic materials, and it can provide information on cell death, survival and metabolic activities. To examine the effect of AgNPs, Ch-AgNPs, Tam-Ch-AgNPs on mitochondrial activity, cells were treated with different concentrations of AgNPs, Ch-AgNPs, Tam-Ch-AgNPs between 20–100 µg ml−1, and toxicity was measured. The data from these experiments suggest that higher concentrations 60–100 µg ml−1 had significantly more impact on cell viability than 20–40 µg ml−1. AgNPs treated cells showed decreased metabolic activity, which depends on the nature of cell types and the size of NPs [15]. Colloidal silver, that is induced dose-dependent cytotoxic effect on MCF-7 breast cancer cells [16]. The rate of cell viability was significantly reduced as a function of both culture time and AgNps concentration in human IMR-90 and U251 cells, mouse embryonic stem cells, and A549 lung cells. The IC50 value of AgNPs prepared using chemical methods with a size of 10–15 nm was 27.0 µg ml−1 in BHK21 (non cancer) and HT29 (cancer) cells and higher concentrations of AgNPs became necrotic to cells, leading to rapid cell-membrane rupture [17]. In the present study we investigated that the induction of apoptosis could be the possible mechanism for anti-proliferative activity of biosynthesized AgNPs. The dose dependent cytotoxicity was observed in AgNPs, Ch-AgNPs and Tam-Ch-AgNPs treated MCF-7 and HBL-100 cells. Fifty percentage of cell death, which determines the IC50 value of biosynthesized AgNPs, Ch-AgNPs and Tam-Ch-AgNPs against MCF-7 cells, holds at 80 µg ml−1, 60 µg ml−1, 40 µg ml−1, respectively (figure 7(a)). However the cytotoxicity effect of biosynthesized AgNPs, Ch-AgNPs and Tam-Ch-AgNPs against HBL-100 exhibited to be not significant in 24 h (figure 7(b)).
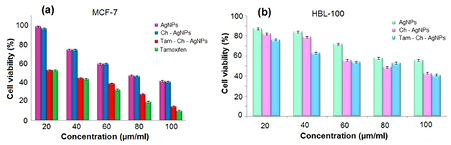
Figure 7. MTT assay results confirming the in vitro cytotoxicity effect of AgNPs with drug loaded against the MCF-7 and the normal HBL-100 cells for 24 h. (a) Cytotoxic effect of AgNPs, Ch-AgNPs and Tam-Ch-AgNPs on cancer cell line (MCF-7) and (b) cytotoxic effect of AgNPs, Ch-AgNPs and Tam-Ch-AgNPs on normal cell line (HBL-100). The detected IC50 concentrations of AgNPs, Ch-AgNPs and Tam-Ch-AgNPs were 80 µg ml−1, 60 µg ml−1, 40 µg ml−1 respectively for MCF-7 and HBL-100 cells for 24 h. Data is expressed as mean ± SD of three experiments. Percentage of cytotoxicity is expressed relative to untreated controls. Significant p < 0.05.
Download figure:
Standard image High-resolution imageLDH is a characteristic marker for cell death. LDH assay can be used to determine the status of cells under a given condition. We examined the effect of various concentrations of AgNps, Ch-AgNps and Tam-Ch-AgNps on membrane integrity; the cells were treated with various concentrations of AgNps, Ch-AgNps and Tam-Ch-AgNps for 24 h. The results suggest that cell-membrane leakage was dose-dependent and significantly affected (figure 8). The results from the LDH assay were consistent with cell viability; with increasing concentrations (10–80 µg ml−1) of AgNPs, Ch-AgNPs and Tam-Ch-AgNPs, the cells became gradually more cytotoxic. The increase of LDH leakage was due to abrupt cell-membrane lysis consequently leading to cell death, which suggest that the membrane leakage was a consequence of the apoptosis. Exposure to AgNPs for 24 h resulted in a concentration-dependent increase in LDH leakage and exhibited significant cytotoxicity at 10–50 µg ml−1 in BRL-3A rat liver cells [18]. The status of LDH leakage in L929 fibroblasts with various sizes of AgNPs and the results suggested that cell-membrane integrity was significantly affected [16]. Enzymes secreted into the media for all three different sizes of AgNPs-treated samples, among which 20 nm AgNPs were more effective than the 80 and 113 nm ones. Water-soluble mPEG-SH-coated AgNPs decreased cell viability in dose- and time-dependent manners and decreased the activities of superoxide dismutase and glutathione peroxides [19]. The LDH level increased 20% when cells were cultivated for 48 h in a culture medium containing AgNPs at 100 µg ml−1, and found that AgNPs could induce the release of LDH in a concentration- and time-dependent manner, indicating that AgNPs reduced the membrane potential in A549 cells. We found that an IC50 concentration of AgNPs, Ch-AgNPs and Tam-Ch-AgNPs holds at 80 µg ml−1, 60 µg ml−1, 40 µg ml−1 was significant to inhibit cell growth and sufficient to induce cell death. Therefore, this concentration was used for further analysis.

Figure 8. Effect of AgNPs, Ch-AgNPs and Tam-Ch-AgNPs on lactate dehydrogenase activity in MCF-7 human breast cancer cells. The cells were treated with various concentrations of AgNPs, Ch-AgNPs s and Tam-Ch-AgNPs. The effect of AgNPs, Ch-AgNPs s and Tam-Ch-AgNPs on lactate dehydrogenase activity was measured by changes in optical densities due to nicotinamide adenine dinucleotide (NAD) reduction that were monitored at 490 nm, using Roche's cytotoxicity detection lactate dehydrogenase kit. The results represent the means of three separate experiments, and error bars represent the standard error of the mean. Treated groups showed statistically significant differences from the control group with student's t-test (P < 0.05).
Download figure:
Standard image High-resolution imageSeveral studies have provided strong evidence for a link between AgNPs-mediated production of ROS and subsequent generation of oxidative stress and cytotoxicity. Oxidative stress in turn plays an important role in many types of cellular injury, which can result in DNA damage and apoptotic cell death. ROS are chemical species that are produced as by-products of cellular oxygen metabolism, which occurs via mitochondrial respiration in eukaryotic cells. AgNPs are capable of producing ROS. Abnormal accumulation of ROS is called oxidative stress, and can lead to serious cellular damage [20]. But, there is limited knowledge available about the mechanism of nanoparticles induced toxicity. To know the effect of AgNPs, Ch-AgNPs and Tam-Ch-AgNPs on oxidative stress, we measured ROS generation using the H2 DCF-DA assay. AgNPs, Ch-AgNPs and Tam-Ch-AgNPs induced intracellular ROS generation was evaluated using intracellular peroxide-dependent oxidation of DCFH-DA to form fluorescent DCF. DCFH-DA was used as control. Cells were also treated with doxorubicin (cancer drug) 1 µM as a positive control. DCF fluorescence was detected in cells treated with AgNPs, Ch-AgNPs and Tam-Ch-AgNPs for 24 h. We examined ROS generation, which is considered to be a crucial component of apoptosis in many studies. Consistent with an increase in intracellular ROS, the level of ROS generation was markedly increased in AgNPs, Ch-AgNPs and Tam-Ch-AgNPs treated cells (figure 9). This result indicates that ROS induced by Tam-Ch-AgNPs is a significant factor for apoptosis in Breast cancer cells when compared to AgNPs and Ch-AgNPs.
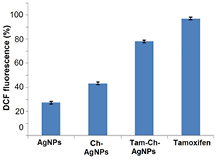
Figure 9. Silver nanoparticles (AgNPs) induce ROS generation in MCF-7 human breast cancer cells. Relative fluorescence of 2',7'-dichlorofluorescein was measured using a spectrofluorometer with excitation at 485 nm and emission at 530 nm. The results represent the means of three separate experiments, and error bars represent the standard error of the mean. Treated groups showed statistically significant differences from the control (CON) group with student's t-test (P < 0.05).
Download figure:
Standard image High-resolution imageDNA laddering is a valuable technique to analyze the endonuclease cleavage products of apoptosis. The ROS can act as signal molecules promoting cell-cycle progression, and can induce oxidative DNA damage [21]. DNA fragmentation is broadly considered a characteristic feature of apoptosis [22]. Induction of apoptosis can be confirmed by two factors: irregular reduction in size of cells, in which the cells are reduced and shrunken, and DNA fragmentation. To confirm further the apoptotic features induced by AgNPs, Ch-AgNPs and Tam-Ch-AgNPs treated MCF-7 cells; a DNA-fragmentation assay was conducted. Figure 10 clearly indicates that the DNA-laddering pattern in MCF-7 cells treated with AgNPs, Ch-AgNPs and Tam-Ch-AgNPs is one of the reasons for cell death.

Figure 10. Results of DNA fragmentation assay, M-PCR marker 50–2000 bp.
Download figure:
Standard image High-resolution imageFurther, to support the data for Tam-Ch-AgNps induced apoptosis, apoptotic DNA fragmentation was evaluated by fluorescence microscopy using the TUNEL assay (figure 11). Treatment of MCF-7 cells with AgNPs, Ch-AgNPs (6 µg ml−1) revealed a significant appearance of positively labeled cells, representing apoptotic DNA fragmentation. In control cultures, fewer or no apoptotic cells were observed. In contrast, Tam-Ch-AgNPs treated cells showed a significant number of TUNEL-positive cells.

Figure 11. Terminal deoxynucleotidyl transferase deoxyuridine TUNEL assay. Fluorescent staining of MCF-7 human breast cancer cells after 24 h treatment with AgNPs, Ch-AgNPs, Tam-Ch-AgNPs (6 µg ml−1), using TUNEL assay.
Download figure:
Standard image High-resolution imageThe morphological changes were observed in AgNPs, Ch-AgNPs and Tam-Ch-AgNPs treated MCF-7 cells and HBL-100 cells and compared with the untreated cells. The most recognizable morphological changes of treated cells observed in this study was the cytoplasmic condensation, cell shrinkage, production of numerous cell surface protuberances at the plasma membrane and aggregation of the nuclear chromatin into dense masses beneath the nuclear membrane. The induction of apoptosis, after the treatment with IC50 concentration of AgNPs, Ch-AgNPs and Tam-Ch-AgNPs was assessed by fluorescence microscopy after staining with acridine orange/ethidium bromide (AO/EtBr). Because AO can penetrate the normal cell membrane, the cells were observed as green fluorescence, while in apoptotic cells and apoptotic bodies are formed as a result of nuclear shrinkage, blebbing and were observed as orange colored bodies whereas, necrotic cells were observed as red color fluorescence due to their loss of membrane integrity when viewed under fluorescence microscope.
DAPI is a popular nuclear counter stain and the AgNPs induced nuclear fragmentation was observed by DAPI staining. The untreated cells showed normal nuclei (smooth nuclear) whereas after treatment of MCF-7 cells with AgNPs, Ch-AgNPs and Tam-Ch-AgNPs, the apoptotic nuclei (condensed or fragmented chromatin) were observed. Nuclear morphology analysis showed characteristic apoptotic changes, such as chromatin condensation, fragmentation of the nucleus, and formation of apoptotic bodies in the MCF-7 cells. Interestingly, some studies have reported that AgNPs can also induce DNA damage and apoptosis in cancer cells [23]
Alterations in MCF-7 cellular morphology and interactions with other cells led to speculation that changes in cell shape might be associated with changes in cytoskeletal organization. Because actin filaments supply the basic structure for maintaining cell morphology and contribute to functions such as adhesion and motility, we evaluated F-actin staining in the MCF-7 and HBL-100 cells. The staining revealed a dramatically altered pattern of F-actin, which is consistent with changes in F-actin cytoskeletal organization. The morphological changes was clearly visualized in the MCF-7 breast cancer cells (figure 12) when compared to HBL-100 (figure 13) non breast cells which significantly shows the cytotoxic effect of Tam-Ch-AgNPs is effectively higher in MCF-7 cells than HBL-100 cells.
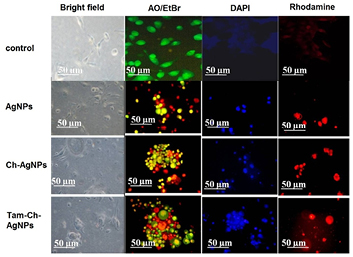
Figure 12. Fluorescence microscopic images of non-treated (control) and treated (AgNPs, Ch-AgNPs, Tam-Ch-AgNPs) MCF-7 breast cancer cells.
Download figure:
Standard image High-resolution image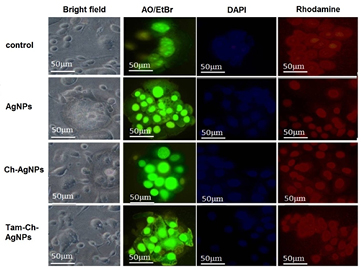
Figure 13. Fluorescence microscopic images of non-treated (control) and treated (AgNPs, Ch-AgNPs, Tam-Ch-AgNPs) HBL-100 normal breast cells.
Download figure:
Standard image High-resolution imageCaspases are cysteine-aspartic acid proteases and well-known for their vital role in the initiation as well as the execution of apoptosis [24]. Especially the activation of caspase-3 is crucial for cellular DNA fragmentation [25]. The role of caspase 3 in tamoxifen loaded chitosan coated AgNPs mediated apoptosis in MCF 7 cells was investigated by conventional RT PCR analysis.
The real-time RT-PCR analysis clearly demonstrates that the expression level of caspase-3, normalized to β-actin gene as internal control, increased after exposure to tamoxifen loaded chitosan coated AgNPs. The results indicate the involvement of the caspase signaling pathway in the apoptotic cell death of MCF-7 cells treated with tamoxifen loaded chitosan coated AgNPs (figure 14).
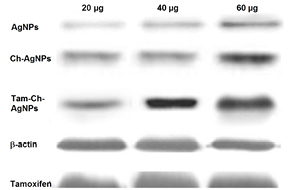
Figure 14. RT-PCR analysis of caspase-3 in MCF-7 cells treated with AgNPs, Ch-AgNPs and Tam-Ch-AgNPps.
Download figure:
Standard image High-resolution imageFigure 15 shows mechanism of tamoxifen loaded chitosan coated silver nanoparticles based targeted drug delivery in breast cancer. The schematic representation of tamoxifen loaded chitosan coated silver nanocomplex is shown in figure 16.
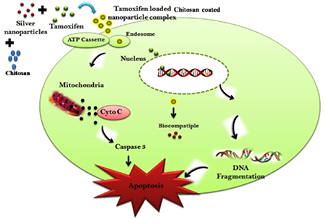
Figure 15. Proposed mechanism of tamoxifen loaded chitosan coated silver nanoparticles based targeted drug delivery in breast cancer.
Download figure:
Standard image High-resolution image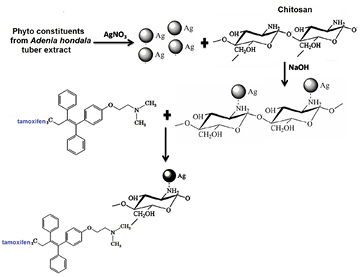
Figure 16. Schematic representation of tamoxifen loaded chitosan coated silver nanocomplex.
Download figure:
Standard image High-resolution image
4. Conclusion
Silver nanoparticles were synthesized from Adenia hondala followed by chitosan coated with tamoxifen drug loaded on these nanoparticles. This study investigated the efficiency of tamoxifen drug delivery. UV–Vis spectra showed that the AgNPs were chemically bonded with chitosan. The surface morphology of AgNP coated with chitosan was analyzed using the FESEM technique and shows a mixture of chitosan and Ag wherein the silver nanoparticles are seen to be enveloped by the chitosan polymer. This was further confirmed by FTIR spectrum, which indicates the interaction of chitosan coated AgNPs with tamoxifen. It was significantly noted that by decreasing pH from 7.4 to 4.0, the efficiency of drug release improved. This mechanism has a particular interest in cancer therapy due to the acidic extracellular tumor environment in the cancer cells. Further, toxicity studies of AgNPs, Ch-AgNPs, Tam-Ch-AgNPs confirmed the potential cytotoxic effects in MCF-7 cells. Tam-Ch-AgNPs-treated cells exhibited significant dose dependent cell death and membrane leakage when compared to AgNPs, Ch-AgNPs. This work suggests that AgNPs, Ch-AgNPs, Tam-Ch-AgNPs induce cell death through ROS generation, activation of caspase-3, and DNA fragmentation where Tam-Ch-AgNPs showed significant results when compared to AgNPs, Ch-AgNPs. This study demonstrates the possibility of using Tam-Ch-AgNPs to inhibit the growth of cancer cells and their cytotoxicity for potential therapeutic treatments, and offers a new method to combat various diseases, such as cancer, arthritis, and neovascularisation.