
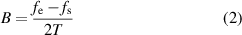
Abstract
Active infrared thermography has gained increasing popularity for nondestructive testing and evaluation in various industrial fields, especially for composite structures. In this regard, thermal wave radar (TWR) imaging is recognized as the next-generation active thermography technology to obtain great resolution and depth range over the inspected objects. A critical aspect concerns the optimal test parameter selection to guarantee reliable quality assurance required for industrial products. In this work, single- and multiple-frequency TWR was investigated in a quantitative manner with the goal of optimizing the detection parameters in terms of probing range and lateral and depth resolution. The effects of test parameters, including sampling frequency, modulation frequency, chirp duration, chirp bandwidth, etc, were investigated in detail through experiments on a glass fiber reinforced polymer specimen with multi-scale diameter-to-depth ratio defects. This paper aims to help yield a better understanding of the physical mechanism behind TWR and propose a workable scheme for testing parameter selection in practical applications.
Export citation and abstract BibTeX RIS

Original content from this work may be used under the terms of the Creative Commons Attribution 3.0 license. Any further distribution of this work must maintain attribution to the author(s) and the title of the work, journal citation and DOI.
1. Introduction
The excellent properties of composite materials have been verified and universally recognized. With the maturity of material molding technology, the proportion of composite materials used in industry has greatly increased, and they have even replaced metal as the main structural material for some key components. Glass fiber reinforced polymer (GFRP), which has the advantages of high specific strength, high specific stiffness, and good corrosion resistance [1–4], is a kind of composite material widely used in various fields such as aerospace, navigation, construction, electricity, etc [5–8]. Unfortunately, affected by unqualified manufacturing and harsh operating conditions, GFRP is prone to generating various types of defects, which would severely jeopardize structural safety of components. Therefore, it is required to develop effective detection methods for detecting and eliminating defective GFRP products through manufacturing inspection which would result in early failure warning of in-service components. However, due to their large size, complicated structure, and special materials, GFRP components have particular inspection requirements. Many testing techniques which have proved to be effective for metal and inorganic materials do not work well in detection of composite materials. Among conventional nondestructive testing and evaluation (NDT&E) techniques, for instance, ultrasonic testing usually requires good acoustic transmittivity between transducers and the inspected surface, leading to its contact measurement, low efficiency, and unsuitability for inspection of complex structures [9]. Radiographic testing is known as less effective for inspection of area-type defects, and its radiation hazard is an additional problem [10]. Eddy current and magnetic flux leakage testing are only effective when applied to surface or near-surface damages in conductive and ferromagnetic materials, respectively [11, 12]. In summary, the search for nondestructive testing technologies suitable for composite materials has become a hot research topic due to the scarcity of existing solutions.
With the superiorities of real-time imaging, contactless testing, simple operation, and quantitative defect estimation capability, active infrared thermography (AIT) has gained increasing popularity in NDT&E, especially for composite materials [13–16]. Based on the difference in excitation type, AIT is generally divided into two kinds: pulsed thermography (PT) and lock-in thermography (LIT). Both have been successfully applied for inspection of GFRP structures [17–21]. PT is usually only effective for subsurface defects in composite materials with its small probing depth because of the limited thermal diffusion length, and the amplitude-based images are easily weakened by non-uniformities introduced from optical excitation, specimen emissivity, ambient reflections, and inspected surface conditions [22, 23]. LIT can successfully realize greater probing depths than PT by utilizing single frequency modulated excitation. The phase images extracted by the lock-in algorithm have proven to be enhanced because of its insensitivity to uneven heating, surface conditions and sample emissivity [24, 25]. However, it still suffers from limited probing depth and poor axial/depth resolution. Thermal wave radar (TWR) imaging, which is recognized as a next-generation active thermography technology, combines chirped excitation and matched filtering to obtain much improved resolution and depth-probing range inside an inspected specimen [26–29]. Single-frequency TWR (SF-TWR), which has the same starting and ending frequencies of the linear frequency modulation sweep, is regarded as an improved version of LIT with higher signal-noise-ratio (SNR) images across wide frequency ranges [30]. Nevertheless, comparative studies of single- and multiple-frequency TWR and the performance evaluation of these modalities with respect to defect detection in GFRP have not been reported yet in the open literature. Critical optimal test parameter selection to guarantee reliable defect detection required for industrial applications is also missing. In this paper, the NDT capability of single- and multiple-frequency TWR for the inspection of GFRP is quantitatively evaluated and compared. The effects of test parameters, including sampling frequency, modulation frequency, chirp duration, chirp bandwidth, etc, were completely investigated through experiments on a GFRP specimen with multi-scale diameter-to-depth ratio (DDR) defects. The results of this work are expected to help yield a better understanding of the physical mechanism of TWR and introduce a working scheme for optimal parameter selection in practical manufacturing applications.
2. Single- and multi-frequency TWR methodology
TWR combines chirped excitation, pulsed compression and matched filtering. A matched filter is a linear filter with the maximum output SNR, and its transmission characteristic is the complex conjugate of the input signal spectrum [31]. The matched filter is designed according to the known waveform, and the known signal waveform can be detected in the high-noise channel. In terms of amplitude-frequency characteristics, the matched filter has the same amplitude-frequency characteristics as the input signal. The output signal is the weight of the input signal according to the signal amplitude-frequency characteristics. At the same time, because the white noise has a flat power spectral density, the matched filter is understood in the frequency domain. It is possible to suppress noise interference as much as possible through the input signal. In terms of phase-frequency characteristics, the matched filter has the opposite phase-frequency characteristics of the input signal. After the filter, all frequency components of the signal become in-phase signals in the time domain and coherently superimpose to form peaks at the output. At the same time, the noise is due to random phase distributed in the output end incoherent superposition. Therefore, the matched filter ensures the maximum output signal-to-noise ratio in both the time domain and the frequency domain. The output signal of the matched filter is the autocorrelation function of the input signal. When noise is considered, the output is the autocorrelation function of the signal and the cross-correlation (CC) function of the signal and noise. Therefore, the matched filtering of the signal is equivalent to the CC operation of the signal.
A linear frequency (chirp) modulated waveform can be mathematically defined as:

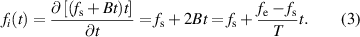
where Q0, fs, fe, B, and T are modulated waveform intensity, chirp start frequency, chirp end frequency, chirp sweep rate, and chirp duration time, respectively.
The instantaneous frequency of the chirp signal is
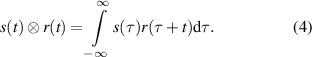
In signal processing, CC is a measure of the similarity between two signals. The CC of a time-domain signal s(t) and a reference signal r(t) is defined by the following formula:
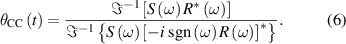
The time-domain definition of CC operations involves integration operations, which are complicated and can be converted to simple multiplication of the signal spectrum in the frequency domain based on the CC Fourier transform:

where  , *, and
  denote the CC operator, complex conjugate operator, and Fourier transform operator, respectively.
The CC phase can be calculated by the following formula [27]:
In this study, two distinct contrast parameters output by CC processing are adopted:
- (a)The height of the CC signal peak is referred to as the amplitude channel. In TWR measurement, the amplitude channel shows the intensity of light absorption in the sample. Therefore, the region with a strong absorption coefficient in the depth of the sample may have a higher amplitude than the weak absorption coefficient region near the surface, and the CC amplitude is easily affected by the uniformity of the heat flow intensity and the surface emissivity of the material.
- (b)The phase of the CC signal can be calculated according to equation (6). It is directly related to the depth of photothermal action, but has nothing to do with the degree of light absorption of the material. The CC phase is the normalized amount of emissivity.
The CC signals can be experimentally calculated based on the signal processing block diagram depicted in figure 1.

Figure 1. TWR signal processing block diagram.
Download figure:
Standard image High-resolution image3. Experimental setup
The TWR test system utilized in this study is composed of a laser excitation system, a high-precision infrared camera, a multi-axis electric translation stage, and a control and data processing computer, as shown in figure 2. The laser excitation system uses a continuous wave fiber-coupled 808 nm near-infrared laser diode from Jenoptik, Germany as the laser source, and includes a laser cooling system (Elite Thermal Engineering Thermoelectric controller MC-1000) for laser source cooling, a laser driver (model Thorlabs LDC 3065). A Cedip Titanium 520 M infrared camera was utilized to collect the surface thermal response of the sample. Its spectral range was 3.6–5.1 μm, and the maximum frame rate in the full frame mode was 175 Hz (the maximum frame rate in the sub-window mode was 370 Hz). The multi-data acquisition board (National Instrument NI-6229 BNC) received this pulse train and synchronously generated three analog outputs: flag pulse train, in-phase reference signal, and quadrature reference signal; then it sent them to the camera as its external trigger, lock-in signal I, and lock-in signal II inputs, respectively.
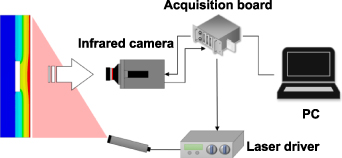
Figure 2. The TWR test system.
Download figure:
Standard image High-resolution imageA standard specimen with various DDR defects was prepared for quantitative evaluation on the inspection performance of the two investigated (single-frequency and multi-frequency) TWR techniques. The tested sample was a GFRP plate with flat-bottomed holes of different depths and sizes as shown in figure 3. The dimensions of the GFRP plate sample were 100 × 100 × 10 mm3. The diameters of the four drilled holes in each row with the same depth were, respectively, 10, 7, 5, and 3.5 mm. The depths of holes at each row were 2, 4, and 6 mm, respectively.

Figure 3. Schematic of GFRP specimen (unit: mm).
Download figure:
Standard image High-resolution image4. Results and discussion
4.1. The effects of sampling frequency on TWR images
According to the Shannon-Nyquist sampling theorem, the sampling frequency of a continuous signal needs to be at least twice that of the highest frequency of the sampled signal to ensure that the complete initial information can be recovered without distortion. In the GFRP detection test, the thermal diffusivity of the material was known to be generally low, so the single-frequency periodic excitation frequency used was generally much lower than the highest acquisition frequency of the infrared camera. In fact, high-frame-rate infrared cameras, the sampling frequency of which is good enough for most inspected materials, are commercially available. The influence of sampling frequency on the SF-TWR detection was studied under the premise that our measurements were performed in the oversampled mode.
The modulation frequency of the single-frequency periodic laser excitation used in the experiment was 0.02 Hz, and the chirp repetition time was over one thermal-wave period, which is 50 s. The photothermal image acquisition time was the same as the laser excitation time, and the image sampling frequency was set to 2.5, 5, 7.5, and 10 Hz, respectively. The collected infrared thermal image sequence represents the periodic transient thermal response of each pixel in the field of view. After CC, the amplitude and phase of the periodic transient thermal response of each pixel were obtained, and the CC amplitude and phase images corresponding to each sampling frequency are shown in figure 4. It can be seen that the CC amplitude images exhibit significant uneven heating compared to the CC phase images. Affected by the uneven heating, the defects at the depth of 4 mm (the second row in the image) in the CC amplitude images show higher contrast compared to the defects with the depth of 2 mm (the third row in the image). This is because the uneven heating makes the defects at that location generate a larger temperature difference than the defect-free area. It can also be seen that among the defects at 4 mm depth, the 7 mm size defect shows a larger temperature profile than the 10 mm size defect. On the contrary, in the CC phase images, all defects can be well identified as the influence of uneven heating is obviously eliminated, and the outlines of the defects in the CC phase images are clearly consistent with the actual defect sizes.

Figure 4. (a)–(d) CC amplitude images and (e)–(h) CC phase images of SF-TWR at sampling frequencies 2.5, 5, 7.5, and 10 Hz, respectively. The modulation frequency is 0.02 Hz and the chirp duration time is 50 s. The depth of each row of defects in the images from top to bottom is 6, 4, and 2 mm, respectively.
Download figure:
Standard image High-resolution imageIt can also be observed from figure 4 that there is no obvious difference between the CC amplitude and phase images at different sampling frequencies. In order to quantify the influence of sampling frequency on the CC amplitude and phase of the thermal response of the SF-TWR, profiles along the lines passing through the center of the defects at each row were extracted from pixel responses and plotted as shown in figure 5. It can be seen that the there is no difference between the profiles corresponding to CC amplitude and phase of defects at different sampling frequencies within the noise envelope of the scans. Physically, the increased amplitudes of scans over the defect locations and decrease phase lags are consistent with thermal-wave confinement within the region above the defect area [32]. At the same time, the obvious uneven heating effect in the CC amplitude profiles can be easily observed. It is concluded that the CC phases provide heating-intensity-normalized results and images in figures 4 and 5. Therefore, under the condition that the measurements were performed in the oversampled mode, changes in the sampling frequency did not have significant impact on the amplitude and phase characteristics of the periodic excitation photothermal response.
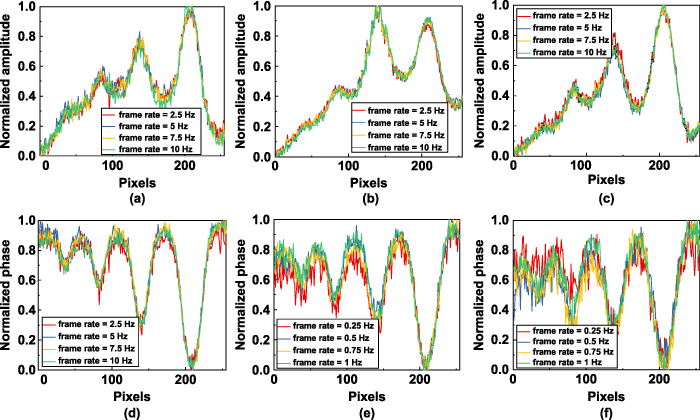
Figure 5. Pixel profiles along the lines passing through the centers of the defects in each row at different sampling frequencies. (a)–(c) CC amplitudes of defects at 2, 4, and 6 mm depths, respectively; (d)–(f) CC phases of defects at 2, 4, and 6 mm depths, respectively.
Download figure:
Standard image High-resolution image4.2. The effects of chirp duration on SF-TWR images
In TWR detection, the acquisition time of infrared camera images is equal to the periodic excitation duration. The modulation frequency of the SF-TWR used in these experiments was 0.02 Hz, the sampling frequency was 10 Hz and one thermal-wave period was 50 s. The chirp duration was set to 0.5, 0.8, 1, and 1.5 times of the thermal-wave period, i.e. 25, 40, 50, and 75 s, while the infrared camera's acquisition time was the same as the laser excitation duration. The CC amplitude and phase images corresponding to different chirp duration are shown in figure 6. Similarly, in order to quantify the influence of chirp duration on the CC amplitude and phase of the thermal response of SF-TWR, profiles along the lines passing through the center of the defects at each row were extracted and plotted as shown in figure 7.
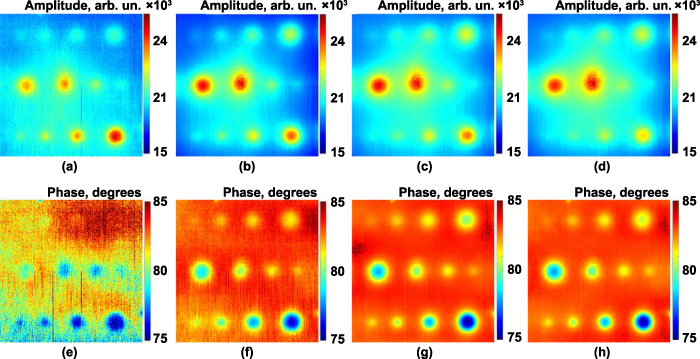
Figure 6. (a)–(d) CC amplitude images and (e)–(h) CC phase images of SF-TWR with the chirp duration of 25, 40, 50, and 75 s, respectively. The modulation frequency was 0.02 Hz and the sampling frequency was 10 Hz.
Download figure:
Standard image High-resolution image
Figure 7. Profiles along the lines passing through the center of the defects at each row with different chirp periods. (a)–(c) CC amplitude and (d)–(f) CC phase traces over defects at depths of 2, 4 and 6 mm.
Download figure:
Standard image High-resolution imageIt can be seen from figures 6 and 7 that when the chirp duration is less than one thermal-wave period, the detection output of CC amplitude and phase images exhibit significantly reduced defect recognition performance. The shorter the chirp duration in this situation, the less obvious the defect display with more significant added noise. Furthermore, the contrast is less between the defective and the intact areas from the profiles of CC amplitude and phase. This is because the collected data do not cover a complete thermal wave period, leading to insufficient thermal-wave information integration over part of the extent of subsurface penetration. When the chirp duration is greater than, or equal to, one thermal-wave period, increasing the chirp time does not significantly improve the contrast and SNR of the images, which is revealed by the profiles of CC amplitude and phase in figure 7: there is no significant change in the difference between the defective and the intact areas. This is because the data within one thermal-wave period are sufficient to recover the complete thermal response characteristics corresponding to chirp modulated excitation, and the data beyond one thermal wave period in the SF-TWR detection can be regarded as redundant information.
Therefore, in SF-TWR detection, in order to extract the complete thermal response information of the material corresponding to chirp modulated excitation while saving data storage space and processing time, one should set the chirp duration equal to a thermal-wave period corresponding to the excitation chirp repetition frequency.
4.3. The effects of modulation frequency on SF-TWR images
As is well known in thermal-wave science, the thermal diffusion length is the parameter used to measure the attenuation of the thermal wave in the propagation direction. The thermal diffusion length is related to the frequency of the thermal wave and the thermal diffusivity of the material, which can be described by  . The influence of SF-TWR modulation frequency on the CC amplitude and phase was studied. The modulation frequency was set at 10, 40, 100, and 400 mHz, and the modulation duration was set to the corresponding thermal wave period, namely 100, 25, 10, and 2.5 s. Also, based on the finding of the previous section, the infrared camera's acquisition time was the same as the modulation duration, and its sampling rate was set at 10 Hz. The CC amplitude and phase of the thermal response of each pixel were obtained for the various frequencies and are shown in figure 8. Similarly, in order to quantify the influence of modulation frequency on the CC amplitude and phase of the SF-TWR response, profile traces along the lines passing through the center of the defects at each row were extracted and are plotted in figure 9.
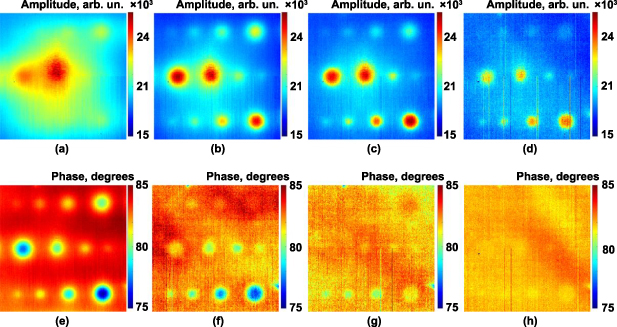
Figure 8. (a)–(d) SF-TWR CC amplitude, and (e)–(h) CC phase images at chirp frequencies of 10, 40, 100, and 400 mHz, respectively. The chirp duration was 100, 25, 10, and 2.5, respectively. The sampling frequency was 10 Hz.
Download figure:
Standard image High-resolution image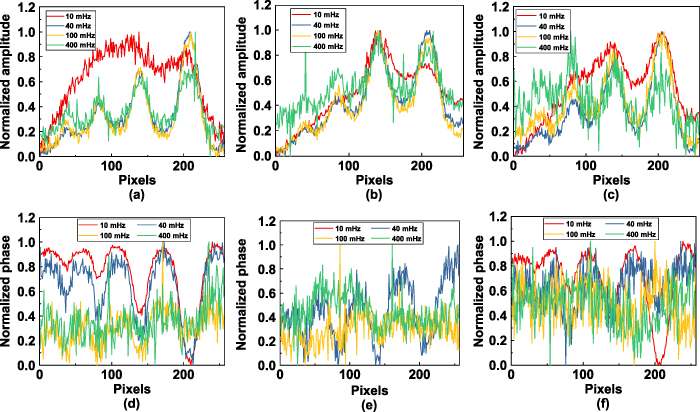
Figure 9. Profile traces along the lines passing through the center of the defects in each row with chirp frequency as a parameter. (a)–(c) CC amplitudes and (d)–(f) CC phases with defects at depths 2, 4, and 6 mm, respectively.
Download figure:
Standard image High-resolution imageIt can be seen from the CC amplitude images in figures 8(a) and (b) that the low modulation frequencies (deeper penetration), also generate lateral diffusion which merges the various defects into an overall image with very poor spatial resolution and unrecognizable defect contributions to contrast. The CC amplitude images in figures 8(c) and (d) show that the higher modulation frequencies better reproduce the defect geometries with minimal lateral spread. The effect of the modulation frequency on the CC amplitude of the SF-TWR signal can also be seen in the amplitude traces of figures 9(a)–(c).
The CC phase images in figures 8(e)–(h) and the phase traces in figures 9(d)–(f) clearly show that phase images exhibit higher lateral resolution than amplitude images, a fact that is most pronounced in the very low frequency range 10 and 40 mHz. This is consistent with well-known thermal-wave phase features of lower half-width at defect locations [26] than amplitude which, in turn, tends to increase spatial resolution in the presence of significant lateral diffusion. With the decrease of the modulation frequency, the defects at depths of 2, 4, and 6 mm appear in sequence, which affirms the depth-selective capacity of the CC phase channel. When the modulation frequency is too high, for example 400 mHz in the experiments, the CC amplitude tends to exhibit better detection results than the CC phase.
Comparing the SF-TWR CC amplitude and phase images, it can be seen that the phase channel is more reliable in imaging the actual defect geometries as it is less affected by blur due to lateral diffusion. This is also consistent with the well-known fact that thermal-wave phases exhibit better lateral resolution than amplitudes [32, 33].
4.4. The effects of chirp duration on MF-TWR images
In MF-TWR detection, the infrared camera acquisition time is equal to the chirp duration. In experiments performed to study the effects of chirp period on CC amplitude and phase, the chirp start and end frequencies were 0.01 and 0.03 Hz, respectively, and the camera sampling rate was 10 Hz. The chirp duration was set at 0.25, 0.5, 1, 1.5 times the thermal-wave period corresponding to the chirp start frequency, namely 25, 50, 100 s and 150 s. The resulting CC amplitude and phase images are shown in figure 10. It can be seen that when the MF-TWR chirp duration is less than a thermal-wave period corresponding to the chirp start frequency, defect recognition is significantly reduced in both CC amplitude and phase images. The shorter the chirp duration, the less obvious the display of defects in the images and the greater the noise. This is a well-known result of the relationship between thermal diffusion length and subsurface defect location in the thermally thick limit [32]. When the chirp duration of MF-TWR continues to decrease to less than the thermal-wave period corresponding to the chirp end frequency, the difference between the defective and non-defective areas in the CC amplitude and phase images is further reduced, and the noise further increases. When the chirp duration is greater than, or equal to, the quasi period corresponding to the chirp start frequency, increasing the chirp duration does not significantly improve the contrast and SNR of the images. In this situation, the thermal-wave periods corresponding to all frequencies in the frequency modulation range were less than this chirp duration. The data were sufficient to recover the complete thermal response characteristics, and the data beyond the chirp duration corresponding to the chirp start frequency can be regarded as redundant information. Therefore, in the MF-TWR detection, in order to completely extract the thermal response information of the material while saving data storage space and processing time, it is advisable to set the chirp duration equal to the thermal-wave period corresponding to the chirp start frequency.
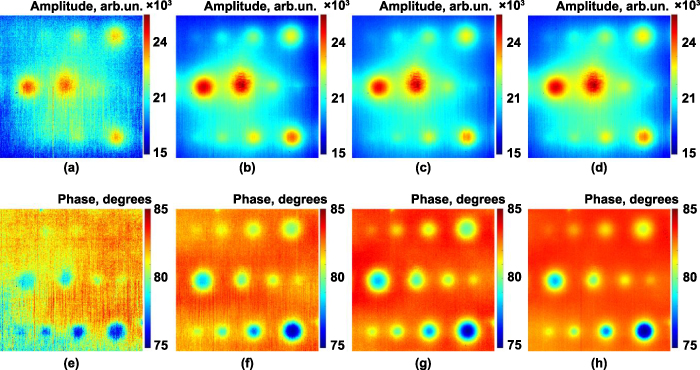
Figure 10. (a)–(d) MF-TWR CC amplitude, and (e)–(h) CC phase images with chirp durations 25, 50, 100 and 150 s, respectively. The chirp frequency range is 0.01–0.03 Hz and the sampling frequency is 10 Hz.
Download figure:
Standard image High-resolution imageOn the other hand, when the chirp start and end frequencies are set, changing the chirp duration amounts to changing the chirp sweep rate. Therefore, it can be concluded that when the chirp duration is greater than a thermal wave period corresponding to the chirp start frequency, the chirp sweep rate has no significant effect on the contrast and SNR of the output images.
4.5. The effects of chirp bandwidth on MF-TWR
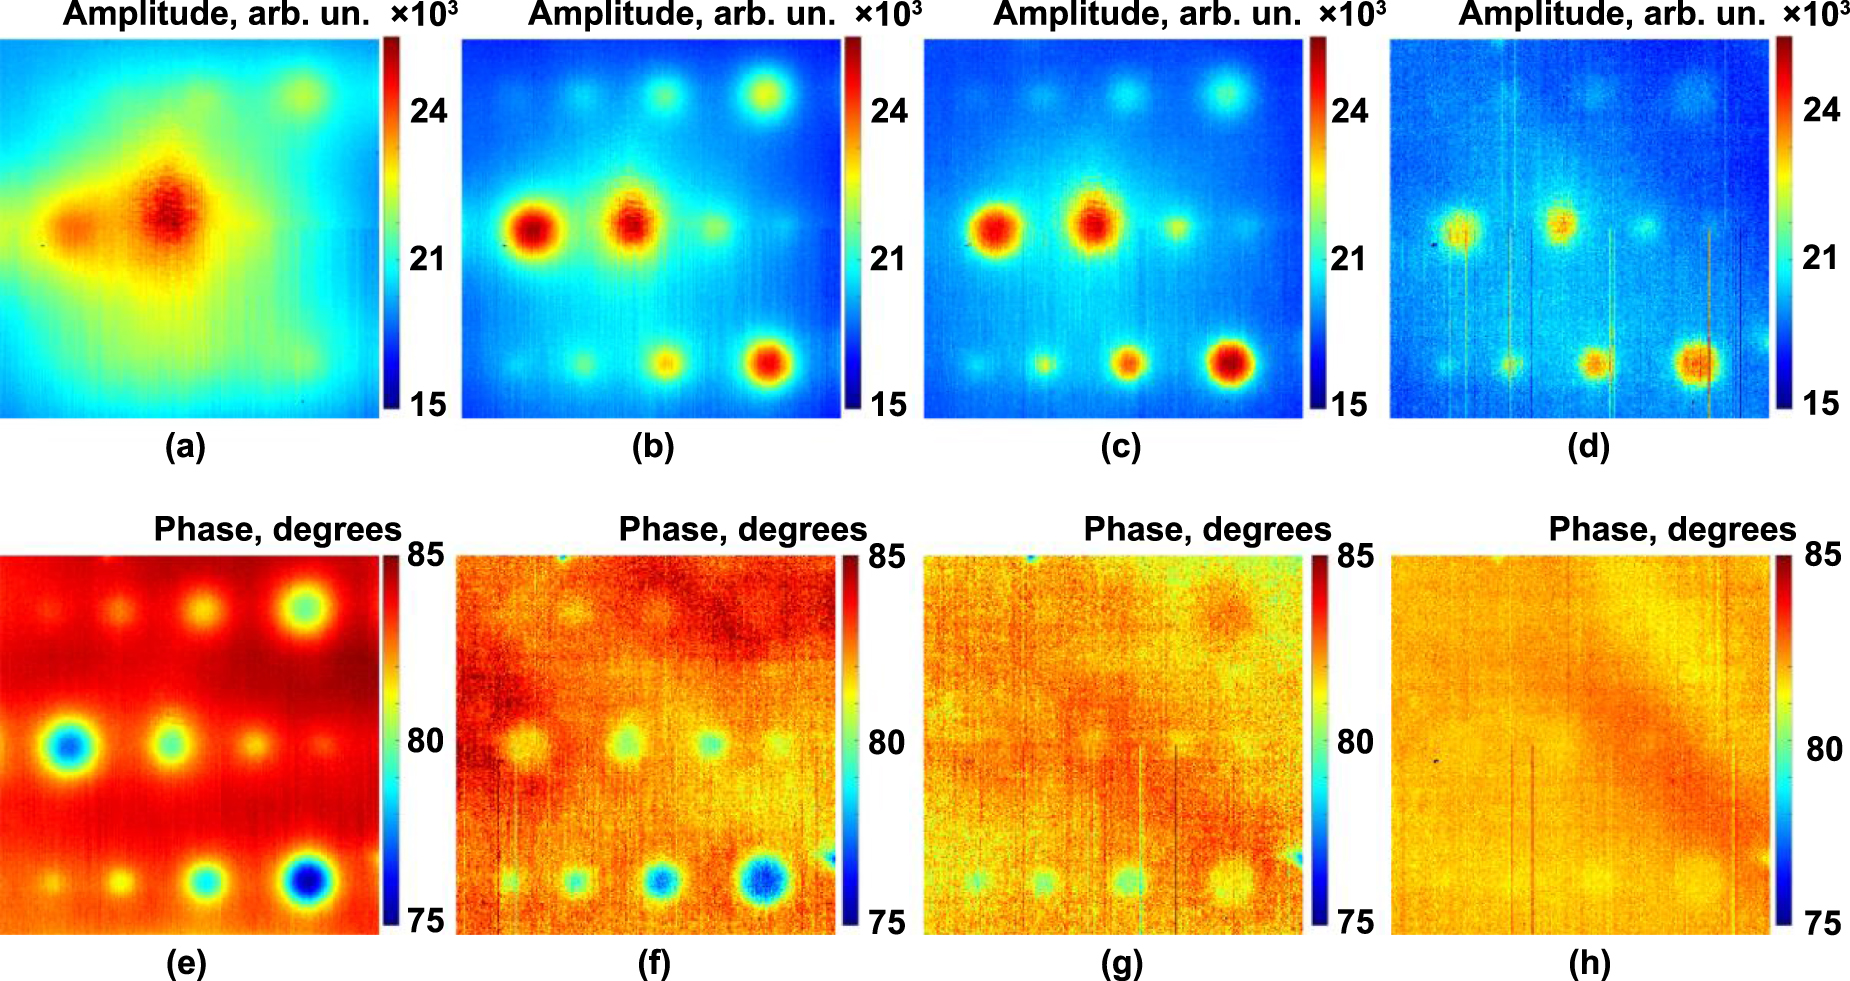
Changing the frequency modulation bandwidth is equivalent to changing the chirp end frequency under the condition that the chirp start frequency and period are fixed. The chirp start frequency used in this experiment was fixed at 5 mHz and the chirp end frequency was set at 6, 15, 35, 75, 155, 195, 395 and 795 mHz. The chirp duration was set at the thermal-wave period corresponding to the chirp start frequency, 200 s. The acquisition time was the same as the chirp time, and the sampling frequency was set at 10 Hz. The MF-TWR CC amplitude and phase images corresponding to the foregoing chirp bandwidths are shown in figure 11. Similarly, in order to quantify the effects of chirp bandwidth on the CC amplitude and phase, profile tracers along the lines passing through the center of the defects at each row were extracted and plotted as shown in figure 12.
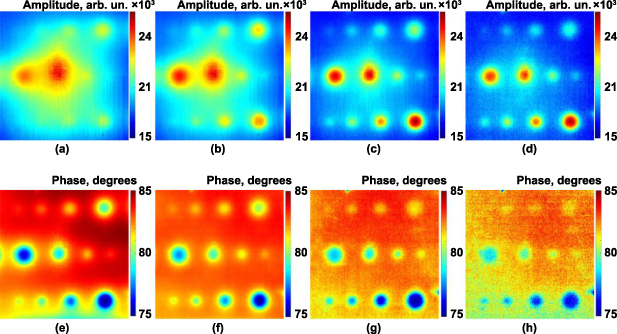
Figure 11. (a)–(d) MF-TWR CC amplitude, and (e)–(h) CC phase images with the chirp end frequency of 15, 75, 195, and 795 mHz, respectively. The chirp start frequency is 5 mHz, the chirp duration was 200 s, and the sampling frequency was 10 Hz.
Download figure:
Standard image High-resolution image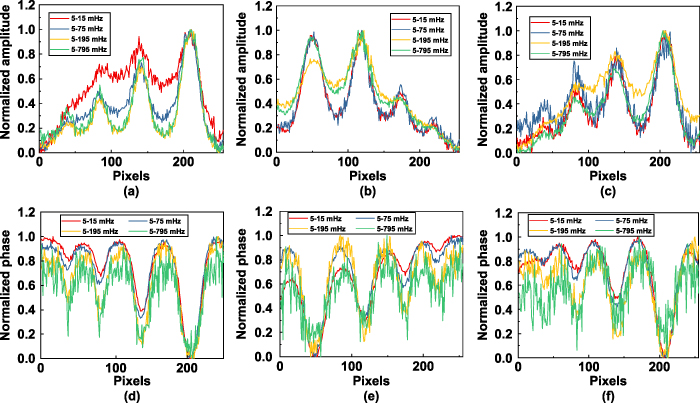
Figure 12. CC profiles along the lines passing through the center of the defects at each row with different chirp bandwidth including 5–15, 5–75, 5–195, and 5–795 mHz. Defects were at depths 2, 4 and 6 mm; (a)–(c) CC amplitude traces; and (d)–(f) CC phase traces.
Download figure:
Standard image High-resolution image
It can be seen from the CC amplitude images in figures 11(a)–(d) that the narrower the chirp bandwidth, the greater the proportion of low-frequency components in the excitation frequency sweep range, and the greater the sensitivity to deeper defects. The trade-off is compromised spatial resolution with adjacent defects appearing merging up to figure 11(b). But at the same time, the CC amplitude images with more low-frequency components is more affected by lateral diffusion. As shown in figures 11(a) and (b), the lateral diffusion offsets the deeper propagation depth of the low-frequency thermal wave and masks the display of the defects. Figures 12(a)–(c) show that when the chirp end frequency varies in the range of 195–795 mHz, the reduction of the frequency bandwidth will increase the contrast between the defective and intact areas, but when the bandwidth is too narrow, lateral diffusion will have a greater impact on the amplitude resolution loss.
It can be seen from the CC phase images in figures 11(f)–(h) and the phase profiles in figures 12(d)–(f) that with the reduction of chirp bandwidth, the CC phase image contrast of deep defects has been enhanced. This is because the excitation frequency modulation range contains a large proportion of low-frequency components, which have a deeper propagation depth. However, when the chirp frequency bandwidth is too narrow, closely approximating low-frequency SF-TWR detection, for example in figure 11(e), radial diffusion of the thermal wave in the material will be more effective, causing the defect outline to become blurred. When the chirp bandwidth increases, the excitation frequency modulation range contains a wide thermal-wave frequency spectrum, which in turn can cover a wide range of thermal wavelengths and yield improved contrast and resolution over several subsurface defect sizes.
Finally, the detection performance of MF-TWR and SF-TWR imaging with the latter modality modulated with the central frequency of the chirp bandwidth of the MF-TWR as in figures 11 and 8, is compared. When the MF-TWR bandwidth decreases enough, it tends to the SF-TWR behavior limit, so the MF-TWR and SF-TWR exhibit similar detection performance, as shown in figures 8(a) and 11(a), 8(e) and 11(e). With the increase in chirp bandwidth, MF-TWR exhibits better probing range and depth resolution of subsurface defects than SF-TWR, as shown in figures 8(b)–(d) and 11(b)–(d), 8(f)–(h) and 11(f)–(h). Therefore, MF-TWR has proved to be superior on probing range and lateral and depth resolution, and should be preferred for practical AIT inspection.
5. Conclusions
In this article, the NDT capability of single- and multiple-frequency TWR for the inspection of GFRP was evaluated and compared. The effects of test parameters, including sampling frequency, modulation frequency, chirp duration, chirp bandwidth, etc, were completely investigated and discussed by the experiments on GFRP specimen with multi-scale DDR defects. This study illustrates that MF-TWR has proved to be superior on probing range and lateral and depth resolution, and is therefore preferred for practical AIT inspections. This work would help yield a better understanding of the physical mechanism of TWR and become a useful reference for testing parameter selection in practical applications such as manufacturing defects.
Acknowledgments
This work was supported by the National Natural Science Foundation of China under Grant No. 12104155. AM gratefully acknowledges the Canada Research Chairs program, the Natural Sciences and Engineering Research Council of Canada (NSERC) for its support through and a Discovery Grant, and the Canada Foundation for Innovation and the Ontario Research Fund for a John Evans Leaders Fund (CFI-JELF) award. He also acknowledges the oNDuTy Create program funded by NSERC.