
Abstract
The energy sector generates over 70% of global greenhouse gas (GHG) emissions, but existing energy-climate policies do little to reduce GHG emissions to prevent climate change. We present a new carbon tax policy concept in which energy users would be taxed an amount equal to the cost of cleaning up the emissions that they create, wherein the tax revenues would be used to operate negative emissions technologies. The policy is based on applying the zero-emissions cost (ZEC) metric to energy prices, which includes the 'regular' cost of an energy source plus the cost of sequestering its emissions. Using the ZEC, (a) the energy sector would be emissions-neutral, (b) biofuels would be cheaper than petroleum fuels, and (c) renewable electricity would be cheaper than fossil-fuel electricity. We calculate the energy spending as a fraction of gross domestic product for 'regular' and ZEC cost scenarios. Implementing the ZEC carbon-tax policy would enable a monumental shift to a net-zero emissions energy sector, but carries a significant risk of causing an economic recession. The summary point of this commentary is to demonstrate a pathway to achieve net-zero GHG emissions from the US energy sector, and to contemplate the associated economic impacts on our society.
Export citation and abstract BibTeX RIS
1. Introduction
Energy consumption generates over 70% of global greenhouse gas (GHG) emissions (WRI 2020) with primary contributions from liquid transportation fuels, electricity generation, and heat generation. Emissions taxes have been proposed for decades (Pigou 1920, Nordhaus 1977, Rockström et al 2017) and a variety of emissions taxes and alternative fuel subsidies have been implemented worldwide (Sumner et al 2011, Goulder and Schein 2013, Kotchen et al 2017, Fuss et al 2018). However, these initiatives do not negate emissions; the associated revenues are not used to sequester GHG from the atmosphere. Even integrated assessment models (IAMs) often assume that carbon tax revenues are 'redistributed to households in lump sum fashion' (Wilkerson et al 2015). As a result, these efforts have made little impact on global GHG emissions, which have continued to rise, nearing 50 GtCO2e yr−1 (IPCC 2014). To date, GHG emitters have not been required to pay for the emissions that we generate. Meanwhile, a variety of negative emissions technologies have been developed to capture and store GHG from the atmosphere, including afforestation, bioenergy with carbon capture and storage, and direct air capture (Sanz-Pérez et al 2016, Smith et al 2016), but deploying these environmental efforts has been limited due to high costs, early stage of development, and a lack of accountability. Who is responsible for cleaning up the waste?
In this commentary we present a metric that quantifies the cost of 'cleaning up' GHG emissions from 100% of the United States' (US) energy consumption by allocating that cost directly to the original fuel source. As such, the zero-emissions cost (ZEC) metric represents the full cost of net-zero-emissions energy sources. If the US implements the ZEC as a carbon-taxed market price of energy, and subsequently uses the tax revenues to negate the associated energy-sector emissions, the country could create an emissions-neutral energy system. To estimate the macroeconomic feedback of this cost, we evaluate the impact that implementing the ZEC in retail markets would have on the United States' economy.
2. Methods
The  is defined according the equation (1),

where  is the price of fuel for an end-user,
  is the amount of negative emissions required to offset the lifecycle GHG impact of consuming the fuel, and
  is the cost of negative emissions. Equation (2) defines
  as the sum of the direct emissions from the fuel's end-use (
 ) and the indirect emissions associated with fuel production (i.e. upstream or embedded emissions) (
 )
)

As shown in figure 1, the ZEC metric combines the cost of purchasing a fuel for an end user with the cost of negating the associated lifecycle GHG emissions. Data for the variables in equation (1) are listed in appendices A1–A3 and were obtained from the following sources:  (Lazard 2018, DOE 2019, EIA 2019),
  (Wernet et al
2016, ANL 2018), and
(Wernet et al
2016, ANL 2018), and  (Sanz-Pérez et al
2016, Smith et al
2016).
(Sanz-Pérez et al
2016, Smith et al
2016).

Figure 1. Control volumes for zero-emissions cost accounting.
Download figure:
Standard image High-resolution imageThe ZEC of any specific amount of fuel depends on the corresponding fuel price, lifecycle GHG emissions, and cost of negative emissions—all of which can vary not only among fuel types (e.g. gasoline vs. solar power), but also between fuels of the same type (e.g. gasoline produced from Saudi Arabian crude oil vs. gasoline produced from Canadian tar sands) (Masnadi et al 2018). As such, our objective is not to specify which fuel types are 'best,' but instead to demonstrate the utility of the ZEC metric as a tool for comparing the energy-emissions nexus of a variety of fuels within a common framework.
3. Results, discussion, and policy implications
3.1. ZEC results
Figure 2 presents a comparison of ZEC and the 'regular' fuel price,  , of a variety of liquid transport fuels, electricity sources, and heat sources (data provided in appendix
  of 90 kg CO2e GJ−1 (ANL 2018, Wernet et al
2016). For a negative emissions cost of $0.44 (kg CO2e)−1 (Smith et al
2016), the ZEC of diesel fuel (with retail price,
of 90 kg CO2e GJ−1 (ANL 2018, Wernet et al
2016). For a negative emissions cost of $0.44 (kg CO2e)−1 (Smith et al
2016), the ZEC of diesel fuel (with retail price,  , of $23 GJ−1 or $3.16 gal−1 (EIA 2019)) would be $63 GJ−1 or $7.60 per gasoline gallon equivalent (gge). Thus, the ZEC of diesel fuel is nearly three times greater than the market price. The error bars in figure 2 for the regular costs represent a range of market prices for each energy source; for example the low, mid, and high diesel prices are $17, $23, and $29 GJ−1 ($2.30–$3.97/gal retail), respectively. The error bars for the ZEC combine the low, mid, and high regular cost value with low, mid, and high negative emissions costs, which are estimated to be $0.22, $0.44, and $0.66 (kg CO2e)−1, respectively, or 0.44 ± 50% $ (kg CO2e)−1. Thus, for diesel, the low, mid, and high ZEC values are $35, $63, and $95 GJ−1, respectively.
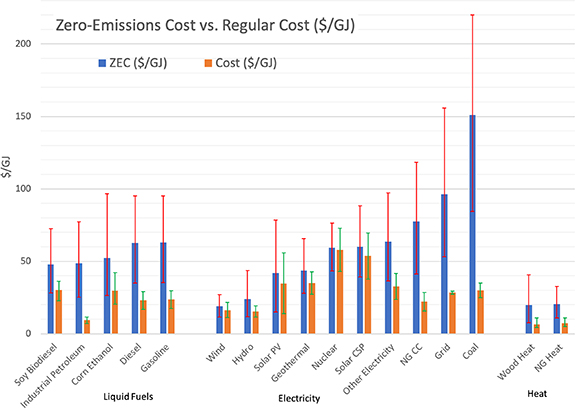
Figure 2. Zero-emissions cost (ZEC) and regular cost of a variety of energy sources. Error bars represent the upper and lower estimates for each energy source, as shown in appendices A1–A3.
Download figure:
Standard image High-resolution imagePetroleum transport fuels are cheaper than biofuels (corn ethanol and soy biodiesel). However, when the cost of negating the corresponding emissions are assigned, the ZEC of biofuels are favorable, with soy biodiesel ($48 GJ−1) being cheaper than diesel ($63 GJ−1) and corn ethanol ($52 GJ−1) being cheaper than gasoline ($63 GJ−1). These results suggest that using the ZEC for liquid fuel market prices would provide economic incentives for biofuels.
Results for electricity sources demonstrate that naturally occurring hydroelectric and wind power are the most economical sources (when resources are available) regardless of GHG emissions, followed by natural gas combined-cycle power plants, coal, solar photovoltaics, geothermal, concentrating solar power, and nuclear power, respectively. However, when the externality costs of reversing emissions are monetized, all of the non-fossil-fuel electricity sources outperform natural gas and coal fired power.
Heat generated from natural gas (fossil fuel) is cost-competitive with that from wood (renewable fuel) for both the ZEC and regular cost metrics, which indicates that unlike liquid fuels and electricity, implementing the ZEC in heat markets would not necessarily benefit renewable fuel sources. The ZEC of heat (∼$20 GJ−1) is roughly three times greater than that of the 'regular' cost (∼$7 GJ−1) for both natural gas and wood fuels.
3.2. Total economic energy cost
While we often speak of the cost of individual fuels and energy technologies, at the scale of the entire economy, we must consider the collective spending on all energy sources. It is the energy spending as a fraction of gross domestic product (GDP), or XE,GDP, that provides the economy-wide feedback for growth. Data show that (depending on how you count spending on primary energy versus secondary energy carriers) the US and global economies have a threshold level of XE,GDP, above which economic growth is restrained. Over the last century, the economy normally operates below this threshold level, and GDP increases. On a few occasions, most prominently influenced by global oil prices, XE,GDP has risen above this threshold, and the US and global economies have been sent into recession. Bashmakov showed that for OECD countries, consumer purchases of energy (e.g. gasoline, residential electricity, retail natural gas) more than approximately XE,GDP ≈ 11% would likely be associated with recession (Bashmakov 2007). King indicated that for the US and global economies, and a XE,GDP based more closely with primary energy (e.g. oil, coal, natural gas, and primary electricity), a US and world threshold for growth was about XE,GDP ≈ 8% (King et al 2015). Further, Bashmakov and Myshak show that energy cost thresholds exist for individual economic sectors, and that these are relatively constant over time (Bashmakov and Myshak 2018). They go so far as to state a 'rule of gravitation' such that 'real energy prices in each sector may grow only as much as energy intensity declines, and inversely promoting energy efficiency can be viewed as a policy, of which the environmental co-benefits will be undermined by rebound effects, unless it is accompanied by rising energy prices.'
If we internalize expenditures on taxes or a price of GHG emissions from fossil fuel combustion, we can add these expenditures to the 'regular expenditures' on energy to approximate a 'zero-emissions cost' of energy to the economy, as described above. The question arises as to what cost per unit of GHG reversal (i.e. $ tCO2e−1 of negative emissions technologies), can be internalized in the economy without inhibiting GDP growth or to reach a constant level of GDP. In this interpretation, we assume all energy sector expenditures on GHG emissions are allocated to the energy sector to calculate total annual expenditures for energy and its associated negative emissions. These expenditures are measured as economy-wide spending on energy relative to GDP ($21.4 trillion, 2019), which is the important metric, not how much is spent on any particular fuel or technology.
Figure 3 presents the percentage of GDP allocated to energy spending assuming: (a) 'regular' energy costs and (b) the ZEC of energy sources—while assuming the consumed quantity of each energy source remains the same in both scenarios. For this presentation, we have assumed that energy demands do not change despite changes to energy prices. For each energy source, there are six possible cost values presented in figure 2. The six columns of data presented in figure 3 are simply the six price points for each fuel from figure 2 ($ GJ−1) multiplied by the total consumption of each fuel in the US in 2019 (GJ) (EIA 2020b), and then normalized by the US 2019 GDP ($21.4 trillion) to yield a percentage of GDP ($/yr/$/yr). These data are provided in appendices

Figure 3. U.S. energy spending in 2019 shown as the percentage of 2019 U.S. GDP, XE,GDP, attributed to the energy sector, shown for low, mid, and high cost scenarios, with (a) 'regular' costs and (b) zero-emissions cost (ZEC) of each energy source.
Download figure:
Standard image High-resolution imageThe XE,GDP for low, mid, and high regular costs are 4.6%, 6.4%, and 8.7%, respectively. In comparison, the XE,GDP for low, mid, and high ZEC are 10.1%, 18.6%, and 28.9%, respectively. Overall, the XE,GDP of the ZEC scenarios are roughly 2–3 times greater than those of the regular cost scenarios, when assuming no changes to the energy supply mix.
While figure 3 presents the impact that the ZEC would have on XE,GDP for our current energy mix, applying the ZEC to energy markets would cause both a shift from high-to-low ZEC energy sources and a reduction in energy demand due to higher prices. We would expect a transition away from gasoline and diesel for transport and a shift from fossil fuels to low-ZEC renewable electricity. However, there are several scenarios in which fossil fuels with subsequent carbon capture have a lower ZEC than renewable energy (figure 2). For example, the Low ZEC of gasoline (∼$35 GJ−1) is less than the Mid ZEC of all other liquid fuels, including biofuels, which means that cheap gasoline with subsequent negative emissions would have no emissions and still be cheaper than biofuels. Similarly, electricity and heat from natural gas would both remain economically competitive for low natural gas prices.
Predicting future energy mixes under different energy policies, as well as energy mixes during a transition, is beyond the scope of this paper, but, as an example, figure 4 presents one simplified hypothetical future energy mix in which: (a) the total amount of end-use energy remains the same (∼75 EJ), (b) the GDP remains the same, (c) 90% of gasoline, diesel, and industrial petroleum fuels are assumed to be replaced by electrification, (d) 100% of coal electricity and 90% if natural gas electricity are replaced by solar, wind, and geothermal electricity, and (e) 50% of natural gas heat is displaced by renewable electricity. Maintaining the same level of energy consumption to achieve this hypothetical scenario would require a 35-fold increase in wind, solar, and geothermal energy over their current levels of consumption. (As an aside, in separate work, the authors have identified energy storage as a potential limitation on renewable electricity development. In the hypothetical scenario presented here, a significant amount of energy storage—i.e. batteries—would be required for the system to function, and the associated added costs have not been considered in this simplified example.) However, even with the drastic transitions in this scenario, the XE,GDP of the mid ZEC scenario is relatively high (10.1%), which based upon historical economic feedbacks would have negative economic impacts such as recession. Nonetheless, this hypothetical scenario implies that technologies enabling a negative emissions cost below about $0.13 (kgCO2e)−1 (or 130 $/tCO2e) could theoretically simultaneously enable present energy end-use consumption levels without economic recession (i.e. an economy with constant or increasing GDP with XE,GDP < 8%, calculation not shown). Of course, this hypothetical scenario assumes no change in technology costs (up or down), no costs for energy storage, and no reductions in energy demand via demand response methods or higher real energy prices. Bashmakov and Myshak show that real energy prices and energy intensity are inversely related (i.e. −1 elasticity or the 'minus one' concept) (Bashmakov and Myshak 2018), and thus we would expect that implementing the ZEC framework would reduce overall energy consumption, which could be evaluated in more detail in future modeling studies. The purpose of this example is to demonstrate the challenge of implementing the ZEC on all energy purchases in the U.S. without causing an economic recession. Note that this perspective differs from most IAMs that introduce carbon prices in the range of hundreds of dollars per tonne of CO2 without considering a cost threshold (XE,GDP) above which GDP growth and energy prices cannot be assumed independent variables anymore (i.e. many IAMs suggest growth in GDP is independent of carbon/energy costs) (Wilkerson et al 2015).
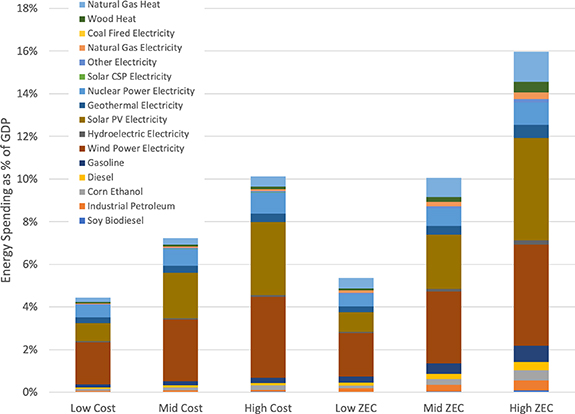
Figure 4. Hypothetical low-carbon scenario of energy spending shown as the percentage of 2019 US GDP, XE,GDP, attributed to the energy sector, shown for low, mid, and high cost scenarios, with (a) 'regular' costs and (b) zero-emissions cost (ZEC) of each energy source.
Download figure:
Standard image High-resolution image3.3. Conclusion
The ZEC metric represents a carbon-tax policy concept that would enable (by definition) net-zero GHG emissions from the US energy sector. As such, it provides an aggressive, targeted pathway to eliminating GHG emissions from energy consumption, which are the vast majority of global GHG emissions. The conceptual premise of the ZEC metric is to charge energy users for 'cleaning up' the GHG emissions (waste) that they generate—similar to charging consumers for wastewater treatment or municipal solid waste collection.
Implementing the ZEC in energy markets would cause biofuels to be cheaper than petroleum fuels and renewable electricity to be cheaper than fossil-fuel generated electricity. As such, the calculations of this paper could inform a low-carbon energy system transition and inspire energy policy based on the concept of charging consumers for the waste that they generate.
There are significant barriers to implementing the ZEC in energy markets, first and foremost due to the negative impacts that it could have on the US economy, which would make it unpopular with the US population. Results in this study show that the energy spending as a fraction of GDP, or XE,GDP, for 'regular' energy prices ranges from 4.7% to 8.3%, while those for the ZEC prices for the same energy mix could range from could range from 10% to 28%, and could cause a recession. We also showed that the ZEC could be reduced to range from 5% to 16% for a hypothetical scenario with aggressive renewable energy adoption and current technology prices. Thus, deploying negative GHG emissions technologies, such as direct air capture, while continuing the consumption of otherwise unabated fossil fuels would likely be an ineffective policy due to negative economic impacts; but possibilities exist for deploying negative GHG emissions technologies in conjunction with a transition to low-GHG energy sources to eliminate energy sector emissions without causing recession. Future work should consider how the energy sector, other economic sectors, and consumers would actually respond to implementing the ZEC framework, including changes to the total per-capita energy demand and price elasticities of energy products that could result in new energy portfolios during and after the transition to implementing a ZEC framework. This future work likely requires dynamic growth model frameworks that directly consider energy cost feedbacks on economic growth. Such frameworks exist, and they generally avoid the use of equilibrium approaches while including stock and flow consistent financial and money accounting such as in (King 2020), (Sakai et al 2019), and as discussed in (Pye et al 2021) and (Mercure et al 2019).
The goal of this commentary is to demonstrate the importance of simultaneously promoting net-zero GHG emissions to stop further atmospheric GHG increases, while considering the potential economic impacts associated with devoting a significant portion of the US GDP to operating negative emissions technologies. Future work should consider how the proposed negative-emissions industry would impact the economy at large, such as via metrics of GDP, private debt and interest, and wages. For some, the ultimate goal for a low-carbon society might be to develop net-zero GHG emissions energy systems without reducing quality of life as a result of negative economic impacts. The ZEC metric provides a carbon-tax policy concept that can help achieve these goals.
Acknowledgments
This work was supported by the US Department of Energy (Award No. DE-EE0007091).
Data availability statement
All data that support the findings of this study are included within the article (and any supplementary files).
Appendix: Zero-emissions cost data
A1.
Fuel cost,


Table A1. Fuel costs.
| Low price ($ MJ−1) | Mid price ($ MJ−1) | High price ($ MJ−1) | Sources | |
|---|---|---|---|---|
| Liquid fuels | ||||
| Soy biodiesel | $0.023 | $0.030 | $0.036 | (DOE 2019) |
| Corn ethanol | $0.020 | $0.030 | $0.042 | (DOE 2019) |
| Industrial petroleum | $0.005 | $0.009 | $0.019 | (EIA 2019) |
| Gasoline | $0.017 | $0.024 | $0.030 | (DOE 2019, EIA 2019) |
| Diesel | $0.017 | $0.023 | $0.029 | (DOE 2019, EIA 2019) |
| Electricity | ||||
| Hydroelectric electricity, reservoir | $0.012 | $0.015 | $0.019 | (IRENA 2019) |
| Wind power electricity | $0.011 | $0.016 | $0.022 | (Lazard 2018) |
| Solar PV large scale electricity | $0.014 | $0.035 | $0.056 | (Lazard 2018) |
| Solar CSP | $0.038 | $0.054 | $0.070 | (Lazard 2018) |
| Geothermal electricity | $0.027 | $0.035 | $0.043 | (Lazard 2018) |
| Other electricity | $0.024 | $0.033 | $0.042 | (EIA 2020a) |
| Nuclear power electricity | $0.043 | $0.058 | $0.073 | (Lazard 2018) |
| Natural gas CC electricity | $0.016 | $0.022 | $0.028 | (Lazard 2018) |
| Grid electricity | $0.027 | $0.028 | $0.029 | (EIA 2020a) |
| Coal fired electricity | $0.025 | $0.030 | $0.035 | (Lazard 2018) |
| Heat | ||||
| Wood heat | $0.004 | $0.007 | $0.011 | (Beal et al 2018) |
| Natural gas heat | $0.005 | $0.007 | $0.011 | (EIA 2020c) |
A2.
Negative emissions required to offset lifecycle GHG emissions,

Table A2. Greenhouse gas emissions in g CO2e MJ−1.
| Low | Med | High | Sources | |
|---|---|---|---|---|
| Liquid fuels | ||||
| Soy biodiesel | 24 | 40 | 55 | (ANL 2018, Chen et al 2018) |
| Corn ethanol | 27 | 52 | 82 | (Wernet et al 2016, ANL 2018, Lewandrowski et al 2020) |
| Industrial petroleum | 83 | 90 | 100 | (Wernet et al 2016, ANL 2018, Masnadi et al 2018) |
| Diesel | 83 | 90 | 100 | (Wernet et al 2016, ANL 2018, Masnadi et al 2018) |
| Gasoline | 82 | 89 | 99 | (Wernet et al 2016, ANL 2018, Masnadi et al 2018) |
| Electricity | ||||
| Hydroelectric electricity, reservoir | 2 | 6 | 8 | (Nugent and Sovacool 2014, Wernet et al 2016, Chipindula et al 2018) |
| Wind power electricity | 2 | 19 | 37 | (Wernet et al 2016, Almeida et al 2019) |
| Solar PV large scale electricity | 6 | 16 | 34 | (Nugent and Sovacool 2014, Wernet et al 2016) |
| Solar CSP | 7 | 14 | 28 | (Wernet et al 2016) |
| Geothermal electricity | 3 | 20 | 35 | (Wernet et al 2016, Eberle et al 2017) |
| Other electricity | 58 | 70 | 84 | Average estimate |
| Nuclear power electricity | 1 | 3 | 6 | (Warner and Heath 2012, Wernet et al 2016) |
| Natural gas CC electricity | 116 | 126 | 136 | (Odeh and Cockerill 2008, Singh et al 2011, Wernet et al 2016) |
| Grid electricity | 117 | 154 | 192 | (Wernet et al 2016) |
| Coal Fired electricity | 270 | 275 | 281 | (Wernet et al 2016) |
| Heat | ||||
| Wood heat | 15 | 30 | 45 | (Wernet et al 2016) |
| Natural gas heat | 27 | 30 | 33 | (Wernet et al 2016) |
A3.
Cost of negative emissions,

A4. Contributions to energy spending, regular costs
Table A4. Contributions to energy spending for various energy products, regular costs.
| Fuel | 2019 US consumption (GJ) | Low cost ($billions) | Mid cost ($billions) | High cost ($billions) |
|---|---|---|---|---|
| Soy biodiesel | 2.29E + 08 | $5.23 | $6.91 | $8.28 |
| Industrial petroleum | 1.30E + 10 | $90.80 | $121.06 | $151.33 |
| Corn ethanol | 1.09E + 09 | $22.24 | $32.11 | $45.65 |
| Diesel | 8.53E + 09 | $143.93 | $197.97 | $248.43 |
| Gasoline | 1.72E + 10 | $298.56 | $405.83 | $511.81 |
| Wind power electricity | 1.08E + 09 | $12.05 | $17.66 | $23.27 |
| Hydroelectric electricity | 9.85E + 08 | $11.37 | $15.16 | $18.95 |
| Solar PV electricity | 3.75E + 08 | $5.19 | $13.04 | $20.89 |
| Geothermal electricity | 5.76E + 07 | $1.57 | $2.02 | $2.46 |
| Nuclear power electricity | 2.91E + 09 | $125.51 | $168.66 | $211.81 |
| Solar CSP electricity | 1.16E + 07 | $0.44 | $0.62 | $0.81 |
| Other electricity | 3.55E + 08 | $8.39 | $11.59 | $14.78 |
| Natural gas electricity | 5.69E + 09 | $89.79 | $125.93 | $162.07 |
| Coal fired electricity | 3.48E + 09 | $86.95 | $104.34 | $121.73 |
| Wood heat | 2.53E + 09 | $11.13 | $16.47 | $27.83 |
| Natural gas heat | 1.87E + 10 | $94.99 | $137.60 | $203.47 |
| Total | 7.63E + 10 | $1008 | $1377 | $1774 |
| GDP, 2019 ($ billions) | $21 428 | 4.70% | 6.43% | 8.28% |
A5. Contributions to energy spending, zero-emissions costs
Table A5. Contributions to energy spending for various energy products, zero-emissions costs.
| Fuel | 2019 US consumption (GJ) | Low cost ($billions) | Mid cost ($billions) | High cost ($billions) |
|---|---|---|---|---|
| Soy biodiesel | 2.29E + 08 | $6.46 | $10.93 | $16.63 |
| Industrial petroleum | 1.30E + 10 | $327.10 | $633.74 | $1006.19 |
| Corn ethanol | 1.09E + 09 | $28.58 | $56.70 | $104.73 |
| Diesel | 8.53E + 09 | $299.45 | $535.28 | $810.67 |
| Gasoline | 1.72E + 10 | $609.79 | $1081.27 | $1638.51 |
| Wind power electricity | $12.43 | $20.60 | $29.01 | $12.43 |
| Hydroelectric electricity | $11.77 | $23.57 | $42.97 | $11.77 |
| Solar PV electricity | $5.67 | $15.65 | $29.41 | $5.67 |
| Geothermal electricity | $1.61 | $2.51 | $3.79 | $1.61 |
| Nuclear power electricity | $126.16 | $172.98 | $222.82 | $126.16 |
| Solar CSP electricity | $0.45 | $0.69 | $1.02 | $0.45 |
| Other electricity | $12.93 | $22.59 | $34.49 | $12.93 |
| Natural gas electricity | $234.88 | $441.53 | $673.63 | $234.88 |
| Coal fired electricity | $293.29 | $525.36 | $765.76 | $293.29 |
| Wood heat | 2.53E + 09 | $19.50 | $49.94 | $103.14 |
| Natural gas heat | 1.87E + 10 | $206.59 | $385.60 | $612.67 |
| Total | 7.63E + 10 | $2197 | $3979 | $6095 |
| GDP, 2019 ($ billions) | $21 428 | 10.25% | 18.57% | 28.45% |