

Abstract
We present a combination of experiments and theory to study the effect of sulfur doping in hard carbons anodes for sodium-ion batteries. Hard carbons are synthesised through a two step process: hydrothermal carbonisation followed by pyrolysis of a biomass-derived carbon precursor. Subsequent sulfur doping is introduced via chemical-vapour deposition. The resulting sulfur-doped hard carbon shows enhanced sodium storage capacity with respect to the pristine material, with significantly improved cycling reversibility. Atomistic first principles simulations give insight into this behaviour, revealing that sulfur chemisorbed onto the hard carbon increases the sodium adsorption energies and facilitates sodium desorption. This mechanism would increase reversible Na storage, confirming our experimental observations and opening a pathway towards more efficient Na-ion batteries.
Export citation and abstract BibTeX RIS

Original content from this work may be used under the terms of the Creative Commons Attribution 4.0 license. Any further distribution of this work must maintain attribution to the author(s) and the title of the work, journal citation and DOI.
1. Introduction
Sodium-ion batteries (SIBs) are one of the most advanced post-lithium energy storage technologies. The rapid development of SIBs in recent years has been mainly driven by the low cost and abundance of raw materials in comparison to traditional lithium-ion batteries: Na vs. Li, Fe/Mn vs. of Ni/Co in cathodes and synthetic hard carbons (HCs) vs. mined graphite in anodes. However, their lower energy density and the low HC anode specific capacity and initial Coulombic efficiency (ICE) have hindered their wider consideration in transportation applications. It is thus timely to explore both experimental and theoretical strategies to improve their performance.
The sodium storage mechanism in hard carbons was first proposed in 2000 by Stevens and Dahn [1]: Na-ions are first intercalated into graphene layers in the graphitic nanodomains, associated to the sloping region in the voltage-capacity curve, and subsequently adsorbed into the confined pores, associated to the plateau region. The hard carbon structure was modelled as random stacks of graphene, with the voids between and around neighbouring stacks termed nanopores. However, the microstructure of hard carbons is known to be highly disordered and complex [2, 3], containing multiple defects, internal curvature and different sizes of graphitic nanodomains, which directly affect the sodium storage capacity and the reversibility of the storage.
As a result, the Na-ion storage has been shown to be highly dependent on the local carbon microstructure [4]. These insight have been possible thanks to the combination of experimental characterisation and ab initio simulations, where simple graphene-based models are typically employed to represent microstructural motifs commonly found in hard carbons. Au et al [4] performed ex situ23Na solid-state NMR and total scattering studies on a series of hard carbons where the pore size, defects and degree of graphitisation were systematically tuned. They showed a correlation between the carbon microstructure and the sodium storage capacity, revealing an increasingly metallic nature of the stored sodium with increasing pore sizes occurring close to 0 V, which followed adsorption at defect sites occurring at higher voltages. Their results were supported by DFT modelling of adsorption and intercalation on pristine and defective graphene surfaces and graphitic bilayers, which confirmed the key role of defects in the reversibility of sodium storage.
Recently, operando characterisation combined with ab initio simulations [5] have revealed more details about the complex ion storage process, confirming the role of curvature in the carbon pore walls and defects, such as vacancies and free edges. [4, 6, 7] Furthermore, an intensive effort is being devoted to optimise the anode design to improve the SIBs storage capacity and reduce their irreversibility, the most challenging issue hindering the path towards commercialisation of this battery system.
A number of strategies have been proposed to enhance the capacity while reducing the irreversibility. Increasing the pyrolysis temperature does reduce the surface area while increasing the 'closed' porosity for Na+ storage, however, it also reduces the interlayer spacing within the graphitic domains and, thus, hinders the diffusion pathways towards storage within pores. Defect engineering and heteroatom doping have been widely adopted strategies to boost the specific capacity of HCs. The degree of improvement depends on the increase of interlayer distance, vacancy concentration, conductivity, and wettability caused by the incorporated heteroatoms. For example, oxygen-containing defects, which are typical in HCs, have been shown to display a 'trapping' behaviour that hinders the diffusion and migration of ions, detrimental to reversibility [8], while introduction of N, P or S defects has shown positive effects. Sulfur doping, in particular, is an interesting approach to enhance the performance of HCs since S atoms can increase the interlayer spacing within the graphitic domains and distort the sp2 network to enhance the conductivity and reactivity of the carbon layer towards Na ions. [9] Surfur doped anodes have shown, for example, to impart excellent rate performance [10] and long-term retention [11], yet, in many cases, extremely high initial capacities might be a consequence of the large surface area of carbons synthesised at relatively low temperatures (e.g. below 800) for retaining high sulfur loadings [12]. In addition, improved performance of S-doped carbons has been frequently attributed solely to the enlargement of the interlayer spacing and the consequent 'intercalation' of the bulky Na ions [13]. However, the larger ionic radius of Na+ compared to Li+ is not the cause behind the inability of Na to form Na-graphite intercalation compounds (Na-GICs), since the much larger ions K+ and Rb+ do form GIC. Recent DFT studies propose that within the alkali metal (AM) group, the binding energy of AM-graphite passes through a maximum for Na, making Na-GIC thermodynamically unstable [14]. Therefore, further research is needed to understand the effect of doping of anodes to better control the storage capacity and reversibility in SIBs.
Here, we combine atomistic simulation and experimental validation of the effect of sulfur doping on the sodium storage capacity of a bio-derived HC. Hard carbons are generated using a well-established sustainable thermal treatment developed in our group [15], while sulfur-doping of the HC is achieved using chemical-vapour-deposition (CVD). Microstructure and electrochemical characterisation of the HC pre-/post-doping reveals that the presence of sulfur enhances capacity and reduces irreversibility. Our simulations address sodium–carbon interactions in the presence/absence of sulfur. For this, we have developed new hard carbon models ab initio that capture fundamental motifs observed in large scale simulations and in the real materials, that is, graphitic and porous nanodomains including in the same environment the most important HC features (i.e. defects, free edges and curvature) so that the subtle interplay between the different factors can be evaluated.
Our results give insight into the fundamental understanding of the carbon-sodium/sulfur interactions, elucidating the role of defects and curvature in the hard carbon microstructure. This behaviour indicates how sulfur facilitates the desorption of Na, in agreement with the higher specific capacity and ICE observed experimentally for the S-doped hard carbon.
2. Results and discussion
Our HC material was synthesised through standard hydrothermal carbonisation (HTC) followed by pyrolysis under inert atmosphere at 1100 ∘C (see the Methodology for further details). In the case of the S-doped material, vapourised sulfur was injected after the annealing step through CVD. X-ray photoelectron spectroscopy (XPS) shows the successful introduction of sulfur into the S-doped hard carbon (S-GC). The C1s band (figure 1(a)) indicates the presence of additional oxygen functionalities, common in biomass-derived hard carbons, and can be fitted accounting for five environments at 284.7, 285.1, 285.6, 288.4, and 290.6 eV, assigned to C–C/C = C, C–S, C–O, C=O and  , respectively [16]. The presence of the C–S environment is corroborated by the high resolution S2p spectrum (figure 1(c)), where the peaks at 164.0 eV (2p1/2) and 165.3 eV (S2p3/2) may be attributed to the C–S–C bonds. An additional split signal is observed at 167.5 and 168.8 eV, corresponding to a small concentration of oxides of sulfur, likely formed due to impurities in the CVD system. These species are also observed in the C1s spectrum (figure 1(b)), with a peak appearing at 531.5 eV, alongside those arising from C–O (532.3 eV) and C=O (533.2 eV). XPS quantification proves the successful introduction of covalently bonded S atoms (ca. 1at.%, see table S1 in supplementary information) into the carbon lattice. Although higher doping quantities are often reported in the literature, this degree of sulfur incorporation is remarkable given the high temperature at which the material was carbonised, suggesting that CVD is an effective strategy to introduce doping without sacrificing graphitisation. Indeed, little effect on the structural ordering is observed by transmission electron microscopy (TEM; figures 1(d)–(g)), where short and disordered graphitic domains can be seen both before and after doping. These results suggest that sulfur may be introduced at existing edge sites without disrupting the carbon lattice. In addition, the Raman spectra (figure S3 in supplementary information) show only a slight increase in the
  ratio after doping. This observation is consistent with the incorporation of sulfur predominantly at edge or existing defect sites rather than within pristine basal planes; the carbon network is preserved but experiences greater framework distortion, leading to a higher intensity D band at 1350 cm−1. Furthermore, a slight downshift of the G peak from 1597 to 1590 cm−1 after functionalisation is indicative of n-doping arising from the S atoms, which could in turn increase the electronic conductivity and thus improve electrochemical performance.
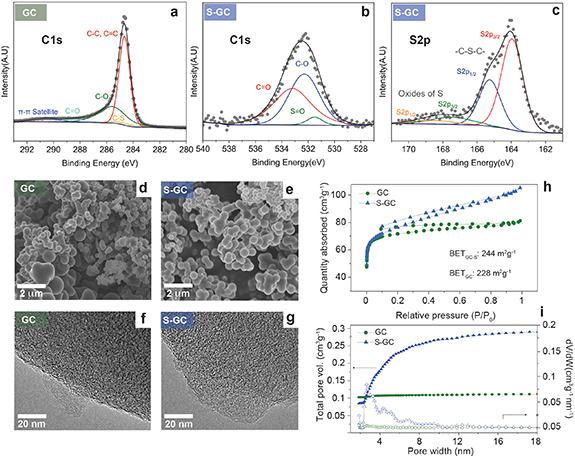
Figure 1. High resolution C1s XPS spectra for: (a) pristine hard carbon (GC) and (b) sulfur doped hard carbon (S-GC). (c) S2p spectra for S-GC. SEM and TEM images of GC (d) and (f) and S-GC (e) and (g) showing no evidence of microstructural changes upon doping. Nitrogen adsorption isotherms (h) and Cumulative pore volume (i) for both materials.
Download figure:
Standard image High-resolution imageTo further investigate the texture evolution upon doping, gas-accessible pores (equal to or larger than 0.4 nm) were analysed through N2 adsorption–desorption isotherms (figure 1). The specific surface area of S-GC is slightly higher than that of GC (244 vs. 228 m2 g−1) while the pore size distribution (figure 1(i)) shows that the porosity of S-GC is mostly constituted of mesopores, in contrast to GC which predominantly contains micropores (below 2 nm). These results suggest that by S-doping it is possible to expand the graphene interlayers within graphitic nanodomains to achieve more accessible surface.
The impact of S-doping on the electrochemical performance was evaluated in half-cells using sodium metal as the counter electrode and 1 M NaPF6 in ethylene carbonate and dimethyl carbonate (EC:DMC, 1:1 v/v) as the electrolyte, between 0.001 and 2.5V. The galvanostatic discharge-charge profiles at 30 mA g−1 (figures 2(a) and (b)) show discharge curves (sodium insertion) with a sloping region above 0.1 V and a flatter plateau region below 0.1 V. In HCs these two regions are attributed to Na-adsorption on edge and basal defects, or expanded graphene interlayers, and Na storage within internal or 'closed' pores, respectively. S-GC shows a higher initial Coulombic efficiency (ICE: 73% vs. 52%) and first and second cycle capacities (see table S2 in supplementary information). For GC, the first discharge is predominantly slope-derived and, despite the appearance of a small plateau contribution in subsequent cycles, S-GC presents more plateau capacity, while the sloping contribution starts at a lower voltage in the first cycle. We hypothesise that due to the enlarged graphite interlayer galleries, the sulfur doped material facilitates the diffusion of Na+ into the pores. Since the adsorption energy of Na on sulfur-containing defects is lower than for oxygen-containing defects [17], it is reasonable to attain larger capacities and better reversibility after doping. The same effect was observed when the charging rate was varied from 0.1 C to 2 C and back to 0.1 C, stably, for 150 cycles (figures 2(c) and (d)): S-GC shows consistently higher capacities than the non-doped material, however, the effect of sulfur doping seems less prominent at 2 C. This might be a consequence of the relatively low at.  of sulfur, showing a limited effect on aiding Na-ion diffusion at high rates. These results suggest that the addition of sulfur is beneficial for reversible sodium storage. In comparison to other works (see table 4 in supplementary information) the attained reversibility is remarkably high and might be attributed to the limited surface area, as carbonisation was done at 1100 ∘C, whilst still maintaining an optimal degree of sulfur doping. These effects might be more pronounced at higher doping and will be subject of further investigation for the high C-rate range in future work.

Figure 2. Galvanostatic charge–discharge profiles of the first five cycles for: (a) pristine hard carbon (GC) and (b) sulfur doped hard carbon (S-GC). (c) Specific capacity and Coulombic efficiency of GC (green circles) and S-GC (blue triangles) during 150 charge–discharge cycles; (d) Specific capacity for GC (green circles) and S-GC (blue triangles) under varying C rates (from 0.1 C or 30 mAg−1 up to 2 C or 600 mAg−1).
Download figure:
Standard image High-resolution imageTo understand the implications of S-doping and explain the experimentally observed behaviour, we have developed new hard carbon models which represent the characteristic graphitic and porous nanodomains observed in the real materials (onward referred to as the 'graphitic' and 'pore' models, respectively). Our models include in a single structure two important features known to impact the sodium storage capacity [18, 19]: curvature and defects, such as vacancies and internal edges (see figure 3). As such, our models improve on previous ab initio models [18, 20, 21], where these features were not taken into account at the same time in a single model. The curvature in the graphitic and pore models is achieved by displacing C atoms above/below the graphene plane and reducing the lattice vector perpendicular to the armchair-edge direction. In the pore-like model the curved graphene walls were pulled further apart so that the size of the pore region would correlate with typical pore sizes in our samples (i.e. 1.1 nm). Internal edges are achieved by inserting a dislocated graphene ribbon with armchair edge in both models (see figure 3), given the greater stability of armchair as compared to zigzag terminated graphene. Finally, three main topological defects, i.e. monovacancies (MVs), divacancies (DVs) and Stone–Wales rotation (SW) (see figure 4), are considered since these are present in graphene materials and hard carbons in concentrations deemed to have an effect [22, 23]. These topological defects are introduced by removing C atoms from the outer graphene layers in both models and subsequently optimising the structure. More details on the construction of the models are given in the methodology and the supplementary. The final models are 3D periodic, as shown in figure 3, and offer intercalation sites within the graphitic interlayer space and adsorption sites within pore walls. Therefore, our models allow us to study the sodium intercalation and adsorption mechanisms, that is, competing chemisorption and/or physisorption at the internal edge and the in-layer defects, as well as being affected by the curvature.
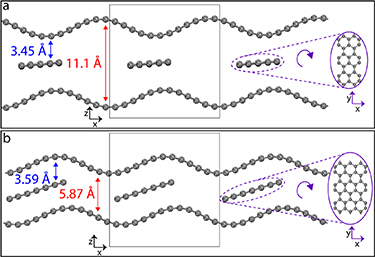
Figure 3. Optimised geometries of the final pore (a) and graphitic (b) models. The initial building unit is shown in the centre highlighted by a square and their periodic images are shown in both sides for the sake of facilitating visualisation. On the right side we show a rotated view of the sandwiched graphene ribbon which is continuously periodic in y-direction and periodically repeated in x-direction.
Download figure:
Standard image High-resolution image
Figure 4. Detail of optimised models illustrating typical hard carbon defects (a) MC, (b) divacancy, (c) Stone–Wales rotation; and (d) and (e) the two common sulfur–carbon bonding considered in this work.
Download figure:
Standard image High-resolution imageFirst we study adsorption of a single Na ion in absence of sulfur at various positions near the curved graphenic surfaces in both hard carbon models with and without defects. Calculation of adsorption energies on the two most stable configurations (i.e. lowest energy values) shows that Na adsorption on the defect-free graphitic model gives a value of  = −1.39 eV when Na is close to the edge and −0.04 eV when Na is intercalated between the graphene ribbon and the curved graphene, with an associated swelling of the layers (increasing from the initial 3.59 Å to 4.02 Å). These energy values are lower than that obtained for Na adsorption on a flat defect-free graphene (
 = 0.71 eV, see supplementary information) and agree well with previous simulations of Na intercalation on graphite [6], where an interlayer distance threshold of 3.49 Å was found, above which Na intercalation becomes favourable. Thus, our simulations indicate that curvature, typically present in real samples, offers more stable binding sites, promoting Na storage. On the pore model the most stable configurations give values of
  = −1.15 eV and
  = −1.45 eV when Na is adsorbed near the free edge and on the pore wall, respectively. Furthermore in the case of adsorption near the pore wall, upon optimisation Na migrates towards the free edge, indicating that the free edge offers a highly reactive adsorption site. In a second scenario several optimisations were performed near the curved layer with each of the topological defects (MV, DV and SW) and the Na adsorption energies were calculated. In both models (pore and graphitic) Na is drawn closer to DV and SW defects (
 = −0.55 eV and
  = −0.76 eV respectively), in agreement with adsorption on a flat graphene layer containing the same defects (see supplementary information). This behaviour indicates that the defects offer less favourable storage sites for Na, despite being highly reactive and curvature predominantly drives Na adsorption over the effect of the defects. In addition, curvature affects the probability of formation of each defect type, since the most likely defects to form are DV (graphitic model) and SW (pore model) (Ef
= 3.45 eV and 4.5 eV respectively) whereas in flat graphene, SW is the most favourable with Ef
= 4.98 eV (see supplementary information).
= −0.76 eV respectively), in agreement with adsorption on a flat graphene layer containing the same defects (see supplementary information). This behaviour indicates that the defects offer less favourable storage sites for Na, despite being highly reactive and curvature predominantly drives Na adsorption over the effect of the defects. In addition, curvature affects the probability of formation of each defect type, since the most likely defects to form are DV (graphitic model) and SW (pore model) (Ef
= 3.45 eV and 4.5 eV respectively) whereas in flat graphene, SW is the most favourable with Ef
= 4.98 eV (see supplementary information).
Among the configurations considered, the free edge seems to drive the most favourable bonding sites for Na. However, this strong bonding may impact the reversibility of Na adsorption as observed in the experiments. Therefore we select these configurations in both models to study the effect of sulfur doping on Na adsorption.
In order to dope the hard carbon models with sulfur, we place a sulfur atom at several locations near the free edge and over the defective graphene layers, then select the most stable configurations upon geometry relaxation. As shown in figure 5 (middle panels), in the graphitic model the most stable configuration is a sulfide-type functional group (–C–S–C–) on the free edge with a formation energy of Ef = −1.34 eV, while in the pore model the most stable configuration consists of a similar –C–S–C– functionality formed by filling a MC on the pore wall (Ef = −0.41 eV). These results are consistent with our XPS data which indicate that sulfur is mostly present in the carbon in the form of C–S–C bonds, and with our conclusions from Raman which suggest that S is only incorporated at existing edges or defects.

Figure 5. Snapshots showing the most stable configurations for sodium uptake on the graphitic and porous models before and after doping the carbons with sulfur. C atoms are coloured in grey, Na in purple and S in yellow. Panels labelled (i) show the full model while panels labelled (ii) show a detailed view. (a) Na adsorption on free edge in the graphitic model; (b) S-doped graphitic model; (c) Na adsorption on the S-doped graphitic model shown in (b); (d) Na adsorption on pore model; (e) S-doped pore model; (f) Na adsorption on S-doped pore model shown in (e).
Download figure:
Standard image High-resolution image
We now compute Na adsorption energies in the S-doped models to assess the effect of doping on the Na storage. As shown in figure 5(right panels), in the graphitic model Na is adsorbed in the vicinity of S with an associated increase in the adsorption energy ( = −1.15 eV) as compared to the pristine (non-doped) structure (−1.39 eV). This higher adsorption energy in the presence of sulfur suggests that Na may find an easier route to desorption. This supports our experimental observation of an enhanced reversible charging in the doped carbons.
Similarly, in the pore model the presence of sulfur also increases the Na adsorption energy (from  = −1.45 eV to −1.27 eV), suggesting a similar enhancement of reversible Na storage. Upon geometry relaxation, Na migrates away from the vicinity of sulfur towards the free edge, where it bonds with
  = −1.27 eV. This behaviour was also observed in the pristine model, where Na moved away from the pore wall towards the free edge where it stored favourably with
  = −1.45 eV. This behaviour suggests that the free edge still remains the most favourable site for Na storage, while the role of sulfur is to destabilise the Na binding, favouring the desodiation process.
3. Conclusions
We have shown that a transition from irreversible to reversible sodium storage in state-of-the-art Na-ion batteries is possible via doping the hard carbon anodes with sulfur. For this we have developed a doping technique based in CVD that effectively incorporates sulfur into the hard carbon microstructure. The doped hard carbon anodes show substantial improvement in the reversible slope and plateau capacities and the discharge capacities. Ab initio simulations give insight into the atomistic origin of the reversible storage in the presence of sulfur and reveal that sulfur increases the sodium adsorption energy, thus reducing the energy barrier for subsequent desorption. This behaviour favours reversible storage and supports our experimental evidence.
4. Methodology
4.1. Experiments
4.1.1. Hard carbons synthesis and sulfur doping
Pristine glucose hard carbons (GCs) were prepared by HTC of glucose, based on our previously reported procedure by Au et al [4] First 10 g of glucose (D–(+)–glucose  99.5% (Sigma-Aldrich) were dissolved in 90 ml deionised water. The solution was placed in a Teflon lined hydrothermal reactor and heated in an oven at 200 ∘C for 12 h. The resulting material was filtered and dried at 80 ∘C overnight and subsequently carbonised under Nitrogen atmosphere with a flow rate of 0.5 ml per min for 2 h at 1100 ∘C and a heating rate of 5 ∘C per min. The percentage yield of the material after carbonisation was about 20%.
The sulfur doped hard carbons (S-GC) are prepared by hydrothermal carbonisation of glucose as mentioned above. 150 mg material from the HTC treatment was placed in a quartz furnace tube and carbonised as described above to 1100 ∘C. To successfully dope the carbons with sulfur, a separate chamber containing a crucible with 1.5 g of sulfur was attached to the quartz tube outside of the furnace. The separate chamber was wrapped with a heating belt. After cooling for 10 h under N2 atmosphere, the separate chamber was heated to 400 ∘C with the heating belt to allow for the evapouration/sublimation of sulfur while the hard carbon was simultaneously reheated in the furnace at 500 ∘C with a heating rate of 5 ∘C per min for 3 h under N2 atmosphere with a N2 flow rate of 0.5 ml min−1. At the end of the experiment, there was no discernible sulfur left in the crucible and the percentage yield of the material after this procedure was similar to the pristine experiment.
4.1.2. Materials characterisation
Scanning electron microscopy was carried out on a Zeiss Leo SEM operated at 10 kV to evaluate morphology. TEM was carried out using a JEOL 2100Plus TEM at 200 kV operating voltage. N2 adsorption/desorption isotherms were measured in a Micromeritics Tristar II Plus equipment. Prior to the analysis the materials were degassed overnight under vacuum at 200 ∘C. The BET surface area (S BET) was calculated in the relative pressure (P/P0) range of 0.05–0.3 . The pore size distribution was assessed by non-local density functional theory model for slit pores. Raman spectra were recorded in a Raman-Senterra II spectrometer equipped with a 100× objective and a 532 nm laser as excitation source.
Electrodes were made using an 90:10 weight ratio of active material and carboxymethyl cellulose binder (Mw 250 000, Sigma Aldrich), respectively. A 250 µm layer of the slurry was then coated onto a carbon coated aluminium foil (18 µm C coated Al foil, MTI corporation) through blade casting (doctor blade coater). Once dried at room temperature for 24 h, 13 mm discs were cut and dried at 100 ∘C for 2 h under vacuum. The electrolyte preparation and coin cell assembly were conducted in an argon-filled glovebox (MBraun GmbH Labstar glovebox workstation) with H2O <0.5 ppm and O2 <0.5 ppm levels. CR2032 coin cells were assembled using sodium metal counter electrode discs (less than 0.5 mm thick, rolled and cut from a sodium ingot, 99.8% metals basis, Alfa Aesar), the coated hard carbon as working electrodes and a glass fibre separator (Whatman GF/B glass microfibre, 18 mm diameter) saturated with electrolyte (150 µL). The 1 M electrolyte solution was prepared by dissolving sodium hexafluorophosphate (NaPF6 Alfa Aesar, 99+%) in a pre-dried solvents (80 ∘C overnight and then placed in a bottle containing 4 Å porous molecular sieve). 1:1 volume mixture of ethylene carbonate (EC, anhydrous 99%, Sigma Aldrich) and dimethyl carbonate (DMC, 99.9+%, Sigma Aldrich). For the solvent mixture EC was first heated up to 45 ∘C inside the glovebox antechamber and then stirred with an equal volume of DMC until fully homogeneous. Galvanostatic cycling tests were performed on a Land coin cell testing system in the potential range of 0.001–3 V vs. Na+/Na and using sodiation/desodiation current rates between 30 and 600 mA g−1, corresponding to cycle rates between 0.1 and 2 C based on the average theoretical capacity of 300 mAh g−1 for hard carbons. Cyclic voltammetry (CV) experiments were performed on a Biologic VSP-300 potentiostat. CVs were recorded at a scan rate of 0.1 mV s−1 for five cycles.
4.2. Atomistic simulations
All simulations are performed employing periodic DFT calculations and the Gaussian plane wave formalism as implemented in the CP2K code [24]. The generalised gradient approximation and specifically the functional developed by Perdew, Burke and Ernzerhof [25] is used to approximate the exchange-correlation. An empirical dispersion correction is used by employing the D3 scheme of Grimme et al [26] with Becke–Jonson damping [27]. Goedecker–Teter–Hutter pseudopotentials are used to model the core ionic potentials. Gaussian-type orbital basis sets are employed to represent the valence one-electron orbitals [28]. Specifically 4, 6 and 9 valence electrons are modelled for C, S and Na, respectively. Molecularly optimised triple-zeta valence basis sets are used for C and S, whereas a short-range double-zeta basis is used for Na. Polarisation is added in all cases. Planewaves are expanded up to a kinetic energy cutoff of 350 Ry, which is enough to get an error below 0.001 eV atom−1 over formation energies. In the presence of Na we increased the cutoff to 1100 Ry to be able to correctly reproduce the lattice parameter and bulk modulus.
4.2.1. Generation of hard carbon models
We have generated two models representing the main structural motifs of hard carbons: a pseudo-graphitic nanodomain and a porous nanodomain. The pseudo-graphitic nanodomain is referred onward to as the 'graphitic model' and is constructed by sandwiching a graphene ribbon among two stacked graphene layers. The layers are wavy and periodic while the ribbon is flat and semi-periodic in order to offer an internal free edge. The porous nanodomain is referred onward as the 'pore model' and is constructed by sandwiching a graphene ribbon among two opposed curved and defective graphene layers, acting as pore walls.
To generate both models we use a rectangular cell of side dimensions 12.8 Å × 14.8 Å with periodic boundary conditions. The graphitic model contains a total of 186 C atoms: the two stacked graphene layers contain 72 C atoms each with the middle graphene ribbon containing 42 C atoms. The pore model contains a total of 174 C atoms, with the outer graphene walls containing 72 C atoms each and the middle graphene ribbon containing 30 C atoms. The lattice parameter of graphene 2.467 Å is determined by performing static volume expansion and fitting to the Birch–Murnaghan equation of state.
To achieve bulk models, no vacuum region is inserted and the cell is optimised in the z-direction. For geometry optimisation, the Brillouin zone is sampled at the Gamma point. To aid with convergence, we employ Fermi–Dirac smearing with T = 300 K; the final electronic energy is extrapolated to k
 eV. Electronic self-consistency is ensured up to a tolerance of 10−7 Hartree. To locate stable configurations in the potential energy surface, we minimise the Hellmann–Feynman forces on all atoms to within a tolerance of
  a.u. using the Broyden–Fletcher–Goldfarb–Shanno algorithm.
Subsequently, typical defects such as MCs, DVs and SW rotations are incorporated into the models by removing/adding C atoms in either the stacked graphene layers in the graphitic model and the graphenic pore wall in the pore model, followed by a geometry optimisation.
4.2.2. Simulation of Na storage in presence and absence of sulfur
Once the hard carbon models are generated, we study their interaction with sodium in two scenarios, with and without sulfur. For this, we first study independently the sodium–carbon interactions and the sulfur–carbon interactions. Subsequently we take the sulfur–carbon systems and add sodium to assess the changes in the behaviour of sodium uptake. Evaluation of the atomic interactions are performed by calculating formation energies Ef . Stability of structures containing l carbon atoms and m sodium atoms are discussed with respect to formation energies using pristine graphene and bulk Na as a reference such that:

where  is the total energy of a slab with l carbon atoms, m sodium atoms and n sulfur atoms,
  is the total energy per atom of a pristine graphene slab,
  is the total energy per atom of bulk Na and
  is the total energy per sulfur atom in octasulfur S8. Positive values of Ef
indicate endothermic formation with respect to pristine graphene, bulk Na and S8. We also calculate the adsorption energy of Na and S taking the surface they are bound to as the reference state. In this case, bulk Na metal and S8 are still used as the reference state such that
is the total energy per sulfur atom in octasulfur S8. Positive values of Ef
indicate endothermic formation with respect to pristine graphene, bulk Na and S8. We also calculate the adsorption energy of Na and S taking the surface they are bound to as the reference state. In this case, bulk Na metal and S8 are still used as the reference state such that

where  is the total energy of a slab with m sodium atoms bound and
  is the energy of the clean slab. Negative values of
  indicate exothermic adsorption of Na and S with respect to the reference states.
Acknowledgment
S A acknowledges funding from the Damian Cummins Scholarship. H A thanks the Faraday Institution's LiSTAR project (EP/S003053, Grant FIRG014). C S C acknowledges funding from EPSRC (Grant EP/P033555/1), C d T acknowledges funding from the European Union's Horizon 2020 research and innovation programme under the Marie Skłodowska-Curie Grant Agreement No. 101025294. M C R and M M T are grateful to the EPSRC funding through the project EP/S018204/2. The authors acknowledge Mr Yuming Sun for testing tolerances for some of the DFT calculations. Computing resources provided by STFC Scientific Computing Department's SCARF cluster.
Data availability statement
All data that support the findings of this study are included within the article (and any supplementary files).
Supplementary data (0.8 MB PDF)