

Abstract
Exosomes are nano-sized extracellular vesicles excreted by mammalian cells that circulate freely in the bloodstream of living organisms. Exosomes have a lipid bilayer that encloses genetic material used in intracellular communication (e.g. double-stranded DNA, micro-RNAs, and messenger RNA). Recent evidence suggests that dysregulation of this genetic content within exosomes has a major role in tumor progression in the surrounding microenvironment. Motivated by this discovery, we focused here on using exosomal biomarkers as a diagnostic and prognostic tool for cancer. In this review, we discuss recently discovered exosome-derived proteomic and genetic biomarkers used in cancer diagnosis and prognosis. Although several genetic biomarkers have been validated for their diagnostic values, proteomic biomarkers are still being actively pursued. We discuss both commercial technologies and emerging technologies for exosome isolation and analysis. Emerging technologies can be classified into optical and non-optical methods. The working principle of each method is briefly discussed as well as advantages and limitations.
Export citation and abstract BibTeX RIS

Original content from this work may be used under the terms of the Creative Commons Attribution 4.0 license. Any further distribution of this work must maintain attribution to the author(s) and the title of the work, journal citation and DOI.
1. Significance of circulating tumor exosomes in cancer diagnostics and treatment
Cancer arises through a series of somatic mutations that allow cells to proliferate unchecked [1]. 'Cancer genes' typically block the normal 'safety stops' in a cell that halt or retard uncontrolled proliferation [2]; the unregulated cancer cell clones then form tumors. The gold standard for cancer diagnosis has traditionally been tumor biopsy, which can provide tremendous insight into the morphology and gene expression patterns of tumors but is highly invasive, relying on the physical sampling of a tumor for pathologic analysis [3, 4]. Shortcomings of tissue biopsy include the possibility of bleeding, organ damage, and missing the intended target, which can lead to misdiagnosis and ineffective treatment [5], and the fact that it cannot be used for early detection, i.e. before a visible tumor forms. Other less invasive means of obtaining information on tumors for cancer diagnosis and treatment are actively being sought.
Some examples of less-invasive assessments include blood-based biomarkers such as circulating tumor cells (CTCs), circulating tumor DNA (CTDNA), and other circulating protein biomarkers [1]. In principle, the ability to detect cancer biomarkers in the blood (i.e. 'liquid biopsy') can enhance the accuracy of diagnosis or the detection of residual disease after treatment [2]. Both CTCs and CTDNA have been intensely studied for these purposes, but to date, the utility of CTCs is limited to certain cancer types and has very low sensitivity, and that of CTDNA is still limited by its ability to detect minimal residual disease, as well as being expensive and time-consuming [6]. Moreover, CTCs and CTDNA are both derived from dead cancer cells and are present in much smaller amounts than circulating cells or DNA from dead normal cells [7]. Circulating tumor exosomes (CTEs), on the other hand, reflect the genomic and transcriptomic contents of cancer cells and, because they are excreted constantly by viable cancer cells, are much more abundant than shed cells or DNA [3]. Exosomes are extracellular vesicles that store and transport genomic and transcriptomic substances such as DNA and RNA [4, 5] and are 30–150 nm in diameter [8]. When cells become cancerous, both their exosome excretion rate and the amounts of surface proteins and internal genetic material increase. Analyzing exosome contents can yield direct insight into the state of the original cancerous cell [9]. Like CTCs, CTEs cannot be directly amplified and analyzed by deep sequencing or polymerase chain reaction (PCR); rather, the current state of the art in CTE analysis involves targeting the internal DNA/RNA [3, 8, 10].
Exosomes are excreted by many types of mammalian cells, including blood cells, endothelial cells, immunocytes, platelets and muscles. They form an intercellular communication network and are responsible for regulating the bioactivity of recipient cells through the transport of lipids, proteins, and nucleic acids while they circulate in the extracellular space. Exosomes have been implicated in immune responses, tumor progression, and neurodegenerative disorders, and substantial effort has been directed toward identifying exosomal biomarkers such as proteomic (surface proteins) and genetic biomarkers for early detection and post-treatment prognosis in cancer.
Exosomal biomarkers discovered to date include both genetic and surface-protein biomarkers for bladder, breast, colon, gastric, liver, lung, ovarian, pancreatic and prostate cancers as summarized in table 1 [1–6, 8–30]. However, the diagnostic value of these potential biomarkers varies significantly. If they could be validated, circulating biomarkers would be particularly useful for the early diagnosis of all cancer types, the former because of the risk of complications as a result of transthoracic biopsies and the diagnostic limitation of random sampling of a large tumor mass and the latter because of the absence of symptoms until late in the course of disease. That said, proteomic biomarkers are less useful for this purpose for two reasons—they are less abundant on exosomes derived from healthy cells than from cancerous ones, and the typical exosomal proteins are typically not uniquely associated with specific types of cancer. Genetic biomarkers, on the other hand, usually are more reflective of the specific type of cancer and thus provide better clinical diagnostic value.
Table 1. Exosome-derived genetic and proteomic biomarkers for cancer diagnosis.
| Targeted | Surface | |||
|---|---|---|---|---|
| Cancer | Genetic Biomarker | Protein Biomarker | Application(s) | Ref |
| Bladder | lncRNA-PTENP1+,miR-146+ED,miR-375+,TP53,KDM6A+ | Apo B+ | Diagnosis | Early diagnosis | [2, 11, 12] |
| Breast | miR-1246+,miR-21++,miR-378e,miR-143 | CD63,CD81,Hsp70,Alix | Diagnosis | [8, 9] |
| Colon | miR-125-3p++,miR320-L+ED,miR-193a+ | CD63,Alix,TSG101,CD81,CD147 | Diagnosis | Early diagnosis | [1, 13–15] |
| Gastric | miR-451,lncRNA-UEGC1+,EGPC-3,TGPC-3 | CA19-9,CA72-4,CA12-5 | Diagnosis | [16–18] |
| Liver | Has-miR-122-5pM,Let-7a-5pM,miR-21-5pM,miR-199a-3pM,miR-18a+,miR-221+,miR-222+,miR-224+ | EpCAM,CD144,CD63,CD9,CD81 | Diagnosis | Monitor HIV/HCV infected patients for liver failure | [19–21] |
| Lung | miR-126+a,miR-21+,miR-155+,T790M+,L858R,miR-16 | CD9 | Diagnosis | Therapy | [5, 6, 22–25] |
| Ovarian | miR-32b+,miR-29a+,miR-30d+,miR-205+,miR-720+,SPINT2,NANOG | CD81,CD24+,Ca125,EpCAM,EGFR,MUC18,CLDN3 | Diagnosis | [3, 26, 27] |
| Pancreatic | miR-1246+,miR-4644+,miR-3976+,miR-4306+,KRAS-G12D+,TP53-R273H+ | GPC1,CD446+P,Tspan8+P,EpCAM,CD104+P | Diagnosis | Prognosis | [4, 28, 29] |
| Prostate | miR-1290+,miR-375+,TMPRSS2:ERG | CD73+ | Diagnosis | [10, 30] |
aBiomarker used for cancer therapy; +High potential to be used as a biomarker in clinical trials.
2. Commercially available approaches for exosome isolation
Several approaches for extracting exosomes from bodily fluids have been developed and are commercially available, each with its own specific protocol. The methods involved are summarized in table 2 [1, 2, 4, 6, 8, 10, 19, 26, 27, 31–35] and include polymer/buffer-based precipitation, ultrafiltration, membrane affinity spin columns, ultracentrifugation, and immunological separation. These methods, and ongoing efforts to achieve higher purity, yield, efficiency, reliability, and reproducibility from them, are described in the sections that follow.
Table 2. Commercially available products for isolating exosomes from bodily fluids.
| Commercial | Typical | Recovery | |||||
|---|---|---|---|---|---|---|---|
| Products | Registry/ | sample | yield, | ||||
| (Company) | Technology | Bodily Fluid | Immobilization | volume | % | Selectivity | Ref |
| ExoQuick (System Biosciences) | Polymer-based precipitation | Serum,Plasma | No | 100–250 μl | 53 | No | [1, 8, 10] |
| TEI Total Exosome Isolation Reagent (Thermo Fisher Scientific) | Polymer-based precipitation | Serum, Plasma Cell-free culture media | No | 1–10 ml | 50 | No | [31] |
| miRCURY (EXIQON) | Buffer-based precipitation | Plasma, Serum,Cell culture, Urine, | No | 0.5–1.4 ml 1–10 ml | >90 | No | [19] |
| exoEasy (QIAGEN) | Membrane affinity spin columns | Serum,Plasma | No | 0.2–4 ml | 40 | No | [2, 32] |
| Ultracentrifugation (Biocompare, Alfa Wassermann, Beckman Coulter) | Low-g spin | Serum,Plasma,Cell culture | No | 500 μl | 20–60 | No | [4, 6, 8, 26, 32] |
| Exocomplete Filterplate (Hitachi Chemical Diagnostics Inc.) | Filters of nano-membrane with pore sizes 0.1–0.8 μm | Urine,Serum,Plasma,Peritoneal fluid | Yes | 400 μl (96 samples per plate) | 75 | No | [27, 33] |
| ExoPureTM (Biovision Incorp.) | ELISA-based Immunoplate | Plasma,Urine | Yes | 50–100 μl | N/A | Yes | [34] |
| ExoTest (Galen laboratory supplies) | ELISA-based Immunoplate | Plasma,Urine,Serum,Cell culture | Yes | 100 μl | N/A | Yes | [35] |
| DynaBeads (Thermo Fisher Scientific) | Immunologic separation with magnetic beads | Cell culture | No | 100 μl | 47 | Yes | [8] |
ELISA, enzyme-linked immunosorbent assay; N/A, not available
2.1. Polymer/buffer-based precipitation
Polymer- or buffer-based precipitation of exosomes involves mixing a buffer or polymer-containing solution with the biological fluid sample and subjecting the mixture to low-speed centrifugation. Several commercially available kits provide simple, fast, and high yield isolation of exosomes, as listed in table 2 as ExoQuick, TEI, and miRCURY. In this precipitation technique, the physical forces on the exosomes are not intense, and thus the integrity of the outer membrane can be preserved. The pH of the mixture is held at close to the physiological level, which in turn preserves the integrity of the inner cargo of the exosome. This precipitation technique does not separate exosomes based on size, thereby resulting in a non-uniform size distribution of extracellular vesicles with non-exosomal impurities.
2.2. Sieving with membrane affinity spin columns
In this process, a binding solution is mixed with the biological fluid sample in a spin column containing a semi-permeable silica membrane and subjected to low-speed centrifugation. The centrifuge forces the binding solution through the silica membrane, thereby isolating the exosomes from the solution. Several research-grade commercial kits are available for this purpose, including ExoEasy. This process results in a relatively fast, high-purity extraction and preserves the integrity of the exosome for further analysis. However, this isolation process is also non-selective and requires prefiltration to remove larger extracellular vesicles (ideally through a 0.8 μm filter).
2.3. Ultracentrifugation
Ultracentrifugation, the most common technique used for exosome extraction, is a multi-step procedure that begins with low-speed centrifugation to remove cell debris, followed by high-speed centrifugation to remove larger extracellular vesicles, and a final step of precipitating the exosomes [4, 6, 8]. The ultracentrifugation procedure does not require additional chemicals or pretreatment of the biological fluid sample, and leads to lower contamination levels than polymer-based precipitation (ExoQuick and TEI) [31]. On the downside, ultracentrifugation is time-consuming, has a low recovery yield, risks damaging the outer membrane, and is non-selective.
2.4. Ultrafiltration
Isolation of exosomes by ultrafiltration is done by passing biological fluid samples through a membrane with pores 0.1–0.8 μm in diameter, which allows the exosomes to be separated from protein and other submicron particles larger than the pores. In commercial kits, the extracted exosomes are immobilized by trapping them in microwells. One of the most common commercially available ultrafiltration kits, the ExoComplete Filterplate, provides a simple and reproducible procedure that has a high throughput and recovery yield. Shortcomings of this approach are non-uniform exosome sizes and the possibility of pore clogging, which can damage the exosome.
2.5. Immunologic separation
Immunologic separation techniques target exosomal surface proteins with antibodies for selective isolation. Popular commercially available kits based on this technique are the enzyme-linked immunosorbent assay (ELISA)-based ExoQuant and ExoTest immunoplates, which are functionalized with antibodies that attach to specific exosomal surface proteins. The advantages of this approach are low non-exosomal contamination and surface immobilization that allows further analysis of single exosomes. Another type of immunological isolation involves using magnetic nanoparticles linked to antibodies (e.g. Dynabeads), which results in similarly selective and high-purity output. The primary disadvantage of immunologic separation techniques is cost of expensive antibodies.
Exosomes derived from different cells acquire different sets of protein/lipids that represent the state of the originating cell. Thus, the method used to isolate exosomes must consider specificity, that is, to ensure that all extracted exosomes belong to a specific subtype with a shared origin. Contamination with non-exosomal particles produce incorrect results that do not reflect the biological activity of the exosome. This type of failed diagnosis must be avoided at all cost. Commercial technology for exosome isolation provides higher purity than methods are still at the development stage, however, not all provide the option of specificity (table 2).
3. Commercially available approaches for exosome analysis
Harnessing the full potential of circulating tumor exosomes requires a selective isolation process with high purity. Once isolated, further characterization is required to provide the information needed for clinical diagnosis. Exosomes have been characterized by a variety of features, from their size to their genetic content. Size characterization can be done with scanning electron microscopy and atomic force microscopy [36], which allow visualization of single exosomes. Nanoparticle tracking analysis provides an alternative, flow-through approach for single exosome sizing and counting. However, simple variations in size do not reveal information on the complexity of the candidate biomarkers within the exosomes and by itself is of minimal diagnostic value. Unlocking the wealth of information stored in exosomes requires methods to analyze their genetic contents, surface protein biomarkers, or both (e.g. table 3) [4, 5, 8–10, 27, 34, 37, 38]. Enzyme-linked immunosorbent assay (ELISA) -based immunofluorescence, immunoblot imaging, and immunofluorescence flow cytometry are all used to analyze surface proteins on exosomes. ELISA-based immunofluorescence captures and analyzes specific surface biomarkers by sandwiching exosomes between two complementary antibodies, one attached to a functionalized assay and the other to a fluorescent or catalyst label, with quantitative analysis done through fluorescence or colorimetric response. Although this technique allows quantitative detection, it is time-consuming, has insufficient detection limits, and lacks single exosome counting capability [33]. Another form of surface-protein biomarker–based analysis, chemiluminescence immunoblot imaging, is similar to ELISA-based immunofluorescence imaging but does not immobilize the exosome at a specific region [37, 38]. Immunofluorescence flow cytometry involves labeling exosomes with fluorescent markers so that light is first absorbed and then emitted in a different wavelength. A unique feature of this approach is the ability to count thousands of exosomes rapidly. A known disadvantage of methods that target surface-protein biomarkers are their low diagnostic value relative to genetic biomarkers, because many surface biomarkers are also present on exosomes excreted by normal cells [36, 39]. They also have insufficient detection limit and resolution for counting single exosomes.
Table 3. Commercially available approaches for exosome analysis of genetic or proteomic biomarkers.
| Dynamic Range | |||||||
|---|---|---|---|---|---|---|---|
| Type of | Protein | Diagnostic | Multiplex | Detection Limit | |||
| Technology (company) | Technology | Biomarker | Selective | Value | Capability | (Molecule) | Ref |
| Exo 1000 (Exosome Diagnostics) | NGS | Genetic | — | + | — | 300–106 ml−1 10 ml−1 (Exosomal mRNA, miRNA or dsDNA) | [5] |
| Qrt-PCR (AH Diagnostics, Biocompare, Biomeme) | PCR | Genetic | — | + | — | 0.102–1.35 ng ml−1 0.102 ng ml−1 (mRNA, miRNA or dsDNA) | [4, 8–10, 27] |
| ExoQuantTM (Biovision Incorp.) | ELISA-based immunofluorescence capture | Proteomic | + | — | + | 1.78 × 10⁶–1.14 × 10⁸ μl−1 0.38 × 10⁵ μl−1 (Exosome) | [34] |
| AmerSham ImageQuant 800 Using ECL prime Amersham blotting detection reagent (GE Healthcare) | Immunoblot imaging | Proteomic | + | — | + | 40 pg μl−1–40 ng μl−1 40 pg μl−1 (Exosomal lysates) | [37] |
| Immunofluorescence fllow cytometry (Biocompare, Beckman Coulter) | Fluorescence- based imaging | Proteomic | + | — | + | 1.37 × 10⁵–4.57 × 10⁷ μl−1 1.37 × 10⁵ μl−1 (Exosome) | [38] |
ELISA, enzyme-linked immunosorbent assay; NGS, next generation sequencing; PCR, polymerase chain eaction; dsDNA, double-stranded DNA; miRNA, micro-RNA; mRNA, messenger RNA
The current state of the art genetic profiling of circulating tumor exosomes relies mainly on next-generation sequencing (NGS) [4] or quantitative real-time polymerase chain reaction (Qrt-PCR) analysis of dsDNA mutations or deregulation of mRNA and miRNA relative to exosomes in normal cells [10, 18, 20, 34]. Since the source of exosomes is typically unknown when extracted from blood or serum, genetic profiling alone cannot provide sufficient information to identify the precise location of tumor. However, if the patient is already diagnosed, genetic profiling can provide a powerful tool for monitoring disease progression and treatment response. The limitations of current genetic profiling are insufficient sensitivity, large blood volume required, and high cost.
4. Emerging optical technologies for exosome analysis
The most common strategies for exosome detection and analysis involve complicated, time-consuming procedures of limited accuracy (tables 2 and 3). Optical sensors offer great advantages that addresses challenges in exosome detection. Their advantages include high sensitivity, cost effectivity, and real-time detection. Optical technologies have the potential to detect exosomes at low concentrations, which has a high diagnostic value. Various optical methods have been developed for this purpose, among them photonic crystal and micro-resonators, fluorescence techniques, Raman and surface-enhanced Raman scattering (SERS), surface plasmon resonance (SPR), localized surface plasmon resonance (LSPR), and etc (table 4) [3, 26, 38, 40–62]. Both labeled and label-free methods can be designed to detect proteomic or genetic biomarkers.
Table 4. Emerging optical exosome analysis techniques.
| Detection Limit | | |||||||
|---|---|---|---|---|---|---|---|
| Dynamic Range | Potential | ||||||
| Extraction | Diagnostic | Targeted | (exosomes/RNA | Clinical | |||
| Detection Technology | Method | Application | Biomarker | Label- free | molar concentration) | Use | Ref |
| Photonic crystal and micro-resonator devices | |||||||
| 3D plasmonic photonic crystal (ppc) biosensor | UC | Fibroblast L cells | EpCAM | Yes | 10 μl−1 | 10−1 × 10⁴ μl−1 (Exosome) | — | [40] |
| Microfluidic photonic crystal biosensor | UC | Parasite infection | CD63 | Yes | 2.18 × 10⁶ μl−1 | N/A (Exosome) | Diagnosis | [41] |
| Frequency-Locked Microtoroid Optical Resonators | — | lymphatic cancer | CD81 | yes | Single exosome | N/A | Diagnosis | [42] |
| Fluorescence | |||||||
| Magnetic beads assisted on chip immunocapture in microfluidic device | UC | Breast cancer | HER2, EpCAM | No | N/A | N/A | Diagnosis | [43] |
| Microfluidic ExoSearch chip | ExoSearch chip | Ovarian cancer | CA-125, EpCAM, CD24 | No | 7.5 × 10² μl−1 | 7.5 × 10²–2.7 × 10⁴ μl−1 (Exosome) | Diagnosis | [3] |
| Self-assembled 3D herringbone nanopatterned microfluidic chip | UC | Ovarian cancer | CD24, EpCAM, FRα protein | No | 10 μl−1 | 10–103 μl−1 (Exosome) | Diagnosis | [44] |
| Single Molecule Localization Microscopy Imaging using blinking Si Quantum Dots (Super resolution optical imaging) | ExoQuick-TC | Breast cancer | CD63 | No | Single exosome | N/A | Metastasis | [45] |
| Copper-mediated signal amplification by cholesterol-modified magnetic bead capture | exoEasy Maxi Kit | Liver cancer | CD63 | No | 4.8 × 10⁴ μl−1 | 7.5 × 10⁴–1.5 × 10⁷ μl−1 (Exosome) | Prognosis | [46] |
| Microfluidic integrated immunomagnetic isolation and protein analysis | — | NSCLC | IGF-1R | No | 7.16 × 10⁴ | N/A (Exosomal Protein) | — | [47] |
| Digital qualification of exosomes by droplet microfluidics (droplet digital ExoElisa) | UC | Breast Cancer | CD63 GPC-1 | No | 10 μl−1 | 10–105 μl−1 (Exosome) | Diagnosis | [38] |
| Exosome miRNA detection using Molecular Beacon (MB) | TEI, ExoQuick-TC, UC | Breast cancer | miRNA-21 | Yes | 2 × 10⁷ μl−1 | N/A (Exosome) | Diagnosis | [48] |
| TEI | Breast cancer | miR-21,miR-375,miR-27a | No | 6 × 10¹⁰ μl | N/A (Exosome) | [49] | ||
| Fluorescence Resonance Energy Transfer (FRET) | UC | melanoma cells, breast cancer, ovarian carcinoma, liver cancer | CD63 | No | 1.4 × 10³ ml−1| 104–109 ml−1 (Exosome) | — | [50] |
| UC & TRIzol reagent | Breast cancer | miRNA-21 | No | 3 fM | 3–500 fM (miRNA) | Diagnosis | [51] | |
| Raman Spectroscopy | |||||||
| Optical tweezers assisted | UC | Mesenchymal stromal cells & ovarian cancer | CD9 | Yes | Single exosome | N/A | — | [52] |
| UC TEI | Lung cancer, hepatocar- Cinoma, ovarian Carcer, acute T-cell leukae- Mia, acute myeloblastic Leukaemia, prostate cancer | CD 9,CD 63 | No | Single exosome | N/A | — | [53] | |
| Surface Enhanced Raman Scattering (SERS) | |||||||
| SERS switch with DSN-assisted recycling amplification | UC & miRNeasy kit | NSCLC | miRNA-21 | No | 5 fM | 5 fM–20 pM(miRNA) | Diagnosis | [54] |
| Hybridization of miRNA and LNA on plasmonic head-flocked gold nanopillars | UC, UF exosome & TEI Kit | Breast cancer | miR-21, miR-222, miR-200c | No | 1 aM | 1 aM–100 nM (miRNA) | Early Diagnosis | [55] |
| Plasmonic nanowire interstice sensor | UC & miRNeasy kit | Prostate cancer | miR141, miR375 | No | 100 aM | 100 aM–100 pM (miRNA) | Diagnosis | [56] |
| Magnetic nanobeads assisted SERS nanoprobes | ExoQuick-TC | Breast cancer | HER2 | No | 268 aM | N/A (Exosome) | Diagnosis | [57] |
| Apta-immunocomplex assay on magnetic substrates | ExoQuick-TC | Breast cancer | HER2 | No | 32 μl−1 | N/A (Exosome) | Diagnosis | [58] |
| Colorectal cancer | CEA | 73 μl−1 | N/A (Exosome) | |||||
| Prostate cancer | PSMA | 203 μl−1 | N/A (Exosome) | |||||
| Silver film coated nanobowl SERS substrate | UC | Ovarian cancer | — | Yes | Single exosome | N/A | Study exosomes biological functions | [59] |
| Surface Plasmon Resonance (SPR) | |||||||
| Real-time detection on SPR sensor chip | TEI | Breast cancer | HER2 | Yes | 8.28 × 10³ μl−1 | 8.28 × 10³–3.31 × 10⁴ μl−1X (Exosome) | Diagnosis | [60] |
| Nanohole-based iNPS (intravesicular nanoplasmonic system) | UC | Ovarian cancer | EpCAM, CD63 AKT1, HSP90, HSP70, TSG101 | No | 104 μl−1 | N/A (Exosome) | Diagnosis | [61] |
| nanohole array based nano-plasmonic exosome (nPLEX) sensor | UC | Ovarian cancer | CD63,CD24, EpCAM | Yes | 670 aM | N/A (Exosome) | Early Diagnosis & Prognosis | [26] |
| Colloidal gold nanoplasmonics assisted SPR sensor chip | UC | Multiple myeloma in bone marrow | HSPGs | Yes | 60 pM | N/A (Exosome) | — | [63] |
| Localized Surface Plasmon Resonance (LSPR) | |||||||
| Self-assembly gold nanoislands -based biosensor | UC, TEI, ExoQuick | Lung cancer, neuro-blastoma | CD9 | Yes | 0.194 μg ml−1 | 0.194–100 μg ml−1 (Exosome) | Diagnosis & Prognosis | [64] |
| Nanoplasmonic pillars for digitized exosome detection | ExoQuick-TC | Breast cancer | CD63 | Yes | 1 × 10⁵ ml−1 | N/A (Single exosome) | Diagnosis | [65] |
| Bright field imaging | |||||||
| Gold nanoparticle- based lateral flow immunoassay | UC | Melanoma | CD9,CD63 | No | 8.54 × 10⁵ μl−1 | 8.54 × 10⁵–7.5 × 10⁷ μl−1 (Exosome) | Diagnosis | [66] |
CEA, carcinoembryonic antigen; DSN, duplex-specific nuclease; HSPGs, heparan sulfate proteoglycans; LNA, locked nucleic acid; PSMA, prostate-specific membrane antigen; TEI, total exosome isolation kit; UC, ultracentrifugation; UF, ultrafiltration; NSCLC, non-small cell lung cancer; N/A, 1200 exosomes = 268 aM
4.1. Photonic crystal and micro-resonator sensors
Photonic crystal is a popular plasmonic sensing platform that has been utilized for the detection of exosomes. In a recent study, 3D photonic crystal sensors are fabricated using nanoimprint lithography for exosome detection [40]. The 3D photonic crystal sensor developed with point defect cavities allows spacing in between the nanostructures that are comparable to the size of exosomes. This allows the exosomes to spread all around the 3D photonic crystals surface that can operate at low concentration of exosome solution. Another approach for exosome sensing is through surface functionalization of photonic crystal surface [41]. This approach provides a cheap and disposable sensor capable of selective sensing with improved spectral sensitivity and quick assay time. Functionalized microtoroid optical resonators is also a frequency-based technique that provides a selective exosome analysis. Furthermore, the frequency shift can also determine the size and mass of the adsorbed exosome [42].
4.2. Fluorescence
Fluorescence imaging is a commonly used technique for exosome detection. Considerable work has been done on microfluidic chip environment with on-chip immunomagnetic capture for selective isolation and specific analysis of fluorescence tagged exosome immunoassay [3, 43, 46, 47]. Among these fluorescence-based systems, ExoSearch chip which utilizes continuous flow mixing with single step multiplexed detection of exosomes from clinical samples is very promising as a point-of-care diagnostic tool [3]. The major limitations of these conventional platforms namely, effective mass transfer, surface binding capability and near-surface flow resistance hinders the detection of exosomes at low concentrations which is crucial in early diagnosis. This is successfully addressed by microfluidic system with self-assembled 3D herringbone patterns enabling detection of extremely low counts of exosomes with few microliters of sample volume [48]. Apart from proteomic biomarkers, genetic biomarkers such as microRNAs are favorable as they show high specificity in determining cancerous exosomes. Detection and quantification of miRNA levels in cancer cell exosomes by a nano-sized oligonucleotide probe, molecular beacon (MB) with a fluorophore and a quencher at each end is another prominent way for making probes with high specificity and low background fluorescence [48, 49]. Measured fluorescence signal from the hybridization reaction of miRNA to MB corresponds to the exosome concentration in the sample. Recent studies used various techniques to increase the delivery of MBs into exosome for enhancing the hybridization signals. Permeabilization using pore-forming bacterial toxin is one such method which is successfully implemented for the influx of MBs into exosomes. Such techniques for detecting exosomes allow quick and simple early diagnosis of various diseases.
Fluorescence resonance energy transfer (FRET) is used for exosome detection via energy transfer between two light-sensitive molecules [50, 51]. Fluorophore labeled aptamer is selectively adsorbed onto metallic nanosheets, quenching the fluorescent signal. The fluorescence signal is recovered when exosome binding occurs. FRET based sensors can detect exosomes 3-orders of magnitude better than that of ELISA [50]. This new direction in fluorescence detection has gained significant attention in biomedical fields and can be used in multiplex detection. In addition to conventional fluorescence-based detection methods, metal/plasmon enhanced fluorescence (M/SEF) is considered a powerful emerging optical technology for biosensing applications [67–69]. A fluorescence signal is enhanced by plasmonic coupling when fluorophores are near but not too close to a metal nanostructure and thereby improving sensitivity. A typical 'sweet spot' for M/SEF is about 7–10 nm separation between the fluorophore and the metal surface because fluorescence quenching occurs when the fluorophore is too close to the metal surface.
4.3. Raman spectroscopy
Raman spectroscopy is one of the powerful characterization techniques which provides detailed information on material composition, chemical structure, crystal orientation and molecular interactions based upon the molecular vibrational modes. Combination of Raman spectroscopy with optical tweezers is a promising route to analyze individual nanoparticles that are undetectable with conventional microscopy. Recently, Laser tweezers Raman spectroscopy has been studied for exploring the chemical composition of cancerous and non-cancerous exosomes [53]. Multispectral optical tweezers is an extension of this technique which incorporates fluorescence with Raman Spectroscopy for multiplex quantification [52]. Although this technology has the potential for distinguishing exosomes from different cell lines depend on spectral variation. However, Raman spectroscopy suffers from weak signals and difficulty in evaluating complex mixtures at low concentrations.
4.4. Surface enhanced Raman scattering
Surface enhanced Raman scattering (SERS) provides enhanced Raman 'molecular fingerprint' in complex biological environments and offers excellent multiplexing ability due to its narrow spectral bandwidth. A unique way for quantitative detection of exosomal miRNA by SERS switch method involves duplex-specific nuclease (DSN)-assisted signal amplification which operates at low concentrations. The technique utilizes hybridization of miRNA with capture probes enriched SERS nanoparticles (Nps). DSN is used to cleave off the hybridization to release the SERS Nps. This process gets recycled multiple times for signal enhancement [54]. Several reports describe detection of exosomes with magnetic beads assisted SERS probes. Magnetic beads coated with aptamers used as the capturing substrate and SERS nanoparticles as the signal source, which uses the multiplexing capabilities of Raman reporters [58]. Overall, these SERS-based strategies are simple, expedient and have high sensitivity relative to other existing exosome detection methods.
4.5. Surface plasmon resonance
Surface plasmon resonance (SPR) has been studied extensively for quantitative and qualitative optical bio-sensing technologies which uses local refractive index changes on the sensor surface. Recent studies show the feasibility of exosome membrane protein analysis through SPR- based nanoplasmonic sensors [61, 63]. nPLEX sensors consist of optical transmission through periodic nanohole arrays which are matched to the size of exosome is a nominal way of employing surface plasmon resonance for quantitative profiling of exosomal proteins. Spectral and/or intensity variation is monitored for each functionalization step as a confirmation of surface modification and capturing exosomes in real-time [26]. A next-generation nanoplasmonic sensor, intravesicular nanoplasmonic system (iNPS) involving lysis of exosomes to expose all proteins is used to detect both transmembrane and intravesicular proteins simultaneously. The immuno-captured proteins are labeled with gold nanoparticles for further signal amplification by plasmonic coupling. This technique overcomes the incompatibility of older methods with intravesicular proteins [61]. SPR based techniques provide a powerful detection method which is in its research and development stage. Further validation and technical modifications should be explored for this approach to be implemented in clinical practice.
4.6. Localized surface plasmon resonance
Common techniques for detecting and characterizing proteins such as ELISA and SPR are not well-suited for the size and complexity of exosomes. Localized surface plasmon resonance (LSPR) sensing techniques is considered as an ideal platform for achieving exosome detection at low concentration. Most research focus on changing the shape of plasmonic nanostructures for enhancing the LSPR sensor performance characterized either by refractive index bulk sensitivity or figure of merit defined by the ratio of bulk sensitivity and full width at half maximum of the resonance peak. LSPR based approach can easily achieve single-exosome detection by matching sensor dimension to the size of the individual exosome [40, 41, 64, 65]. LSPR imaging mechanism involving patterned gold nanosensors that are size matched to a single exosome improved the limit of detection down to a single exosome. The sensors built on top of quartz nanopillars, allow smaller proteins/molecules to be distinguished from exosomes and thereby reduce the nonspecific binding. This approach can be used to detect single-exosome in femtomolar concentration levels [65].
4.7. Microfluidic plasmonic detection on nanoporous gold disk arrays
Our group has developed a unique, high-performance plasmonic nanoarray consisting of nanoporous gold disks (NPGDs). We created an array of single NPGDs with a tunable diameter from 200 to 500 nm, 75 nm thick, and with interconnected internal pores (7–15 nm) by using hybrid fabrication that combined lithographic patterning and atomic dealloying (figure 1(a)–(d)) [70, 71]. In addition to having a greatly enlarged surface area that allows ∼10X binding sites, a striking feature of NPGD is that high-density 'hot spots' are distributed across the entire particle, in drastic contrast to other plasmonic nanoparticles that have primarily dipolar 'edge' resonance. As a rule of thumb, target binding to hot spots generates significant LSPR shifts; those that bind to 'dark spots' are unlikely to be detected. As a result, NPGD nanoarrays have superior sensitivity to target binding and fewer 'blind spots.' The 3D porous network throughout the NPGD in a 45° angle is illustrated in figure 1(e), with a finite-difference-time-domain computed image of electrical field distribution shown in the inset.
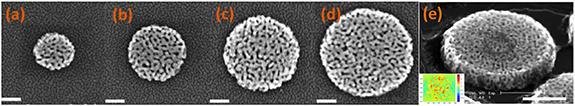
Figure 1. Scanning electron microscopy (SEM) images of nanoporous gold disks (NPGDs) of various diameters: (a) 200, (b) 300, (c) 400, (d) 500 nm. (e) NPGD viewed from 45° to show its 3D porous network. Scale bar: (a)–(e) 200 nm.
Download figure:
Standard image High-resolution imageWe have developed several fabrication techniques to produce NPGD arrays in a scalable fashion. We used nanosphere lithography to fabricate wafer-scale NPGD arrays on silicon and glass substrates (figure 2(a)). Nanosphere lithography can produce highly regular NPGD arrays with hexagonal configuration and tunable center-to-center distance that is much smaller than the disk diameter (figure 2(b)). Alternatively, electron beam lithography has also been used to fabricate NPGD arrays in square configurations with precise diameter and center-to-center distance; an array with 100 nm disk diameter and 100 nm spacing is shown in figure 2(c), and another array with 200 nm disk diameter and 100 nm spacing is shown in figure 2(d).

Figure 2. Nanoporous gold disk (NPGD) nanoarrays in various configurations. (a) Large-scale NPGD array fabricated by nanosphere lithography; (b) hexagonal nanoarray configuration by nanosphere lithography; (c) square nanoarray with 100 nm disk diameter and 100 nm edge-to-edge spacing; (d) square nanoarray with 200 nm disk diameter and 100 nm edge-to-edge spacing. Scale bar: (a) 5 μm, (b) 500 nm, (c) 200 nm and (d) 500 nm.
Download figure:
Standard image High-resolution imageWe have used NPGD disk arrays to implement several molecular sensors for high-sensitivity and high-specificity sensing of various target molecules such as DNA [42, 69], malachite green [72], creatinine [73, 74], rhodamine 6G [75], urea [75], dopamine [75], glutamate [75], cyanine 3 [42, 69], hydrocarbons [76], urine acetaminophen [74], telomerase activity [77], among others, with single molecule limit of detection and concentrations in the nM to pM range (ppb-ppt), as well as cellular targets such as bacterial cells and spores with single-unit sensitivity [78, 79]. These results indicate the universal high sensitivity and label-free fingerprinting nature of our plasmonic sensor and the robustness and reproducibility of the NPGD nanoarray as high-performance plasmonic substrates. In addition to biosensing, NPGD has been shown to provide plasmon-enhanced heterogeneous catalysis [62], and is a highly effective photothermal platform [80–83].
4.7.1. Functionalizing the nanoarray surface for specific enrichment and detection of circulating tumor exosomes
To enhance exosome detection, we have functionalized the NPGD nanoarray surface with antibodies that can recognize upregulated surface antigens on cancer exosomes such as CD9, CD63, and CD81. Briefly, a thiol-poly(ethylene-glycol) (PEG)-biotin self-assembled monolayer is first coated onto the nanoarray surface by incubating overnight at 5 mM. Neutravidin is then introduced, followed by the biotin-antibody. To ensure the control of highly precise surface functionalization, the in situ LSPR shift (Δλ) is monitored during the entire process flow including the binding sequence of neutravidin, anti-CD63, and two types of exosomes as shown in figure 3. The amount of LSPR shift was found to correlate well with the exosome concentration, and the sensor could readily detect exosomes at 108 ml−1 concentration. The results suggest that anti-CD63 has a much higher capturing efficiency of cancer exosome (H460) over non-cancer exosome (HETA-1).

Figure 3. Plasmonic sensing of two types of exosomes: LSPR shift vs. successive binding.
Download figure:
Standard image High-resolution image
5. Emerging non-optical approaches to exosome analysis with the potential for commercialization
Other non-optical approaches for isolating and quantifying exosomes that have the potential for commercialization include electrochemical, electromechanical, electric field-induced, and electromagnetic techniques. These techniques are summarized in table 5 [84] and described briefly in the sections that follow.
Table 5. Emerging non-optical approaches for exosome analysis.
| Detection | |||||||
|---|---|---|---|---|---|---|---|
| Extraction | Diagnostic | Targeted | Limit | Dynamic | Potential | |||
| Detection Technology | Method | Application | Biomarker | Label-Free | Range | Clinical Use | Refs |
| Electrochemical | |||||||
| Differential pulse voltammetry | UC | Breast cancer | CD81 | Yes | 77 EVs/ml | 102–109 EVs/ml | Early Diagnosis | [84] |
| Quantum dot-based enhanced stripping voltammetry | UC Magnetic isolation | Breast and colon cancer | CD9,CD63 | No | 100 EVs μl−1 | 102–109–EVs μl−1 | Diagnosis | [85] |
| DNA nanotetrahedron-assisted (DNA-based nanostructure) | UC | Hepatocellular liver cancer | Aptamer | Yes | 3.96 × 10⁵ EVs ml−1 | 3.96 × 10⁵–106 EVs ml−1 | Diagnosis | [86] |
| Electro-Mechanical | |||||||
| Nanomechanical sandwich assay (cantilever deflection) | UC | Breast cancer | CD63,CD24,EGFR,Glypican-1 | Yes | 2 × 10² EVs ml−1 | N/A | Diagnosis | [87] |
| Electro-Magnetic | |||||||
| Integrated magneto−electrochemical sensor for exosome analysis (iMEX) | Immuno-magnetic isolation | Ovarian cancer | CD63, EpCAM, CD24,CA125 | No | 3 × 10⁴ EVs ml−1 | 3 × 10⁴–105EVs ml−1 | Diagnosis | [88] |
| Electric-field induced | |||||||
| Electric field-induced release and measurement | Electric-field induction | Lung cancer | CD63 | No | N/A | Diagnosis | [89] |
EV, extracellular vesicles; UC, ultracentrifugation; N/A, not applicable
5.1. Electrochemical
Electrochemical sensors are based on a redox reaction that produces an electrical signal proportional to the concentration of the analyte at a working electrode. The methods for measuring potential differences between electrodes or generated current are called potentiometry and amperometry. Voltammetry is a commonly used subcategory of amperometry that measures the current as the applied potential varies. The main advantage of the electrochemical sensors is their high sensitivity as well as their simplicity [90–92]. They can easily be miniaturized, which makes them highly applicable for personalized medicine and clinical settings. In one report, breast cancer exosomes at a concentration of 102 exosomes per ml were detected by binding CD81-containing exosomes to immuno-modified gold electrodes via differential pulse voltammetry and electrochemical impedance spectroscopy [84]. To enhance the sensitivity of this approach, another group implemented quantum dots–enabled signal enhancement in anodic stripping voltammetry quantification to detect tumor exosomes in serum at a concentration of 105 exosomes per ml [85]. Another novel method of DNA nanotetrahedron-assisted aptamers for capturing exosomes on gold electrodes [82].
5.2. Electro-mechanical
Another innovative approach to quantify exosomes is based on measuring electro-mechanical properties of a micro-cantilevers. The measurement involves a sandwich technique in which multiplexed cantilever array sensors compare the expression level of exosomal-surface antigens to distinguish, in real time, tumorigenic from nontumorigenic exosomes [87]. In this method, the nanomechanical bending is scaled proportionally with the concentration of exosomes in the samples. The technique is simple and offers an inexpensive opportunity to develop other exosome isolation techniques for early diagnosis of disease.
5.3. Electro-magnetic
In a novel application of immunomagnetic separation, a portable, integrated magnetic-electrochemical exosome (iMEX) sensor was developed in which magnetic beads are used to immunomagnetically capture and label exosomes, which are then profiled through electrochemical sensing. This approach offers several practical advantages: (i) cell-specific exosomes can be isolated directly from complex media without the need for extensive filtration or centrifugation; (ii) the detection sensitivity is high owing to magnetic enrichment and enzymatic amplification; (iii) by means of the electrical detection scheme, the sensors can be miniaturized and expanded for parallel measurements [88]. The parallel nature of iMEX detection recently enabled simultaneous measurements of four putative cancer markers (CD63, EpCAM, CD24, and CA125). These experiments demonstrated the iMEX's clinical potential for on-the-spot detection of exosomes and other extracellular vesicles.
5.4. Electric field-induced
An electric field, particularly one with a non-uniform profile, can stimulate vesicle deformation in biological samples and direct the flow of the released biomolecules. Therefore, an assay called electric field-induced release and measurement (EFIRM) was developed to quantify the contents ('cargo') of exosomes [89]. After exosome capture by anti-CD63 antibody-labeled magnetic beads, the exosome membrane is disrupted by low-voltage electric cyclic square waves, leading to the release of the inner cargo. Among these cargo contents are specific RNAs or proteins which are then hybridized to DNA primers or antibodies on an electrode surface. This process allows a quantification process of captured exosomes on changes in the electrical current. This technology has the unique advantage of quantifying exosome cargo without using chemical lysis, which might interfere with analytical procedures.
6. Conclusion
Analysis of circulating tumor exosomes is a form of liquid biopsy that can provide insights on the state of a cell without the need for invasive procedures. Proteomic biomarkers are less useful for diagnosis for two reasons—they are less abundant on exosomes derived from healthy cells than from cancerous ones, and surface proteins are typically not uniquely associated with specific types of cancer. Genetic biomarkers, on the other hand, usually are more reflective of the specific type of cancer and thus provide better clinical diagnostic value. However, technical challenges remain in acquiring and translating the results into early diagnosis and detection of residual cancer, the greatest among them being the isolation of exosomes from body fluids, which requires various slow and complicated steps for purification. Although exosomes can be isolated by several different methods, not all are selective. Once exosomes are isolated, analyses are done with commercial devices that are not yet fully capable of analyzing both proteomic and genetic biomarkers. The primary obstacles for most approaches are insufficient detection limits, no single exosome counting capability, and a small dynamic range, all of which lead to low sensitivity. Optical technologies provide sensitive and selective methods that overcome obstacles associated with exosome detectioN/Analysis. Optical technologies are the most commonly reported method for exosome detection and has the potential to achieve fast, accurate and reliable results. Combining optical methods, such as SPR or LSPR with fluorescence, can lead to advancements that can detect both proteomic and genetic biomarkers that would provide unprecedented capabilities for early and residual cancer detection.