


Abstract
We report exceptionally large tunnel magnetoresistance (TMR) for biomolecular tunnel junctions based on ferritins immobilized between Ni and EGaIn electrodes. Ferritin stores iron in the form of ferrihydrite nanoparticles (NPs) and fulfills the following roles: (a) it dictates the tunnel barrier, (b) it magnetically decouples the NPs from the ferromagnetic (FM) electrode, (c) it stabilizes the NPs, and (d) it acts as a spin filter reducing the complexity of the tunnel junctions since only one FM electrode is required. The mechanism of charge transport is long-range tunneling which results in TMR of 60 ± 10% at 200 K and 25 ± 5% at room temperature. We propose a magnon-assisted transmission to explain the substantially larger TMR switching fields (up to 1 Tesla) than the characteristic coercive fields (a few Gauss) of ferritin ferrihydrite particles at T < 20 K. These results highlight the genuine potential of biomolecular tunnel junctions in designing functional nanoscale spintronic devices.
Export citation and abstract BibTeX RIS

Original content from this work may be used under the terms of the Creative Commons Attribution 4.0 license. Any further distribution of this work must maintain attribution to the author(s) and the title of the work, journal citation and DOI.
1. Introduction
Charge transport through self-assembled monolayer (SAM)-based tunnel junctions generally occurs through quantum mechanical tunneling, and enables novel electronic function potentially complementary to devices based on semiconductors [1–3]. For applications in spintronics, it is fundamental to efficiently inject spin-polarized carriers and transport them across the molecules inside the junctions. Achieving such goal is, however, highly challenging owing to the presence of structural imperfections and defects at the ferromagnetic (FM)/molecule interfaces (e.g. step edges, pinholes, or grain boundaries, or oxide formation) [4–6], impedance mismatch [7], or due to the complexity in controlling the nanoscale interface and the energy level alignment of the molecular junction [7]. Consequently, examples of magneto-transport across (bio)molecular tunneling junctions are rare, while the obtained performances have remained very modest to date [8, 9]. Here, we succeed in fabricating biomolecular tunnel junctions that incorporate a SAM of highly symmetrical, thermally stable (up to 80 °C) protein cages derived from a two alanine-modified Archaeoglobus fulgidus ferritin (AfFtn-AA) [10] loaded with ferrihydrite. The ferritins are anchored on ultra-smooth and oxide-free FM surfaces with EGaIn top-contacts (see figure 1 below). The resulting ferritin-based tunnel junctions display a remarkable 60% tunnel magnetoresistance (TMR) at 200 K (25% TMR at room temperature). We attribute this good TMR performance to a new mechanism of spin polarized charge transport that involves long-range tunneling across ferritin, possibly assisted by magnons excited in the ferrihydrite nanoparticles (NPs), while the protein cage efficiently decouples the magnetic ferrihydrite core from the FM bottom electrode, providing a clean tunneling barrier eliminating the need for impedance matching.
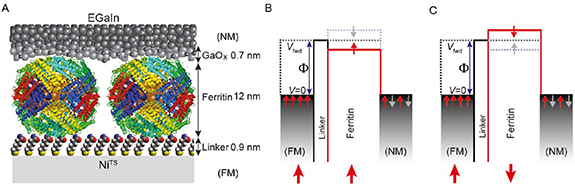
Figure 1. Schematic illustration of the NiTS/linker/ferritin//GaOx /EGaIn the junction, where the GaOx /EGaIn is a nonmagnetic metal (NM) top-electrode and the ferritin is an insulating barrier as well as spin-filter. We used GaOx /EGaIn stabilized in a through-hole in a transparent polymer (polydimethylsiloxane (PDMS)) enabling low-temperature measurements [11]. (B) and (C) Schematic illustrations representing the energy states of a typical magnetic tunnel junction (MTJ) where the relative orientation of the magnetization of the two magnetic layers, in this case Ni and ferritin ferrihydrite particles, determines the resistance of the junction. The work function of the Ni surface coated with linker SAM is 4.0 eV [4] which is similar to that of the top electrode (4.3 eV) [12, 13]. [13] John Wiley & Sons. [© 2016 WILEY‐VCH Verlag GmbH & Co. KGaA, Weinheim].
Download figure:
Standard image High-resolution imageSpin transport phenomena across MTJs are studied in several types of device geometries. Usually, two FM electrodes are separated by a thin insulating layer, which serves as the tunneling barrier. A SAM provides a well-established means to chemically and physically modify a metal surface by lowering the energy barrier for charge injection as well as reducing the role of impedance matching [4, 14, 15]. Electrons tunnel across the SAM if a bias voltage is applied between the two FM electrodes. The resistance R of the junction depends on the magnetization direction of the two FM electrodes, which can be tailored by an external magnetic field, resulting in the TMR signal. The resistance of the junction is in principle smaller when both electrodes have parallel magnetization, RP, rather than antiparallel magnetization RAP. The magnitude of the TMR is defined by equation (1) [6]:

Typical TMR values in this class of MTJs lie within the 1%–10% range at room temperature [9].
TMR can also be obtained in spin-filter tunnel junctions [16], where a FM insulator is inserted as a spin-filtering tunneling barrier in between a FM and non-magnetic electrode. The spin-filter effect is an interlayer-controlled process, with the ability to selectively allowing for the transfer of one type of spin (up or down) through the interlayer. The performance of TMR depends on interface roughness [7], surface oxidation of the FM electrode [17], and electron spin phase coherence across the junction [18], amongst other factors [19–22].
Although TMR is well-known in junctions with insulating tunnel barriers sandwiched between two FM electrodes, studies of junctions with a spin-filter tunnel barrier are scarce, with generally poor performances at room temperature (typically few percent) [8]. Experiments have shown that biomolecules [8, 23], single-molecule magnets [1, 24, 25], and magnetic NPs [26, 27], can act as spin filter when incorporated in the tunneling barrier. The shape, size, and stability of the magnetic NPs play an important role in their magnetic properties and, consequently, in their performance. To date, values of TMR of 60%–300% have been reported at low temperatures (<10 K) for tunnel junctions incorporating these nanoscale magnetic systems, but performances usually decrease very fast with increasing temperature [27, 28]. For instance, Naaman et al recently reported magnetoresistance of only 2% at room temperature across biomolecular MTJs of the form Au/linker/biomolecule/MgO/Ni with bacteriorhodopsin [23]. Alternatively, it has also been recently shown that chiral biomolecules such as DNA may mediate spin-filtering based on 'chiral-induced spin selectivity', with spin filtering of up to 60% [29], although this requires ultrahigh-vacuum conditions and optical detection, whereas the transfer mechanism at play remains obscure. Compared against traditional MTJs with applications in, for instance, hard disk drive read-heads, magnetic random access memory, and sensors which typically consist of 8–64 layers with 70%–604% of magnetoresistance at room temperature [30–32], the advantage of our devices is in their relatively simple structure consisting of only three layers (the two electrodes and the biomolecular layer) with a reasonable TMR of 25% at room temperature. Some distinctive features of ferritin are its highly symmetrical structure with innate capability to store and release iron in a controlled fashion. The hollow globular cage-like structure (with an outer diameter of 12 nm and an inner diameter of 8 nm) is formed by the self-assembly of 24 protein subunits. Iron is stored in the form of ferrihydrite NPs inside the protein cage. Therefore, the ferrihydrite NPs are separated from each other by at least 4 nm formed by the 2 nm thick protein shell of two adjacent ferritins. The magnetic properties of ferritins have been widely studied in powder form and depending on the iron oxide loading conditions, iron oxide loading, and types of ferritin, they exhibit a rich variety of controllable magnetic properties including superparamagnetism [33, 34], antiferromagnetism [35, 36], or ferrimagnetism [33, 37], and have manifested one of the first observations of quantum tunneling of the magnetic moment [38]. We recently reported that tunneling across ferritin is highly efficient as evidenced by a low tunneling decay coefficient of 1.30 ± 0.02 nm−1 [13]. For these reasons, we studied the magnetic properties of ferritin incorporated in large-area molecular junctions of the form of FM-linker-ferritin//GaOx /EGaIn junctions, where the FM electrode is ultra-flat template-stripped nickel (NiTS). In this work, we replaced the AuTS bottom electrode in our previous work [38] with a FM NiTS electrode. This replacement results in a ferritin-based junction that shows TMR characteristics as a consequence of magnetic polarization of the conduction (or tunneling) electrons. The detailed monolayer characterization of ferritin and fabrication of the MTJ are described in Section 4 and SI (figures S1–3, and table S1 (available online at stacks.iop.org/JPMATER/4/035003/mmedia). In this study, the ferrihydrite NPs were formed inside the ferritin under anaerobic (An1200Fe AfFtn-AA) which is more magnetic than that prepared under aerobic (A1200Fe AfFtn-AA) conditions. The loading of iron ions per ferritin cage is indicated by 1200Fe (i.e. we loaded 1200 iron ions per cage, determined with inductively coupled plasma atomic emission spectroscopy as reported before) [39]. The fabrication of the NiTS and the GaOx /EGaIn top electrodes (EGaIn stands for eutectic gallium–indium; 75.5% Ga and 24.5% In by weight) have been reported elsewhere (see Section 4 for details) [4]. We note that the ∼0.7 nm thin layer of GaOx is highly conductive (resistivity ∼2.9 × 10⁻² Ω cm2) [40], and has a metal-like behavior [41], which prevents the bulk EGaIn from alloying with the bottom electrode. The TMR response of the junction was measured as a function of an in-plane magnetic field to control the magnetic polarization of both magnetic ferrihydrate NPs inside the ferritin and the NiTS electrode. Figure 1 displays the typical energy landscape in a TMJ resulting in TMR, where the two magnetic layers align parallel (low R) or antiparallel (high R) to each other. Before describing the TMR measurements of the junctions, it is instructive to discuss the characterization of the junctions in detail.
2. Results
First, we characterized the magnetic properties of An1200Fe AfFtn-AA and A1200Fe AfFtn-AA in freeze-dried powder form by using a superconducting quantum interference device (SQUID). Figure 2(A) shows the room temperature magnetic hysteresis loops, which saturate at an applied magnetic field of around 0.89 and 1.0 T for AnFe1200 AfFtn-AA and AFe1200 AfFtn-AA, respectively (table 1). Figure S4 shows the room temperature magnetic hysteresis loops for apo-AfFtn-AA, which exhibit diamagnetic characteristics. The corresponding magnetic moment from the saturation of the magnetic moment is estimated to be ∼2500 µB and ∼481 µB per ferritin cage for An1200Fe AfFtn-AA and A1200Fe AfFtn-AA, respectively. These values are larger than those of ferrihydrite NPs inside ferritin (260–500 µB) reported elsewhere [37, 43–46], but smaller than those of NPs of pure magnetite or maghemite with diameters of 5–11 nm, which reach up to 21 600 µB [47]. Thus, the measured magnetic moments in our experiments are within the range of previously reported values, whereas ferritin loaded under anaerobic conditions has a value of µB of about one order of magnitude higher than that of ferritin loaded in aerobic conditions.
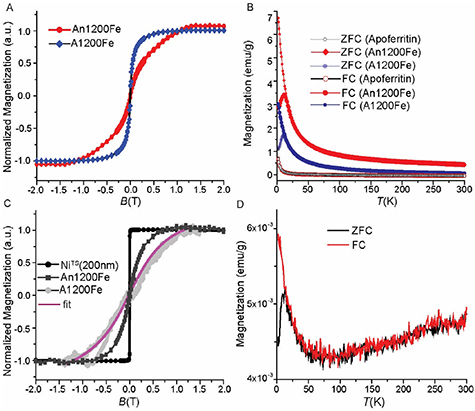
Figure 2. (A) Magnetic hysteresis loops of An1200Fe AfFtn-AA, and A1200Fe AfFtn-AA in powder form measured at 300 K and (B) their corresponding ZFC/FC (zero field cooling-field cooling) curves measured at 1000 Oe. (C) Magnetic hysteresis loop of NiTS (200 nm) surface, and An1200Fe AfFtn-AA self-assembled on AuTS sample measured by SQUID at 300 K, and A1200Fe AfFtn-AA self-assembled on AuTS was measured by magneto-optic Kerr effect technique of the field-dependent magnetization curve at room temperature. (D) The ZFC/FC curve of An1200Fe AfFtn-AA monolayer. The measurements presented in panels ((C)–(D)) were carried out in an in-plane magnetic field (i.e. field parallel to the bottom NiTS electrode). The magnetization reported here are an overall magnetic moment without subtracting the protein shell and salt present in the powder samples.
Download figure:
Standard image High-resolution imageTable 1. Magnetic properties of the ferritins.
| Sample | Hs a (T) | Ms b (µB/ferritin) | Ms c (emu g− 1) | Hc c (kOe) | TB (K) |
|---|---|---|---|---|---|
| An1200Fe (powder) | 0.89 | ∼2500 | 44.80 | 3.26 | 9.6 |
| A1200Fe (powder) | 0.89 | ∼418 | 33.10 | 2.99 | 11.0 |
| An1200Fe (SAM) | 0.90 | ∼917 | 0.02 | 1.7 | 11.4 |
| A1200Fe (SAM) | 1.10 d | — | — | — | — |
| NiTS (200 nm) | 0.30 | — | — | — | — |
a The saturation magnetic field (Hs) measured at room temperature measured using SQUID. b The magnetic moment determined from SQUID. c The coercive field (Hc) and remnant saturation magnetization (Ms) measured for freeze-dried ferritin powder at 2 K. d The saturation magnetic field (Hs) measured by magneto-optical Kerr effect (MOKE) technique at room temperature for a monolayer of A1200Fe AfFtn-AA SAM on AuTS.
It is important to observe that ferritins in powder form do not exhibit coercivity at 300 K (figure 2(A)), indicating superparamagnetic behavior. Such a superparamagnetic behavior is observed down to ∼10 K (see below and figure S5). For lower temperatures, the magnetic moment of the particles is pinned to the anisotropy axis resulting in small coercivity and hysteretic magnetization dynamics (see open hysteresis loops obtained at T < 10 K in figure S5). The observed slow saturation of the magnetization curve in the magnetic hysteresis loops of the An1200Fe sample suggest that this sample contains a larger variation of the Fe ion content inside the ferritins cages as compared to that of the A1200Fe which shows a faster and smoother approach to saturation. This slow saturation is usually related to the nanometer size of the ferrihydrite NPs inside the ferritin cage (which are a mixture of magnetite and maghemite, see figure 3 below). At 2 K, we derive the saturated magnetization values of A1200Fe AfFtn-AA of ∼33 emu g−1 and ∼44 emu g−1 for An1200Fe AfFtn-AA, which are lower than the value of 71 emu g−1 corresponding to pure FM Fe3O4 NPs of ∼6.0 nm [48]. Thus, it is likely that the mineralization of iron oxide inside the ferritin at anaerobic conditions induces the formation of FM NPs, as previously observed in other types of ferritin (e.g. human, horse spleen, or bacteria) [49, 50]. The ferritin in this study is derived from the extremothermophilic archaeon Archaeoglobus fulgidus (AfFtn) and exists in the form of dimers which self-assemble in the presence of divalent metal ions (FeII ions) to form a 24-mer cage structure. The iron core radius of AfFtn (4.26 nm) is larger than that of bacterial ferritin (3.96 nm) and human ferritin (3.95 nm) [51]. An engineered version (K150 A, L151 A) of the archeal ferritin (AfFtn-AA) [10] with a closed pore has been used in this study (note, the Fe ions are mineralized during the self-assembly process). In addition, we carried-out the iron oxide mineralization under a controlled environment at elevated temperature (65 °C) under anaerobic conditions which results in a more magnetic form of the iron oxide mineral (magnetite) than under aerobic conditions at room temperature [52]. This difference in preparation methods results in the higher magnetic moment as observed in this study than those for commonly used ferritin. The presence of FM NPs in the An1200Fe AfFtn-AA is confirmed by detailed SQUID and x-ray magnetic circular dichroism (XMCD) characterization measurements (figures 2 and 3).

Figure 3. The x-ray absorption spectroscopy (XAS) results of Fe L2,3 edges for (A) An1200Fe AfFtn-AA and (B) A1200Fe AfFtn-AA self-assembled on the NiTS surface at room temperature along with fits to identify and assign the Fe2+ and Fe3+ signals using the CTM4XAS [42]. XAS spectra of (C) Fe L2,3 and (D) Ni L2,3 edges for two different external magnetic field directions at room temperature. The difference between XAS signal observed at +1.5 T and −1.5 T defines the XMCD signal. Its intensity and sign show the information about the orientation of the relevant magnetic dipoles.
Download figure:
Standard image High-resolution imageFigure 2(B) shows the temperature dependence of the magnetization measured upon FC and ZFC under an applied field of 1000 Oe. The curves show typical superparamagnetic behavior with a well-defined blocking temperature (TB) for An1200Fe AfFtn-AA and A1200Fe AfFtn-AA of ∼10 K. Upon further cooling the sample below the TB in the FC configuration, the magnetization curve increases considerably for both instead of the usual leveling off [53] which further confirms that the ferritin core consists of superferromagnetic NPs. Here, long-range magnetic interactions occuring between the NPs inside the ferritin core can explain our observations, similar to that of Curie-Weiss law (MFC ∝ (T-TB)−1) behavior [54] reported previously for an ultra-small iron oxide NP system with a diameter of less than 3 nm and a dense frozen ferrofluid containing Fe55Co45 particles of 4.6 nm. The data show a small bifurcation between the ZFC and FC curves for An1200Fe AfFtn-AA (figure S6) between 50 K and 250 K, which indicates a deviation from superparamagnetic behavior, most likely caused by the presence of a FM component (i.e. the magnetite phase in the ferrihydrite NPs as discussed below). The observed values of TB are similar to previously reported values for ferritins which fall in the range of 5 K to 25 K [43, 46]. Apo-AfFtn-AA shows a deviation from the diamagnetic behavior down to 10 K. Despite the absence of additional Fe ions, trace amount of Apo-AfFtn-AA is present in the preparation. However, the trace amount is not expected to contribute to the observed deviation from diamagnetic behavior, indicating that the superparamagnetic behavior of these proteins is exclusively caused by the ferrihydrite NPs inside the ferritin core. From these observations, we conclude that the ferrihydrite NP inside one ferritin does not magnetically interact with the neighboring ferritins.
To characterize the magnetic properties of the SAMs of ferritin, we analyzed the magnetic behavior of A1200Fe AfFtn-AA SAM on template-stripped gold electrodes (AuTS) with magneto-optical Kerr effect (MOKE) and that of An1200Fe AfFtn-AA with SQUID (see Section 4 for details). Figure 2(C) shows the full hysteresis curves which were recorded with an in-plane magnetic field up to 1.50 T. The curves saturate around 0.89 T. These results suggest that the magnetic behavior of the ferritin particles remain unaltered when self-assembled on the surface. The in-plane magnetic hysteresis loop of the NiTS substrate measured with SQUID is also shown in figure 2(C), displaying a much sharper behavior with field, reaching room temperature magnetic saturation at H = 0.1 T. To determine the magnetic properties of the ferritin adsorbed on Au in more detail, we measured the ZFC/FC curves of An1200Fe AfFtn-AA monolayers (the A1200Fe AfFtn-AA monolayers gave too weak signals to be measured with this method). Figure 2(D) shows a similar blocking behavior with a departure between the ZFC and FC curves below 10 K. The increase of both ZFC and FC curve for higher temperatures, all the way into room temperature may indicate that the magnetic NPs may indeed be weakly interacting and depart from a pure superparamagnetic behavior. Gandhi et al [55] reported similar observations for weakly interacting Fe3O4 NPs and Cr2O3 nanorods, where the shape of the NPs resulted in large coercive fields. In our case, we could not observe the high coercive field from the magnetization measurements due to the minimal contribution of the FM core of the ferritin relative to those from the other diamagnetic contributions from the ferritin shell and substrate. We also tried to measure the magnetization hysteresis loop of the complete device as a function of the applied magnetic field, unfortunately, the measured total magnetization of the complete device is completely dominated by the Ni FM bottom electrode because the amount of magnetic ferritin core (weight) in the MTJs is much smaller than that of the 200 nm Ni FM bottom electrode. It is possible that this behavior results from some particles that have changed shape after deposition (distortion), inducing some hysteretic behavior. From prior study [13] we know that ferritins adsorbed on Au with loading of Fe1200 has only a height of 5.2 ± 0.2 nm determined from atomic force microscopy (AFM) which is considerably smaller than that expected for fully extended, spherical ferritins which have an outer diameter of 12 nm. Pen et al [56] reported that the there are multiple nucleation sites for the Fe ions inside the cavity resulting in small NPs of 1.8–2.7 nm in diameter, and Jian et al [57] reported that morphology of the NPs depend on the Fe ion loading inside the equine spleen ferritin. For very high Fe ion loadings, these small NPs can merge into larger NPs with diameters of 2–6 nm [50]. We used relatively low Fe ion loadings in this study, therefore it is reasonable to assume that in our case the ferritins consist of several small NPs distributed inside the cavity.
We performed x-ray absorption spectroscopy (XAS) of An1200Fe AfFtn-AA and A1200Fe AfFtn-AA SAMs on NiTS to characterize the structure of the ferrihydrite NPs in more detail. Figures 3(A) and (B) show that the XAS spectra are dominated by two peaks at 708.2 and 709.6 eV along with a shoulder within the L3 edge and three components within the L2 edge at 719.4, 721.2 and 722.8 eV. We focus our attention on the L3 region. The integrated intensity of each peak at the L3 edge was used to determine the Fe2+/Fe3+ ratio from which the composition of the ferrihydrite NPs inside the ferritin can be determined as described in [48] (see Section 4 for the details). This ratio is 0.59 for An1200Fe AfFtn-AA monolayers which indicates that the magnetite component dominates. In contrast, for A1200Fe AfFtn-AA monolayer, the ratio is 0.68 which indicates that there is a mixture of γ-Fe2O3 (maghemite) and Fe3O4 (magnetite) phases present in the ferrihydrite NPs in agreement with previous reports [58]. Thus, we conclude that the ferritin core formed under aerobic conditions forms a mixed iron oxide phase, whereas the ferritin core formed under anaerobic conditions is dominated by the magnetite phase which has better magnetic properties than maghemite in particular, magnetiocrystalline anisotropy and saturation magnetization. These observations are consistent with the observed 5.9 times higher magnetic moment per ferritin cage for An1200Fe AfFtn-AA than for A1200Fe AfFtn-AA (table 1).
To study the magnetic interaction between the NiTS and An1200Fe AfFtn-AA, we performed XMCD at room temperature on the monolayers on NiTS. We note that usually monolayers give weak signals and usually such measurements are performed in high magnetic fields (>10 T) and at low temperatures (<4 K), but we aimed to characterize the monolayers in close resemblance to the experimental conditions at which the junctions were electrically characterized (unfortunately, the observed XMCD signal at low magnetic fields (⩽1.5 T) at room temperature (300 K) is very weak so we could not obtain magnetic hysteresis loops from the XMCD characterization). Figures 3(C) and (D) show the XAS and XMCD spectra of Fe L2,3 and Ni L2,3 edges in the presence of a ±1.5 T field (the results obtained for A1200Fe AfFtn-AA on NiTS are given in figure S7). The observed XMCD signal indicates the presence of uncompensated iron spin [59, 60]. The sign of the XMCD signal for Fe L2,3 and Ni L2,3 are the same, implying that there is no substantial antiFM coupling between ferritin core and NiTS substrate. To further confirm the magnetic interaction between the NiTS surface and the monolayer of ferritins, we performed XMCD of the ferritin monolayer on NiTS surface without external magnetic field (0 T) at room temperature. Figure S8 shows a negative XMCD signal at 709.43 eV which indicates the presence of uncompensated spins of Fe3+ ion, moreover the sign of the XMCD signal is also similar to that of Ni L2,3 edge (figure S7). The XMCD signal for A1200Fe AfFtn-AA on NiTS was weaker than that of An1200Fe AfFtn-AA due to the lower magnetic moment as discussed above. We also carried out XMCD on An1200Fe ferritin adsorbed on a non-magnetic metal surface (AuTS) to further confirm there are no long-range magnetic interactions between the ferritin and FM surface. Indeed, figure S9 shows the same sign of the XMCD signal as that of ferritin on a Ni surface (figure S8). From these experiments, we conclude that the ferrihydrite NPs inside the ferritins are decoupled from the NiTS substrate by the protein shell and that they are spin-polarized (FM). These results confirm the observation mentioned earlier and that the superparamagnetic properties of the ferritin in powder form changes to FM behavior for ferritins adsorbed on the surface.
We studied the electrical characteristics of the NiTSlinker-ferritin//GaOx /EGaIn junctions with monolayers of apo-AfFtn-AA, A1200Fe AfFtn-AA, and An1200Fe AfFtn-AA. We used EGaIn stabilized in a through-hole in a microfluidic network in PDMS as the top-electrode and formed five to six junctions on four to five different samples of ferritin monolayers on NiTS. From each junction, 20 different current-density traces were recorded. All the data were analyzed as reported [11, 61] (see Section 4 for a brief description).
Figure 4(A) shows the Gaussian log-average J(V) (<lnJ > G) curves of all the junctions. We used the Z-test to calculate the 95% confidence intervals as reported before [61]. The observed J(V) behavior for A1200Fe AfFtn-AA and apo-AfFtn-AA is similar to that of the junction AuTS-linker-A1200Fe AfFtn-AA//GaOx /EGaIn and AuTS-linker-apo-AfFtn-AA//GaOx /EGaIn reported previously [13]. To clarify the possible charge transport mechanism across the junctions, we measured J(V) curves over the range of temperatures of 160 K–300 K. Figure 4(B) shows the Arrhenius plots and that only in junctions with apo-AfFtn-AA manifest a small thermally activated component with an activation energy Ea of 98 ± 4 meV, obtained from the fit to equation (2) (where kB is the Boltzmann constant and J0 is a pre-exponential factor) which indicates the charge transfer mechanism driven by a hopping mechanism:


Figure 4. (A) Plots of <ln|J|> G vs. V (error bars represent 95% confidence intervals) and (B) Arrhenius plot for a junction with A1200Fe AfFtn-AA, An1200Fe AfFtn-AA, and apo-AfFtn-AA. The solid red line is a fit to the Arrhenius equation (error bars represent the standard deviation obtained from three independent experiments) and shows that the mechanism of charge transport across junctions with apo-AfFtn-AA is thermally activated. (C) Percentage of change in the magnetoresistance (TMR) at −1.0 V for the MTJs with A1200Fe AfFtn-AA, An1200Fe AfFtn-AA, and apo-AfFtn-AA measured at T = 270 K. (D) Temperature-dependent percentage of TMR response of An1200Fe AfFtn-AA based MTJs.
Download figure:
Standard image High-resolution image
In contrast, junctions with A1200Fe AfFtn-AA and An1200Fe AfFtn-AA display electrical characteristics that are independent of the sample temperature. This temperature independence suggests prevailing 'long range' coherent tunneling mechanism across these junctions. Such type of activation-less long range charge transfer has been already observed in similar junctions but with Au electrodes [13], or for different types of biomolecular junctions [62] and organic thin film [63] based junctions.
We further measured the magnetoresistance (equation (1)) of the ferritin-based junctions as a function of magnetic field (±1.5 T) at constant bias of −1.0 V. Figure 4(C) shows the results obtained at T = 270 K (figures S10–12 show the results for another three junctions to demonstrate reproducibility), with a clear positive TMR effect of ∼10% for junctions with A1200Fe AfFtn-AA and ∼40% for junctions with An1200Fe AfFtn-AA at 270 K. The results are consistent with the higher magnetization of ∼2500 µB of An1200Fe AfFtn-AA than that of ∼418 μB of A1200Fe AfFtn-AA (table 1). In the junctions with apo-AfFtn-AA and only linker molecules, the resistance is independent of the applied magnetic field. Figure 4(D) shows the TMR response of An1200Fe AfFtn-AA junctions at three different temperatures. As a control, figure S13 shows the J(V) curves recorded from an An1200Fe AfFtn-AA junction with parallel and anti-parallel field orientations (±0.5 T).
To understand the effect of T and V on TMR response of the ferritin-based junctions, TMR of the junctions were measured as a function of T and V. Figure S9 shows bias dependent TMR for a junction with An1200Fe AfFtn-AA at 260 K. TMR increases with V for V > 0.5 V (at lower V values we did not observe TMR) following a power law dependency (see figure S14). This observation is in contrast with conventional MTJs, where the maximum TMR value is close to zero bias and decreases with increasing V because of the presence of defects [64]. Figure 4(D) shows that well-defined resistance states are observed in both forward and backward field sweeps, with TMR increasing with decreasing T, achieving a maximum value of 60 ± 5% at 200 K. The improvement of TMR with decreasing temperature likely stems from the increase of the electrode spin polarizations with lowering temperature [65, 66]. As previously remarked, achieving reliable room temperature operation of biomolecule-based MTJs is truly challenging owing to the difficulties to incorporate molecules inside MTJs without disturbance or suppression of their magnetic properties. Accordingly, the measured TMR performance close to room temperature is remarkably large considering the small size of the ferrihydrite NPs.
2.1. Proposed mechanisms for MR
Figure 1 depicts a well-known mechanism for MR, which requires that the ferritins have coercive fields close to 1 T. In this case, the change in resistance is induced by changing the orientation of the magnetization of the ferritins with respect to the NiTS. For low fields only the NiTS align with the field, while the magnetic moments in the ferritin remain antiparallel (high resistance state—figure 1(C)). This configuration is stable until a high enough field (H ∼ 0.8 T) also aligns the ferritin moments along the field (low resistance state—figure 1(B)). Notwithstanding, for such interpretation to be valid direct, evidence of enhanced anisotropy and elevated coercive fields at high temperatures is required for ferritin NPs which is not the case of ferritin in powder form (figure 2). This enhancement of anisotropy in the magnetic particles inside the ferritin and resulting coercive fields close to 1 Tesla could result from a structural distortion of the molecules trapped in the two-terminal junction, as reported in other nanoscale magnetic particles with highly asymmetric shapes [67, 68]. In addition, changes in the magnetic behavior induced by shape distortions of magnetic NPs have been also discussed in other contexts [69–71]. A plausible scenario is therefore that ferritins flatten upon adsorption on NiTS (see SI, figure S6) which would translate into a flattening of the ferrihydrite particles as well. The distortion of the ferritins is also likely enhanced owing to the pressure exerted by the EGaIn top electrode on the SAM, after the formation of the junctions.
However, large coercive fields (0.8 T) at 200 K would be necessary to explain the observed TMR, representing a large stretch for ferritin particles, as it requires extreme deformation of ferrihydrite NPs. The corresponding very large associated pressures should likely result in catastrophic junction failure (i.e. a short), impeding the observation of specific junction response. Unfortunately, our available magnetometry and magneto-optical techniques do not allow to magnetically characterize the magnetic particles from the microscopic areas where the tunnel junctions were formed.
We here propose an alternative explanation of our experimental findings, which could explain both the large measured TMR signals together with the long-range transport observed in Ni-based junctions, and could be also applied to prior reports in Au-based ferritin junctions [13]. As discussed above, the thermally activated tunneling observed in apoferritin can be reasonably understood as an incoherent hopping mechanism through the ferritin which, driven by pressure, has collapsed into the surface losing its spherical shape. Such structural transformation into a 'flattened omelet' of 4–5 nm in thickness provides new pathways for electrons to more easily tunnel in between electrodes. Obviously, in the absence of magnetic NPs no TMR is expected even when electrons are magnetically polarized by the Ni film. However, the magnetic particles in An1200Fe and A1200Fe AfFtn-AA ferritins prevent this collapsing (at least in part). As a result, the electrons do not encounter straightforward hopping pathways through the protein shell, finding instead tunnel pathways through the insulating ferrihydrite NPs inside the cavity of ferritin. This together with the substantially larger size (up to 10 nm) of integral ferritins loaded with Fe should result in negligible current thought the junction, in contrast to our measurements. The current for An1200Fe and A1200Fe AfFtn-AA is lower than for the apoferritin but still considerably high (figure 4(A)). Therefore, one possible tunneling mechanism across these junctions could be assisted by the excitation of magnonic states of the magnetic NPs. Such type of magnon-mediated inelastic transport mechanism has been proposed early on [72] and observed in spin-valve-type tunnel junctions [73]. Magnons are becoming more and more relevant in the context of nanoscale two-dimensional magnetic structures [74], and were recently proposed to mediate spin signal in MTJ built form ultrathin two-dimensional magnetic insulators, although yielding very moderate TMR below 1% for the measured devices [75].
The scenario of magnon-mediated long-range tunneling would be consistent with the absence of temperature dependence (figure 4(B)) of the tunnel currents and the TMR response of the junctions. In this scenario, conduction electrons polarized by the Ni film along the direction of the applied field will encounter one or more available magnetic states promoting the spin information transfer across the junction. The excitation and propagation of magnons in a magnetic NP should be sensitive to the relative orientation between the polarization of the incoming electrons and the direction of the anisotropy axis (even at temperatures substantially larger than the anisotropic blocking temperature of the particles). Consequently, incoming electrons will excite magnons in the particle closest to the source electrode, whose anisotropy axis is aligned with the field and the polarization of the electron, but then encounter a second particle whose anisotropy axis is oriented in a different direction, and for which excitation and propagation of magnons is less effective. This would lead to a high resistance state, which would remain until a strong enough magnetic field favors the activation of magnons in a subsequent particle. Measuring a TMR signal, however, supposes that the exit side of the tunnel junction is also spin-sensitive, which we assume to be related to spin–orbit coupling effects internal to EGaIn, which will respond differently to incoming spin transfer. As seen from the magnetometry measurements presented in figure 2(C), magnetic saturation is achieved at fields in the vicinity of 1.0 T, above which the magnetizations of all particles are aligned along the applied field, favoring the proposed magnon-assisted transport through the ferritin-based junction, and decreasing the TMR value. In addition, as transport through SAM-based molecular junctions is usually governed by only a few dozens of molecules in EGaIn junctions [76], it is likely that in the case of ferritin (a large molecule) this reduces to just a few (maybe only one) molecules, which would explain the stochastic nature of the results obtained in this study (for examples, see figure S11 for A1200Fe AfFtn-AA, and figures S10 and S12 for An1200Fe AfFtn-AA). Moreover, the formation of magnons would be strongly related to the amount of magnetically polarized tunneling electrons, which would increase with the applied bias potential, explaining the observed power law dependence of the TMR as a function of applied bias (see figure S14).
3. Conclusion
We have demonstrated that the TMR characteristics of magnetic tunneling junctions based on ferritins are induced by the magnetic iron oxide core inside the ferritin. The 2 nm thick protein cage: (a) serves as a tunneling barrier, (b) magnetically decouples the iron oxide core from the NiTS bottom-electrode, and (c) provides stability. These properties of ferritin allowed us to fabricate a highly efficient biomolecular TMR device with a relatively simple structure with only one FM electrode. The TMR was 60 ± 10% at 200 K and 25 ± 5% at room temperature. The TMR depends on how the magnetic core of ferritin was prepared. The magnetic moment µB per ferritin of the core was 5.9 times (table 1) higher for ferritin loaded with iron oxide under anaerobic than aerobic conditions resulting in a factor of four increase of the TMR. The mechanism of charge transport across iron oxide loaded ferritin junction studied here is independent of the temperature, which suggests that a long-range tunneling mechanism of charge transport predominates. To explain the observed TMR involving large coercive fields present in the junctions, but absent in apo ferritin, we propose that 'long-range tunneling' is assisted by magnon excitations of ferritins. Our findings showcase that ferritins form a highly interesting class of biomolecules for fundamental studies of new tunneling phenomena. They not only link long-range tunneling and spin dependent transport at the molecular level [77] but also enable large TMR performances and room-temperature operation of spintronic devices, important requirements for practical applications. Currently, we are investigating the mechanism of spin dependent transport and role of magnons in more detail.
4. Experimental section
4.1. Materials
We purchased nickel (Ni) and silicon wafers (100, p-type, 500 ± 25 μm) with one side polished from super conductor materials, Inc. (USA) and University Wafers (USA), respectively. The 1 H, 1 H, 2 H, 2 H-perfluorooctyltrichlorosilane (FOTS), 6-merhaptohexanoic acid (MPA), PDMS, and 1-ethyl-3-(−3-dimethyl aminopropyl)carbodiimide hydrochloride (EDC) were purchased from Signa-Aldrich with a purity of 98%. The EGaIn 75.5% Ga and 24.5% In by weight was purchased from Sigma-Aldrich. The solvents were AR grade.
4.2. Template-stripped nickel (NiTS)
We used a previously reported method [4] to prepare the ultra-smooth NiTS substrates (figure S1). Briefly, the silicon substrate (figure S1(A)) was treated with 1 H, 1 H, 2 H, 2 H-FOTS for 30 min at 1.0 mbar in vacuum desiccators (figure S1(B)). We evaporated 150 nm of Ni at a rate of 0.78 Å s−1 by using an ultra-high vacuum sputtering on FOTS functionalized substrate (figure S1(C)). The Si/FOTS/Ni samples were glued (figure S1(D)) on glass substrates from the metal film side and the thermal adhesive was cured for 1 h at 80 °C. In order to prevent nickel oxidation, template stripping was carried out in a N2 flow hood (figure S1(E)).
4.3. Ferritin monolayer on NiTS
The SAM of ferritins on NiTS was prepared with a similar method as reported before for ferritin self-assembly on AuTS [13]. First, the NiTS substrate was immersed in a 3 mM solution of MPA in ethanol overnight under N2 (figure S1(F)) and then the sample was washed with ethanol and dried in a stream of dry N2. Then, it was immersed in EDC (50 mg ml−1) solution for 1 h to activate the carboxylic acid groups. The activated sample was then immersed in a ferritin (An1200Fe AfFtn-AA, and A1200Fe AfFtn-AA or apo-AfFtn-AA) (1.0 mg ml−1) solution overnight. Finally, the sample was rinsed with water and blown to dryness with N2 gas.
4.4. Device fabrication
We fabricated the top-electrodes using a standard two-step photolithography process as previously reported [11]. First, we fabricated the mold for a vacuum channel (10 μm × 10 μm × 1 cm) connected to a pillar (with a height of 60 μm and a diameter of 50 μm) using photolithography with negative photoresist SU-8 2010 and SU-8 3050. The mold was treated with FOTS to reduce the interaction with the PDMS, and spin coated a 20 μm layer of PDMS (Sylgard 184, Dow Corning) onto the mold to cover only the line but not the pillar. The PDMS for the EGaIn injection channel was prepared with a dimension of 1.0 cm × 150 µm × 150 µm separately by standard methods and it was aligned over the pillar. After the alignment, we increased the layer thickness of the thin layer of PDMS. We used a standard curing procedure (45 min at 80 °C) and then the PDMS with the through-hole connected to two channels was peeled off from the mold and placed on an ITO substrate to inject the EGaIn into the injection channel and to fill the through-hole by applying vacuum to the vacuum channel as detailed in [11]. We measured the resistance between ITO and EGaIn to confirm complete filling of the through-hole. Finally, the top-electrode was removed from the ITO support and placed onto the SAMs gently to form the junction (figure S1(H)).
4.5. Ferritin production and purification
Expression and purifications of A. fulgidus ferritin-AA (AfFtn-AA) were performed as described elsewhere [39, 49]. The production was carried out in Escherichia coli BL21(DE3)C + RIL cells (Stratagene, Santa Clara, CA). The purified protein was stored in HEPES buffer (25 mM HEPES, 50 mM NaCl, pH 8) at 4 °C.
4.6. Iron loading in ferritin
Iron (Fe) loading in ferritin was performed by maintaining anaerobic [49] (An1200Fe AfFtn-AA) and aerobic [39] (A1200Fe AfFtn-AA) conditions. A solution containing dimeric apo-AfFtn-AA (0.25 mg ml−1 in 25 mM HEPES, 50 mM NaCl, pH 8) was placed in an Erlenmeyer flask and N2 gas was flushed for 30 min. Ferrous sulfate solution in 0.1% HCl was freshly prepared and 50 Fe atoms/minute was added to the sealed flask with simultaneous addition of equimolar H2O2 with continuous stirring at 65 °C. Samples were incubated overnight at 4 °C post loading. Amicon centrifugal filters (100 kDa MWCO; Millipore, Billerica, MA) were used to remove the unbound iron by buffer exchange with 25 mM HEPES, 50 mM NaCl, pH 7.5. Fe quantification was performed using inductively coupled plasma atomic emission spectroscopy and protein quantification using Bradford.
4.7. Freeze dried ferritin
Protein samples (2 mg ml−1) were aliquoted in 2 ml tubes and dipped in liquid nitrogen for 5 min which were then lyophilized for 24 h. Freeze-dried An1200Fe AfFtn-AA, A1200Fe AfFtn-AA, and apo-AfFtn-AA powder thus obtained were used for SQUID measurements. Actual iron content in 1.0 g of freeze-dried powder was 0.012 g of iron and 1.0 g of freeze-dried powder contained ∼2.01 × 10¹⁶ ferritin molecules which were used to estimate the magnetic moment per ferritin.
4.8. Superconducting quantum interference device (SQUID)
The magnetic characterization of the freeze-dried ferritin powders and nickel thin films were performed using a SQUID magnetometer (Quantum Design). No magnetic signal was found for the sample holder after careful cleaning. 20–30 mg of ferritin powder and 150 nm nickel on silicon substrate with a size of 4 mm × 4 mm were used to measure the magnetic signal at the level of 10−5 emu g−1, which is well above the instrumental sensitivity of 10−8 emu g−1. The temperature dependent magnetizations were recorded in an applied field, Happ = 1000 Oe, after ZFC or FC from 300 K to 2 K. By the FC mode, the cooling field is set as HCOOL = 20 kOe. For all the three samples, the two branches of FC and ZFC curves separate from each other with the temperature going up to 300 K. We also measured detailed magnetic characterization for the SAM of An1200Fe AfFtn-AA on Au surface, since its shows detectable amount of the signal in SQUID technique. We used MOKE technique to characterize the monolayer of A1200Fe AfFtn-AA samples because of that did not show detectable amount of signal in the SQUID. The obtained magnetization signal corrected with actual iron content in the 1.0 g of freeze-dried powder.
4.9. MOKE measurements
The MOKE of 1200Fe AfFtn-AA/linker/AuTS substrate in longitudinal geometry was measured with a homemade MOKE setup [78]. Polarization rotation of the incident beam was measured to record magnetization of the material as a function of the external magnetic field (hysteresis loop). The data presented here were measured with light with a wavelength of 633 nm, a power of 3 mW, and time per loop of 100 s. This method provides high sensitivity to Kerr rotation (∼1.0 microradian) and is not sensitive to ellipticity.
4.10. X-ray photoelectron spectroscopy (XPS)
The surface chemical composition of the A1200Fe AfFtn AA biomolecule chemisorbed on NiTS substrate was characterized by XPS. The spectra were measured using VG ESCA lab-220i XL XPS. The system was equipped with a monochromatic Al Kα x-ray source with a photon energy of 1486.6 eV at 15 kV. The composition of the samples was determined from 0 to 1000 eV using survey scans acquired at an analyzer pass energy of 150 eV. The high-resolution spectra were collected at pass energy of 20 eV, with 0.1 eV steps, at a 45° takeoff angle. The binding energies were corrected against the C 1s energy of 285.0 eV. The collected XPS high-resolution spectra were analyzed using XPS Peak fit 4.1 software using Voight functions. The background from each spectrum was subtracted using Shirley-type backgrounds to remove most of the extrinsic loss structure.
4.11. X-ray absorption spectroscopy (XAS)
The Fe L-edge XAS measurements were performed at the soft x-ray beamline of Australian Synchrotron in total electron yield mode following previously reported procedures [2]. The step size of 0.1 eV was used over the energy range of 700–730 eV. We used the Quick AS NEXAFS Tool (QANT) provided by the beamline to normalize the spectra to the incident photon flux. To extract a relative quantification of the oxidation state of iron in the ferritin samples we have used the linear combination of simulated Fe2+ and Fe3+ spectra using the CTM4XAS software [42] and followed previously reported procedure [58]. A linear combination of the simulated spectra of only three species, Fe2+ (Oh), Fe3+ (Td), and Fe3+ (Oh), were used to obtain a consistent fit to the raw data as reported before [58]. The integrated intensity of each component is used to estimate the Fe2+/Fe3+ ratio.
4.12. X-ray magnetic circular dichroism (XMCD)
The XMCD measurements were high-resolution by recording the sample current as a function of the photon energy and polarization of the synchrotron light at the SINS beamline of the Singapore Synchrotron Light Source (SSLS). We used the elliptically polarized light with left (P+) circular polarization, and the degree of the polarization was about 0.9. A saturation magnetic field (M = ± 1.5 T) applied parallel to the sample surfaces was used to magnetize the sample before the XMCD measurements. The incident light was perpendicular to the sample surfaces. A liquid N2 tank with a pumping system was connected to the measurement chamber to cool down the sample holder to 77.5 K. We normalized the Ni L edge spectra at ∼847 and ∼877 eV and the Fe L edge spectra at ∼703 and ∼728 eV.
4.13. Atomic force microscopy (AFM)
The AFM images were obtained by Bruker dimension Fastscan AFM with tapping mode tips (FASTSCAN-A, resonant frequency: 1.4 MHz, force constant: 18 N m−1). We used a nanoscope analysis (version 1.4) software to analyze the AFM images.
4.14. Data collection of DC measurements
We followed previously reported procedures for the data collection and analysis of the J(V) curves [11]. We formed junctions on four to five different samples and determined the J(V) characteristics of five to six junctions on each sample. For each junction, first five scans were recorded to stabilize the junction and then 20 traces were recorded. All data were used for data analysis. We defined a short when the value of J exceeded 102 A cm−2 (the compliance value of J of our instrument) during the scanning (including the first five scans). We followed the procedure for statistical analysis of the junction data as reported before [12].
4.15. Temperature-dependent measurements
Measurements of J(V) as a function of temperature T(K) were carried out in a probe station (Lakeshore CRX-VF) at a pressure of 1.0 × 10⁻⁵ bar. The change of pressure from ambient to vacuum and solidification of the bulk EGaIn at T = 220 K–240 K did not result in shorts, open circuits, or changed the electrical characteristics of the devices notably in any other way. In the case of apo-AfFtn-AA samples, the junctions shorted at below 240 K.
4.16. Magnetic field dependent measurements
We measured I(V) at −1.0 V as a function of magnetic field (± 1.5 T) in a probe station (Lakeshore CRX-VF). The device was placed in a homemade sample holder so that the magnetic field parallel to the junction could be applied. The field was swept between ±1.5 T at the rate of 0.01 T s−1 by using superconducting magnet (Lakeshore model-625). A code written in LabView 2010 was used to operate the source meter and superconducting magnet power supply. We calculated the percentage of magnetoresistance (described in main text equation (1)) by an observed change in the current at −1.0 V as a function of the magnetic field. The devices shorted at a temperature lower than 200 K likely due to the differences in the thermal expansion coefficients of the different components in the devices.
Data availability statement
The data generated and/or analyzed during the current study are not publicly available for legal/ethical reasons but are available from the corresponding author on reasonable request.
Acknowledgments
We acknowledge the Ministry of Education (MOE) for supporting this research under award No. MOE2019-T2-1-137. Prime Minister's Office, Singapore under its Medium sized center program is also acknowledged for supporting this research. We kindly acknowledge the Singapore Synchrotron Light Source (SSLS) supporting our experiments at the SINS beam line under NUS core support C-380-003-003-001. We would like to acknowledge beamline scientists Dr Bruce Cowie and Dr Anton Tadich (soft x-ray (SXR) Beamline at the Australian Synchrotron) for their immense support. E d B acknowledges support from the US National Science Foundation (Grant No.: ECCS#1916874). S R acknowledges funding from CA2DM-NUS during his stay in Singapore. ICN2 is funded by the CERCA programme/generalitat de Catalunya, and the Severo Ochoa program from Spanish MINECO (Grant No. SEV-2017-0706).