

Abstract
The Ten Kongdui watershed is an essential part of the upper Yellow River baisn of China. The ecosystem in this region has low stability and hazards of sandstorm and soil erosion are serious. By studying the spatio-temporal changes and spatial correlation between vegetation cover and soil conservation, the inhibition effect of vegetation on soil erosion in time and space can be clarified, and the driving factors of soil erosion in a certain area can be further explained. The research results provide data support for artificial vegetation construction and soil erosion control in the Yellow River basin in the future. In this study, the invest model was used to calculate the soil retention of the watershed, and then the spatial autocorrelation analysis was used to analyze the vegetation coverage and soil retention in space. The relationship between changes of the vegetation coverage and soil conservation during 2000–2020 in the Ten Kongdui watershed is analyzed in this paper. The research shows that: (1) During the research period, the vegetation coverage maintained an increasing trend in Ten Kongdui watershed; (2) From 2000 to 2020, with the increased vegetation coverage, soil retention increased, indicating that increasing vegetation coverage can effectively prevent soil erosion; and (3) Vegetation coverage and soil conservation presented a local spatial auto-correlation, Moran's I index was less than 0, but the years from 2000 to 2020 witnessed gradual growth of the correlation coefficient. There are significant differences in spatial distribution. 'High-high' and 'low-low' are sporadically distributed in the sandstorm area on the middle reaches of Kubuqi and sporadically in the hilly and gully areas on the upper reaches. Moreover, 'high-low' and 'low-high' correlation coefficients were distributed in gully areas on the upper reaches and alluvial plains on the lower reaches. The alluvial plains on the lower reaches are mainly farmland ecosystems, with a high NDVI in the growing season but poor soil erosion resistance and weak soil conservation ability. The results emphasized the importance of vegetation coverage change in space for soil conservation of different type of underlying surfaces. The vegetation coverage change effects of soil conservation in plain terrain will be muted. This work provided a certain theory and criterion for us to further research the predictive model of soil erosion .
Export citation and abstract BibTeX RIS

Original content from this work may be used under the terms of the Creative Commons Attribution 4.0 licence. Any further distribution of this work must maintain attribution to the author(s) and the title of the work, journal citation and DOI.
1. Introduction
Vegetation is an important hub of material circulation, energy flow, and information transmission in terrestrial ecosystems [1]. In semi-arid areas, the change in vegetation coverage serves as a key factor to evaluate and monitor the changes in ecosystems and ecological environments [2]. NDVI is an important evaluation index that reflects vegetation coverage [3], and large-scale vegetation growth and aboveground biomass can be quickly investigated using remote sensing technology [4]. In addition, NDVI is often applied to research on vegetation dynamics, ecosystem service functions, land use change analysis, and social and economic benefits [5]. Most studies of vegetation dynamics have focused on seasonal or annual changes. Regional vegetation changes have been analyzed by combining the trend analysis method [6] and pixel dichotomy [7] based on annual or monthly NDVI data [8, 9], Using principal component analysis [10], geographic detector[11] and other driving factor analysis methods to study NDVI change in the study area. Some scholars have probed the special effects of NDVI on ecosystem services and investigated the correlation between NDVI and ecosystem services by integrating NDVI with water yield [12], habitat quality [13], NPP [14], and ecosystem service function [15, 16]. For instance, Ephias et al studied the correlation between NDVI and ecosystem service functions by considering the Bobirwa Sub-District as the study area [17]. NDVI index is often used in the prediction of soil erosion and soil conservation , which has enabled scientific evaluation of the ecosystem's ability to alleviate regional soil erosion and maintain ecological security. Related research mainly focuses on the correlation between NDVI and soil erosion intensity [18, 19], response of soil erosion to vegetation cover change [20, 21], response of soil erosion and sediment transport to landscape pattern change [22].
The Ten Kongdui watershed is an important branch of Yellow River. It is located northwest of the Yellow River basin in China's Inner Mongolia, The upper reaches are hilly and gully areas with fragmented surfaces, sparse vegetation, and serious soil erosion. The middle reaches are the Kubuqi Desert, where wind-blown sand enters the Yellow River. The lower reaches are agricultural areas in alluvial plains with good river scouring and silting. The ecosystem stability in this region is low, with poor resistance to disturbance and the soil erosion is serious. In the last 20 years, with the government departments of China attach great importance to the governance of the ten major areas, As well as the continuous advancement of ecological projects, the environment in the Ten Kongdui watershed has been effectively get better [23, 24]. According to the Soil and Water Conservation Bulletin of China, the vegetation coverage in this area has increased year by year, and the trend of soil erosion has been effectively controlled [25]. Most of the previous studies on the spatial-temporal evolution in vegetation and soil erosion, but ignored the potential effects of spatial heterogeneity of vegetation pattern on soil conservation [26, 27]. In this context, by studying the spatio-temporal changes of vegetation cover and soil conservation and their spatial correlation, the inhibition effect of vegetation on soil erosion in time and space can be clarified, and the driving factors of soil erosion in a certain area can be further explained. First this research analyzed temporal change characteristics of NDVI by trend analysis, and then the invest model was used to calculate the soil retention of the watershed. Finally ,the spatial autocorrelation analysis was used to analyze relationship between vegetation coverage and soil retention in space. The research results can provide theoretical and practical guidance for future vegetation construction and soil erosion control, and provide important basis for ecosystem protection and ecological civilization construction.
2. Overview of the study area and data sources
2.1. Overview of the study area
Ten Kongdui watershed, which originates in the northern margin of the Ordos Plateau, located on the Inner Mongolia section of the Yellow River, crosses the Kubuqi Desert, and flows into 10 seasonal rivers of the Yellow River after passing through the downstream alluvial plain. The flow of the Ten Kongdui watershed is directly discharged into the Yellow River-Ningmeng section, which is the main sediment source of the Inner Mongolia section of the Yellow River. The main river channels of each basin are arranged in parallel, involving four banners ( districts ) of Ordos City (figure 1). The basin area of the 10 rivers varies from 213 to 1261 km2, with total basin area10767 km2.

Figure 1. Geographical location maps of Ten Kongdui watershed.
Download figure:
Standard image High-resolution imageThe precipitation in the study area, which was small, was unevenly distributed in time and space, accompanied by very strong evaporation. The average rainfall from the eastern part of the basin is 350 mm, and the western part is 200 mm Precipitation varies greatly from year to year, and precipitation is concentrated from July to September. Owing to the low precipitation and dry climate, windy and sandstorms often occur. Windy weather is generally concentrated between March and May. The annual average number of windy days is 24, and the wind speed reaches 17 m s−1, which can last for up to 3 days. The instantaneous maximum wind speed could reach 28 m s−1, which is equivalent to a 10-level gale. The hilly and gully areas in the upper reaches of the ten tributary areas are dominated by loess and chestnut soil, while the middle reaches are dominated by flowing and fixed semi-fixed sandy soil, and irrigated and silted soil, saline soil, alkaline earth, and meadow soil are dominant in the alluvial plain areas of the lower reaches. Vegetation types gradually transitioned from typical grassland in the southeast to desert grassland and grassland desert in the northwest. The dominant vegetation species in the area are xerophytic and semi-xerophytic shrubs, and grassland vegetation.
2.2. Data sources
The data sources involved in the full text are visible from table 1.
Table 1. Data sources.
| Data type | Source | Bar/line No. | Time | Resolution | Preprocessing |
|---|---|---|---|---|---|
| DEM topographic data | Geospatial Data Cloud (http://www.gscloud.cn/) | 108,39/108,40 | 2000 | 30 × 30 m | Clipping and mosaic |
| 109,39/109,40/ | 2010 | ||||
| 110,40/110,39/ | 2020 | ||||
| Remote sensing image data | Landsat images downloaded from Google Earth Engine | 127,32/128,32 | 30 × 30 m | Radiometric calibration, atmospheric correction, and image mosaic and clipping | |
| Soil type data | Soil dataset of Harmonized World Soil Database (HWSD) | 1:100000 | Resampled into a spatial resolution of 30 m | ||
| Meteorological data | National Earth System Science Data Center (http://www.geodata.cn) | 1 × 1 km | Resampled into a spatial resolution of 30 m | ||
| NDVI data | MODI3Q1 products provided by National Aeronautics and Space Administration (NASA) (http://lpdaac.usgs.gov) | 250 × 250 m | Resampled into a spatial resolution of 30 m | ||
| High-definition video | Google Earth | 2 × 2 m |
3. Research method and data processing
3.1. Research methods
3.1.1. Trend analysis and inspection
Theil-Sen Median trend analysis and Mann-Kendall test were combined to judge the trend of long sequence data[28]. Computing formula:
where NDVIi is the NDVI value of year i and NDVIj represents the NDVI value of year j. When SNDVI > 0, NDVI presents the increasing , and SNDVI<0 indicates declining in NDVI.
Mann-Kendall used to determine the significance of trends [29], expressed by the following formula:
 is set
The statistic S is calculated and tested:
The sign function sgn is expressed as below:
Where NDVIi and NDVIj represent the NDVI values of the pixel in years i and j, respectively, n denotes the length of the time series, Sgn is a sign function, and the range of the statistic Z is (−∞,+∞). In this study, the significance of the NDVI time-series variation trend at a confidence level of 0.05.
3.1.2. InVET model
Soil conservation was calculated using the SDR module in the InVEST model following the principle of the soil loss equation (USLE),USLE modle was calculated as follows:


Where SEDRETx and SEDRx are the soil conservation (t) and sediment retention (t) of grid X, respectively; USLEx is the actual soil erosion of grid x (t); SEx is the sediment retention efficiency; Rx is the rainfall erosivity factor (MJ·mm (ha· h)−1); Kx is the soil erosivity factor (ton ha HR (mj ha mm)−1); LSx denotes the slope length and gradient factor; Px is the engineering measure factor; and Cx is the vegetation coverage and management factor.
3.1.3. Input data for invest model
(1) Rainfall erosivity factor R
This is a comprehensive factor that reflects precipitation, precipitation intensity, and precipitation distribution characteristics. The R factor of rainfall erosivity is calculated by Wischmeier monthly scale formula [30] as follows:
Where R represents the annual rainfall erosivity, Pi represents the monthly average precipitation, and P represents the annual average precipitation. The unit (MJ mm (hm2 h)−1.
(2) Soil visibility K
According to existing data and research, the EPIC model calculation formula proposed by Williams [31], as follows:


where K is the soil erodibility factor, t × hm2 × h/hm2 × MJ × mm; SAN is the sand content (2–0.02 mm) in the soil, %; SIL is the silt content (0.02–0.002 mm) in soil, %; SLA is the clay content (< 0.002 mm) in soil, %; and SOC is the organic carbon content in the soil (%).
(3) Landform factor and the value of vegetation coverage factor C
LS were automatically generated by the InVEST model using the DEM elevation data.
C was 0–1, which was used to characterize the relationship between crop and vegetation management measures and soil loss. The value from low to high represents the vegetation coverage from low to high; that is, the degree of soil loss is from slight to serious.
VF represents vegetation coverage. The NDVI values with NDVI cumulative probability of 5% and 90% are counted as NDVImin and NDVImax, and the C value is calculated by using the grid computing function.

(4) The P value of soil and water conservation measures
The P value is the soil and water conservation factor in the USLE model, which is related to land use type, vegetation coverage and whether there are soil and water conservation measures. The P value is between 0 and 1, and the closer the P value is to 0, the less prone it is to soil and water loss, such as forest land and grassland. The closer it is to 1, the more prone it is to soil erosion, such as bare land. This value usually requires long-term standard runoff monitoring data to calculate the empirical constant, this paper refers to the previous research results in the study area to determine P value of each land type [cultivated land (0.40), forest land (0.2), grassland (0.7), water area (0), and bare land (1)] [32].
3.2. Spatial autocorrelation analysis
Spatial autocorrelation refers to the degree of correlation between the element value at a certain position and those at adjacent positions. The analysis of variables can be divided into univariate spatial autocorrelation and bivariate spatial autocorrelation [33].
- (1)The univariate spatial autocorrelation in this paper is represented by the Global Moran 's I index., and the value range is [−1,1]. More than zero is the spatial positive correlation, and less than zero is the spatial negative correlation. The Moran scatter plot generated by global spatial autocorrelation analysis can be divided into four quadrants, which represent four spatial relationships: spatial clustering with similar values of quadrants I and III, where quadrant I is the 'high-high' type and quadrant III is the 'low-low' type; spatial relationships with different values of quadrants II and IV, where quadrant II is the 'low-high' type and quadrant IV is the 'high-low' type. Univariate local spatial autocorrelation refers to exploring spatial correlation characteristics at the local scale and analyzing the results to generate the LISA cluster map. Five spatial distribution types were included, where 'high-high' means the high-value cluster zone, 'low-low' denotes the low-value cluster zone, 'low-high' represents that low values are encircled by high values, 'high-low' reflects that high values are encircled by low values, and 'insignificance' stands for zones not passing the P = 0.05 significance test.
- (2)Bivariate spatial autocorrelation is an extension of univariate Moran's I in the spatial statistical method that can reveal the spatial correlation and dependence characteristics between two geographical elements [34].
4. Results
4.1. Temporal and spatial distribution characteristics of NDVI
Figures 2(a) and (b) show the spatial distribution of land use in the ten major Kongdui basins. Cultivated land is mainly distributed in the lower reaches, unused land is mainly distributed in the middle reaches of deserts, and woodland and grassland are distributed in the upper reaches. In the past 20 years, grassland and unused land have been decreasing, while forest land and construction land have been increasing.

Figure 2. Land use distribution of the Ten Kongdui watershed in 2000 and 2020.
Download figure:
Standard image High-resolution imageThe average spatial distribution map of NDVI over 21 years was acquired based on average annual NDVI data from 2000 to 2020 (figures 3(c) and 2(d)). It could be seen that the hilly and gully areas on the upper reaches were mainly grasslands, and the NDVI value was 0.2–0.4. The vegetation coverage of the Kubuqi Desert is the lowest. Due to desert control, the vegetation in the eastern area increased, and the median area (0.4–0.6) of a certain area was distributed. The vegetation coverage in the downstream alluvial plain area dominated by cultivated land is higher, and the NDVI value was mainly 0.6–0.8. As shown in Interannual Variation Trend Chart, The average NDVI value in the lower reaches of the Ten Kongdui watershed is the highest. Before 2015, the NDVI value in the upper reaches was slightly higher than that in the middle reaches; after 2015, the NDVI value in the middle reaches was slightly higher than that in the lower reaches.

Figure 3. Spatial distribution and interannual variation map of NDVI in Ten Kongdui watershed. (a) Spatial distribution map of NDVI in Ten Kongdui watershed; (b) Interannual variation trend diagram of NDVI in Ten Kongdui watershed.
Download figure:
Standard image High-resolution imageThere was almost no single area with SNDVI = 0; therefore, it can be seen from figure 4, the variation trend of NDVI was divided into stable unchanged (−0.0005 < SNDVI < 0.0005), improved (SNDVI > 0.0005, 0 < Z ≤ 1.96), obviously improved (SNDVI > 0.0005, Z > 1.96), degraded (SNDVI < −0.0005, −1.96 ≤ Z < 0), and obviously degraded (SNDVI < −0.0005, Z < −1.96). As shown in the table (table 2) that the area of vegetation coverage increased from 2000 to 2020 accounted for 84.26% of the total area, 14.25% of the total area remained stable without significant changes, and areas with degraded vegetation accounted for less than 2%.
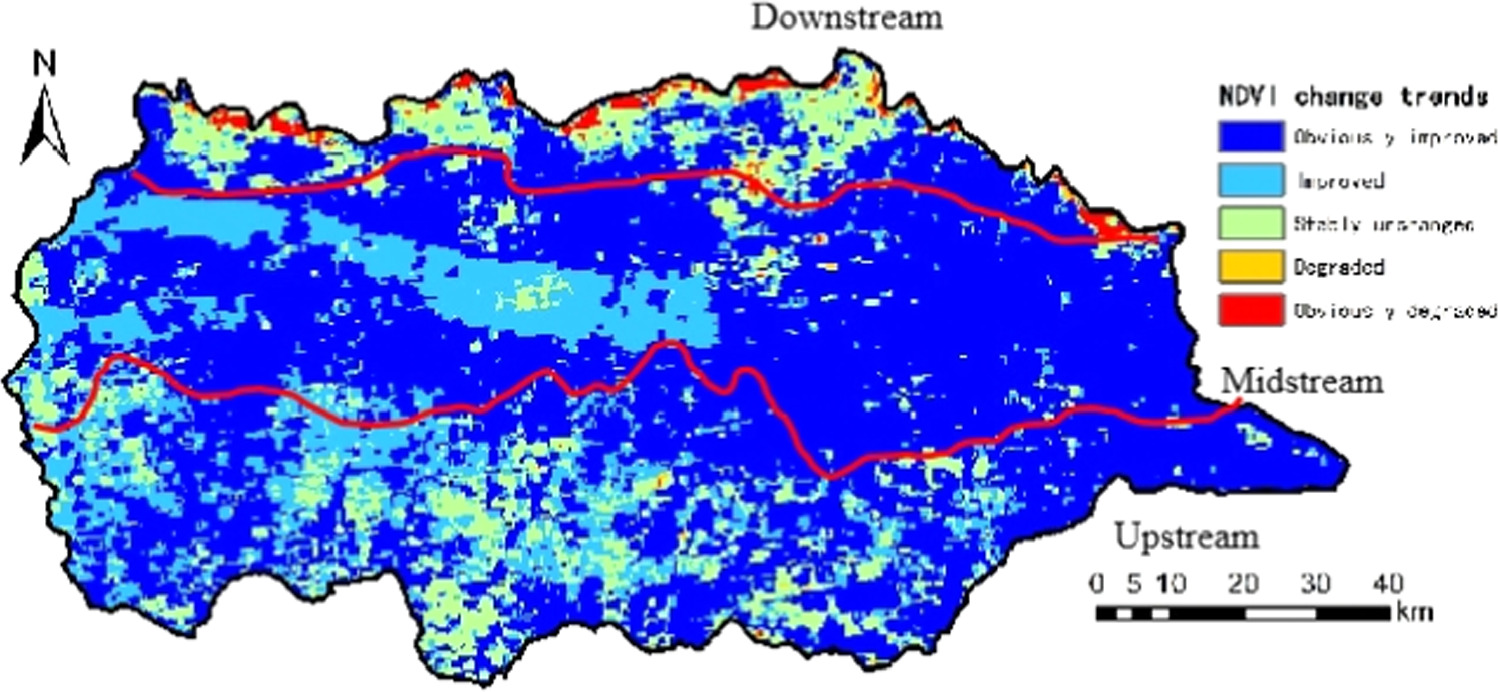
Figure 4. Spatial distribution of NDVI change trends in Ten Kongdui watershed.
Download figure:
Standard image High-resolution imageTable 2. NDVI variation trends in Ten Kongdui watershed.
| SNDVI | Z value | NDVI trend change | Area ratio/% |
|---|---|---|---|
| ≥0.0005 | ≥1.96 | Obviously improved | 64.19 |
| ≥0.0005 | −1.96–1.96 | Improved | 20.07 |
| −0.0005–0.0005 | −1.96–1.96 | Stably unchanged | 14.25 |
| <−0.0005 | −1.96–1.96 | Degraded | 0.42 |
| <−0.0005 | <−1.96 | Obviously degraded | 1.07 |
To better analyze the time-dependent variation characteristics of NDVI in Ten Kongdui watershed, the annual average NDVI from 2000 to 2020 was taken to represent the NDVI situation of that year, and an annual change chart of NDVI was drawn (figure 3(b)). It can be seen that the average NDVI in Ten Kongdui watershed fluctuated within 0.25–0.5 from 2000 2020, during which the NDVI presented an overall progressive increasing trend at a growth rate of 0.0069/10a. The growth rate of NDVI reached 73.25% from 2000 to 2020, which was mainly attributed to the implementation of ecological engineering. The area of forestlands and grasslands in the Ten Kongdui watershed continued to grow. In addition, vegetation coverage gradually improved owing to the strengthened governance of windy and sandy areas in the middle reaches.
4.2. Soil retention status and spatial and temporal distribution characteristics
2000–2020 witnessed the evident change in the total soil conservation in the Ten Kongdui watershed (figures 5(a) and (b)). From 2000 to 2020, the spatial distribution of the soil conservation intensity in Ten Kongdui watershed showed consistent spatial distribution and an escalating trend, where the soil conservation strength in 2000 was 6670t/(hm2 ·a) and that in 2020 rose to 8941 t/(hm2·a). During these two decades, the ability of soil conservation in the study area was enhanced to some extent. 2000–2020 witnessed an apparent increase in total soil conservation at the temporal scale in research area. However, the decentralize space pattern was relatively uniform and stable without obvious distribution differences. In general, it shows the decentralize characteristic of 'high in the north and low in the south.' In the research area, low-value areas played a dominant role, and a few high-value areas were located upstream of the top Ten Kongdui watershed . In 2020, the total soil conservation to upstream, midstream and downstream ,which was 7412t/(hm2 ·a), 1344t/(hm2 ·a), and 397t/(hm2 ·a), respectively, accounting for 80.95%, 14.72%, and 4.15% of the all number of soil conservation in the Ten Kongdui watershed in 2020. The land form in the upstream region were principally woodland and grassland with high altitude and topographic relief, which has a promoting effect on dirt and water holding. The windy and sandy district in the midstream of Kubuqi were mainly sandy lands, while cultivated lands dominated the alluvial plain area in the lower reaches, and soil and water holding was impeded due to the impacts of natural conditions or social economy.
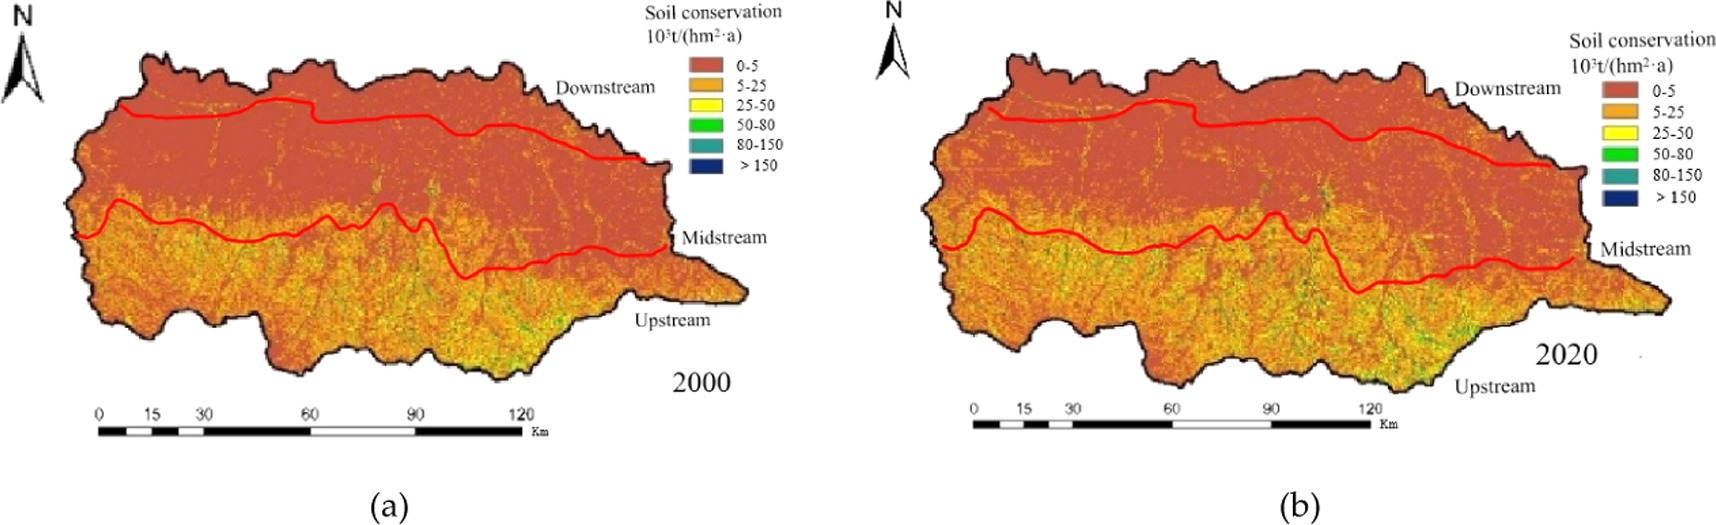
Figure 5. Soil conservation distribution in Ten Kongdui watershed(2000–2020).
Download figure:
Standard image High-resolution image4.3. Spatial heterogeneity analysis of vegetation coverage and soil conservation
4.3.1. Spatial autocorrelation analysis of NDVI
The following figure shows the change trend of the global Moran's I in the Ten Kongdui watershed during 2000–2020 (figure 6(a)). The values are all above 0.86. indicating that the NDVI in Ten Kongdui watershed maintained strong positively correlated spatial agglomeration over the long term. Furthermore, the Moran 's I of multi-year average NDVI is 0.921, reflecting a significant positive spatial correlation and high overall agglomeration degree of NDVI in the study area. Despite certain interannual fluctuations, the overall spatial pattern of NDVI in Ten Kongdui watershed maintained the development trend towards high agglomeration, along with strengthened spatial correlation and agglomeration effect.
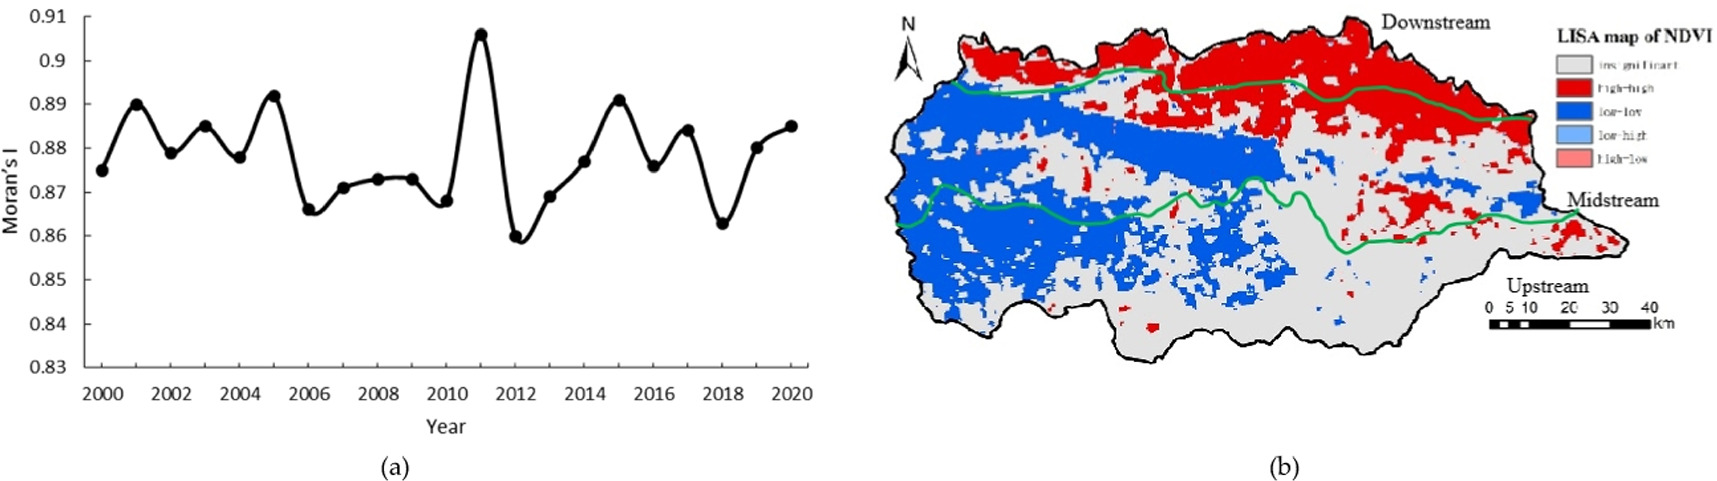
Figure 6. Variation trends of annual NDVI spatial autocorrelation characteristics in Ten Kongdui watershed. (a) Moran's I variation trend diagram; (b) LISA plot of multi-year average NDVI.
Download figure:
Standard image High-resolution imageThrough local spatial autocorrelation analysis (figure 6(b)), the temporal variation trends of the classified data of LISA spatial correlation types in the Ten Kongdui watershed were statistically analyzed. It was found that the correlation of NDVI in the Ten Kongdui watershed was mainly concentrated in three types: high-high, low-low, and insignificant, with only a small amount of low-high and high-low types. The LISA agglomeration map can visualize the spatial agglomeration characteristics of NDVI (figure 6(b)). The alluvial plain area in the lower reaches of the Ten Kongdui shows significant high-value autocorrelation characteristics, the western part of the hilly-gully region in the upper reaches and the wind-sand region in the middle reaches showed significant low-value autocorrelation characteristics. The pixel statistics was performed for the 'high-high' type representing high vegetation agglomeration and the 'low-low' type representing low vegetation agglomeration, among which, the 'high-high' type accounted for 25.28% and the 'low-low' type for 29.47% of the total area of Ten Kongdui watershed, and the sum of them reached 54.75%, revealing a high spatial agglomeration degree of NDVI in the Ten Kongdui watershed. Between high-value and low-value agglomeration areas were areas failing to pass the significance test ('insignificant') and spatial anomalies ('low-high' anomalies and 'high-low' anomalies), and the spatial anomalies were less, accounting for less than 1% of the total, indicating that there were few extreme values of NDVI in the Ten Kongdui watershed, and the areas of the 'insignificant' type were the key to how to transforming the ecological environment of vegetation in the Ten Kongdui watershed.
4.3.2. Interplace auto-correlation analysis of soil conservation
Autocorrelation analysis of soil conservation in the study region in 2000, 2010, and 2020 was performed, and the variation trend of the spatial autocorrelation characteristics was statistically analyzed (figure 7(a)). It was found that with an increase in the lagging distance, the Moran index showed a declining trend and reached the maximum value at a lagging distance of 500 m, being 0.594, 0.598, and 0.585 in 2000, 2010, and 2020, respectively. Moreover, the critical is always 1.96 lower than the annual global Moran index, it shows that the probability of soil retaining spatial random agglomeration was less than 1% (p < 0.01), And it shows distinct space auto-correlation.
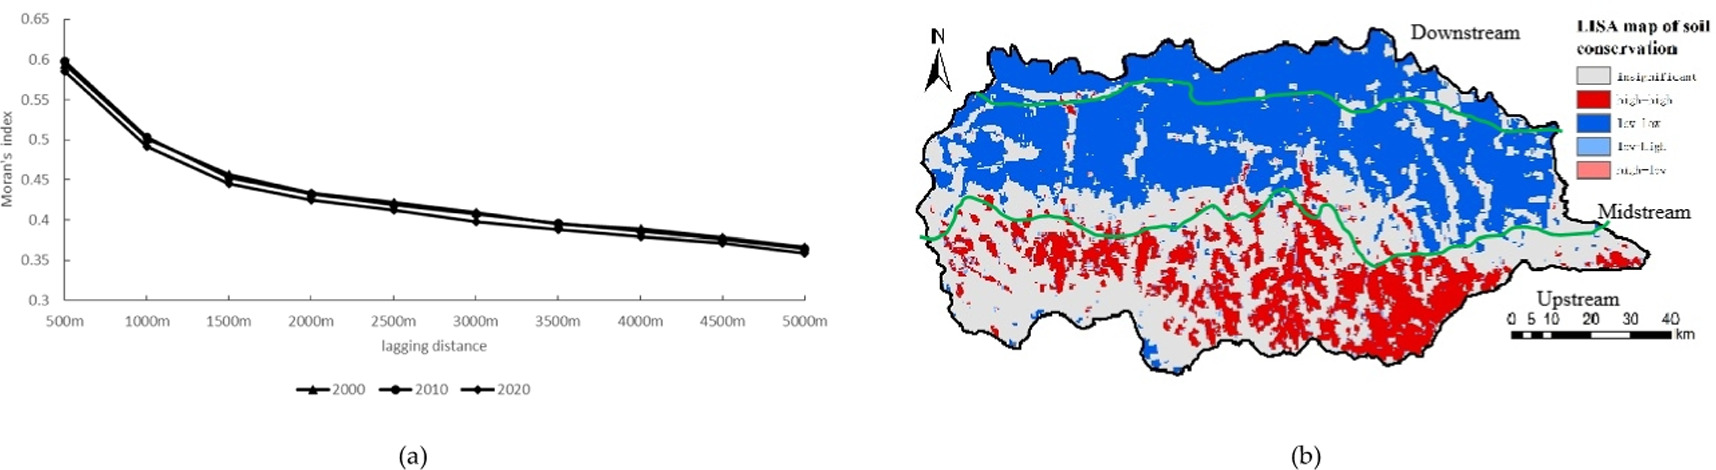
Figure 7. Spatial autocorrelation analysis of soil conservation in Ten Kongdui watershed. (a) Change in global autocorrelation Moran index; (b) LISA map of multi-year average soil conservation.
Download figure:
Standard image High-resolution imageThe LISA cluster map displays the spatial aggregation characteristics of soil conservation more intuitively. Under the precondition of passing the significance test of P = 0.05, the 'high-high' type was concentrated in the upstream of the Ten Kongdui watershed, and the midstream and downstream are divided into 'low-low' types. Through the statistics of various types of pixels, the 'high-high' type accounted for 15.83% of the area of Ten Kongdui watershed, and the 'low-low' type accounted for 40.83%, and their sum exceeded 55%, manifesting a high degree of spatial agglomeration in the Ten Kongdui watershed.
4.3.3. Dimensional heterogeneity analysis of vegetation coverage with soil conservation
Through the dimensional autocorrelation between NDVI and soil conservation in the Ten Kongdui watershed (table 3), the consequence showed which the bivariate Moran's I exponent displayed a significant correlation (P < 0.05), and Moran's I was always less than 0, increasing from −0.128 in 2000 to −0.013 in 2020. The gradual increase in Moran's I was mainly ascribed to the continuous growth of forest land area, continuous reduction of unused land area, and enhanced soil conservation capacity and vegetation coverage.
Table 3. Moran's I index and Pearson correlation coefficient.
| Year | 2000 | 2010 | 2020 | Multi-year average |
|---|---|---|---|---|
| Moran's I index | −0.128 | −0.062 | −0.033 | −0.078 |
| Pearson correlation coefficient | −0.142 | −0.105 | −0.056 | −0.102 |
Furthermore, bivariate local autocorrelation analysis of soil conservation and NDVI was carried out, and a bivariate (soil conservation and NDVI) LISA cluster map was obtained (figure 8), theses two completed a 95% significance test of, and the spatial heterogeneity distribution was obvious. The 'high-high' type areas showed both high vegetation coverage and high soil conservation, which were scattered in the upland and trench areas on the upper reaches. 'Low-low' type areas indicated both low soil conservation and low vegetation coverage, which were mainly distributed in Kubuqi windy and sandy area and the government seat of Dalad Banner on the middle reaches. 'High-low' type areas presented a enriched vegetation coverage and a low soil holding, most of which were distributed in the alluvial plain area on the lower reaches. In such areas, cultivated land was the dominant land-use type, with high vegetation coverage. However, the soil hardened due to long-term farming, the soil physical and chemical properties changed, the vegetation root system was shallow, and the anti-erosion ability was poor; thus, the soil conservation capacity was weak. The 'high-high' type domain were primarily located in the hilly with gully locations on the upper reaches, in which the main vegetation species were xerophytic and semi-xerophytic shrubs and grassland vegetation, and the vegetation coverage was not high. However, given the geomorphic type of hills and gullies, vegetation conditions were favorable, contributing to good soil conservation capacity.

Figure 8. Bivariate local autocorrelation of annual average soil conservation and vegetation coverage from 2000 to 2020.
Download figure:
Standard image High-resolution image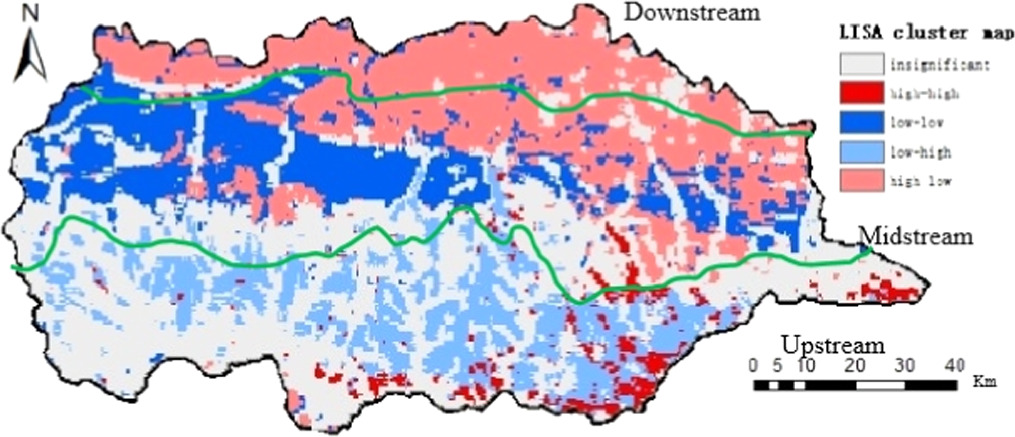
5. Discussion
In recent years, the Chinese government has made continuous efforts to control soil and water loss in the Yellow River Basin through policies promoting reforestation and ecological migration. As a result, the land use pattern of the basin has shifted towards large-scale artificial forests replacing cultivated and bare lands on steep slopes that were previously sources of erosion. This change has led to a significant increase in vegetation coverage, which has effectively controlled soil erosion intensity in the region. Remote sensing monitoring and soil erosion model estimation have confirmed these findings, demonstrating a clear correlation between changes in vegetation coverage and effective soil erosion control [28, 29, 35]. However, from a spatial perspective, soil erosion in small catchments in the Loess Plateau exhibits a distinct spatial distribution pattern that is closely associated with land use patterns and watershed topography factors. In hilly and gully landform types, terrain factors exacerbate runoff erosion intensity, while also influencing the soil erosion process through their impact on vegetation distribution. In the Loess Plateau, extensive vegetation coverage is predominantly found on relatively flat slopes, whereas steep gully slopes have comparatively lower vegetation coverage. The influence of topography on soil and water loss in desert and plain areas is relatively minimal [36–38]. Interestingly, the upper reaches of the Ten Kongdui region consist of hilly and gully areas with significant variations in topography, followed by desert areas in the middle reaches and plain areas in the lower reaches. The influence of vegetation coverage on soil conservation was studied by superimposing NDVI and soil conservation in the Ten Kongdui watershed. Most of the ground conservation in research region was in the medium-low coverage area, mainly because medium-low coverage was dominant in this area. Soil conservation in the low-coverage area was low, mainly because the area was mainly desert, bare land, and sparse vegetation, with serious soil erosion. Certain soil conservation existed in medium-coverage and medium-high coverage areas, but being relatively less, the low conservation was the dominant level, and the soil conservation in high-coverage areas was nearly zero. High-coverage areas in the drainage base accounted for the minimum proportion, which was less than 1%, so the total soil conservation was small despite the strong soil conservation function. However, it should be noted that the effects of topography on regional vegetation coverage and soil erosion are not identical.
Most experts concur that the ecological environment of the Yellow River Basin is currently exhibiting positive trends. However, there remains a lack of consensus regarding the driving factors behind this phenomenon. Research conducted by scholars and experts indicates that climate, policy, and human activities all exert varying degrees of influence on the transformation of the ecological environment in this region [39–41]. Nevertheless, further studies focusing on small and medium-sized basins reveal that in arid and semi-arid areas, land use structures have shifted from being predominantly cultivated or bare land to primarily forested and grassland areas due to policies such as returning farmland to forests. Consequently, erosion intensity within these basins has been largely controlled below moderate levels [42–44]. These findings also demonstrate that large-scale artificial vegetation significantly contributes to soil and water conservation at a catchment scale compared to climate factors - aligning with the results presented in this paper [45–47]. Additionally, certain studies highlight how unreasonable human activities like excessive deforestation and grazing can interfere with improving vegetation cover and enhancing soil conservation function - thus confirming this conclusion from an opposing perspective . However, it is important to consider the spatial variations in topography and rainfall for regions with complex underlying surfaces or located in climate transition zones. The Ten largest Kong Dui region serves as a typical example of a transition zone from arid to semi-arid climate, where rainfall exhibits a low-to-high trend from northwest to southeast that corresponds with the spatial distribution of vegetation cover. Previous studies have demonstrated a significant positive correlation between precipitation and vegetation cover, while also revealing a significant negative correlation with soil conservation - findings consistent with those presented here. Therefore, when developing soil erosion prediction models, parameters should be segmented and classified according to climate or terrain transition areas. In implementing soil erosion control measures, attention must be paid to whether regional precipitation conditions can support large-scale artificial vegetation.
6. Conclusions
This study showed that in the past two decades, there has been an overall increase in vegetation coverage within the Ten Kongdui basins of the Yellow River Basin, effectively controlling soil and water loss. There exists a positive correlation between vegetation coverage and soil conservation ability over time. At a spatial scale, there is also a certain degree of spatial correlation between vegetation coverage and soil conservation; however, this relationship is significantly influenced by topographic factors, resulting in non-uniform trends in vegetation coverage across different areas. Upstream regions experience significant improvement in soil conservation ability with increasing vegetation coverage; however, in middle and downstream areas, the association between vegetation coverage and soil conservation is not entirely close. The rate of change in vegetation coverage is relatively slow while soil conservation is additionally impacted by rainfall patterns and human activities. For regions represented by Ten Kongdui Watershed, more detailed research on soil erosion prediction models should be conducted to establish relationships among vegetation types, rainfall patterns, topography variations, and levels of soil erosion based on different underlying surface types within the same watershed area. In practical efforts for controlling soil erosion, selection of artificial vegetation types should vary according to specific topographic features and rainfall conditions while considering appropriate planting densities.
Data availability statement
All data that support the findings of this study are included within the article (and any supplementary files).
Author contributions
L Z and Z Y designed the paper. L Z and Z Y collected the data and wrote the paper. Z Y and J G revised the paper. J G and XL reviewed and the paper. Z Y and L Z are co-first authors. Every authors have read and give permission the ultimately manuscript.
Funding
This research was funded by the The Natural Science Foundation of Inner Mongolia(2021BS04009), the Major Science and Technology Projects of Inner Mongolia Autonomous Region 2021ZD0008) and the 'Science for a Better Development of Inner Mongolia' Program (KJXM-EEDS-2020005) of the Bureau of Science and Technology of the Inner Mongolia Autonomous Region.
Conflicts of interest
The authors statement no clash of profit.
Disclaimer/publisher's note
The statements, opinions and data contained in all publications are solely those of the individual author(s) and contributor(s) and not of MDPI and/or the editor(s). MDPI and/or the editor(s) disclaim responsibility for any injury to people or property resulting from any ideas, methods, instructions or products referred to in the content.