

Abstract
Increasing renewable sources in the energy mix is essential to mitigate climate change, not least in countries where the energy demand is likely to rise over the coming decades to reduce or even skip durations of time where fossils dominate. For Africa, solar photovoltaic (PV) and inland wind energy, combined with hydropower, provide significant and untapped potentials, whereas trends and robustness measures need further investigation. This study aims to gain insight into distributed trends in solar PV and wind energy potentials over Africa. This study employs relevant metrics, including relative change, model agreement, robustness, bias, and absolute levels for every available model combination and two climate scenarios, with energy planning purposes in mind. The study finds that regional climate models were the primary control of spatio-temporal patterns over their driving global climate model. Solar PV potentials show more coherence between models, a lower bias and general high potentials in most African regions than wind potentials. Favourable locations for inland wind energy include mainly the regions of greater Sahara and the Horn region. For wind and solar potentials combined, scattered locations within Sahara stand out as the most favourable across scenarios and periods. The analysis of minimum energy potentials shows stable conditions despite low potentials in certain regions. The results demonstrate a potential for solar and wind power in most of the African regions and highlight why solar and wind power or synergies of energy mix should be considered for local energy planning and storage solutions.
Export citation and abstract BibTeX RIS

Original content from this work may be used under the terms of the Creative Commons Attribution 4.0 licence. Any further distribution of this work must maintain attribution to the author(s) and the title of the work, journal citation and DOI.
1. Introduction
Introducing renewable and greenhouse gas (GHG) emissions-neutral energy conversion technologies is generally considered essential to mitigate anthropogenic climate change (IPCC 2014). In the context of reducing global GHG emissions, developing countries need to implement sound domestic policies that target the application of renewable energies to tackle climate change and foster economic growth (Szabó et al 2013). Given rapid population growth in developing countries, especially in Africa, clean energy transition such as the adoption of solar and wind power will not only promote the application of low-carbon energy technologies but also achieve universal energy access and improve economic growth and human development (Rygg 2012, Adenle 2020). The success in this transition will have immense implications for reducing global GHG emissions (Khobai and Le Roux 2017). Recent trends suggest that economic growth and increasing demands for consumer goods and electricity are sharply rising in large parts of Africa and other developing countries. From 2020 to 2030 alone, (IRENA 2021) estimates an annual increased weighted average energy demand of 5.6% across Africa.
Mitigation policies must go hand in hand with increased access to electricity through renewable energy technologies to enable prospects for improved livelihoods, and the achievement of sustainable development goal (SDG) targets across key sectors, including agriculture (SDG2), education (SDG4), water (SDG6) and energy (SDG7) (Amoah et al 2020) and in itself enable drivers for economic growth (Bissiri et al 2020). The current energy mix of Africa is almost composed of fossil fuels and biomass, but studies suggest good prospects for targeting renewable energy deployment (Schwerhoff and Sy 2019), although requiring investments and cross-border cooperation (Ouedraogo 2019).
1.1. Projected renewable energy potentials and challenges in implementation studies
In recent years, a growing body of literature investigating Africa's projection side of renewable energy potentials has primarily focused on hydropower, solar and wind technologies. Solar and wind power hold massive potential as the African energy system transition to low-carbon technologies and a future expansion of electricity generation in the continent (IEA 2022). In this regard, several studies highlight the projection of solar power and wind power as essential for electricity generation in Africa, often relying on either global- or regional climate models (GCMs and RCMs) or a combination thereof. Despite potential benefits, many barriers associated with applying solar and wind energy technologies are also pointed out.
A study by (Akinsanola et al 2021) analysed wind speeds and wind power densities over West African countries using a 14-model ensemble of GCMs from the coordinated model intercomparison project v.6 (CMIP6) showing a general increase across variables for countries along the coast from Guinea towards Gabon. In contrast, the study showed decreasing trends in wind energy potentials in inland regions of Sahel/Sahara. Projections were based on the high-emission Shared Socio-economic pathway (SSP) SSP5–8.5 towards the mid- and end-century and showed generally robust trends across the model ensemble. Another study by (Ogunjobi et al 2022) used seven RCMs to assess wind power potentials over West Africa finding general reductions or status quo in power production across periods and scenarios, except for the Representative Concentration Pathway (RCP) RCP8.5 in 2071–2100, where an increase of 24%–30% was seen.
Similarly, solar power potentials over Africa were assessed by (Soares et al 2019) using RCM ensembles to study future solar photovoltaic (PV) potentials. Their findings showed general small decreasing trends in solar energy potentials for the majority of the African countries for both RCP4.5 and RCP8.5 towards 2100. Similar findings have been reported by (Bichet et al 2019). Local studies include (Fant et al 2016) showing near-zero median changes in energy potentials from wind and global horizontal irradiance (relevant to solar PV) over Southern Africa. This is consistent with (Tang et al 2019) where ten GCMs and five RCMs where used to analyse surface solar irradiation over Southern African countries showed systematic patterns in energy potentials related to the RCP scenario.
In addressing wind and solar energy potentials based on multi-model ensembles, (Sawadogo et al 2020) employed a single RCM to decompose the influence of the driving GCM on measures of solar PV, concentrated solar power (CSP) and wind energy, showing a general low spread across models and variables and with cloud cover most affected. In (Kwadwo Danso et al 2022), a 14-member CMIP6 GCM model ensemble was used to assess future solar PV potentials over West Africa, showing reductions towards 2084 as opposed to 2050 for SSP5–8.5 relative to the historical period.
A general conclusion across studies within this field of renewable energy implementation in Africa is a general and, so far untapped, high potential for both solar and wind energy utilisation: For wind power, (Mentis et al 2015) found a general high current wind power potential across the African continent alongside a common under-utilisation of these potentials. A similar conclusion was made in (Sterl et al 2018), where West Africa was assessed for dynamics between increased solar and wind power implementation and in (Wu et al 2017), where optimisation scenarios for siting solar PV, CSP and wind energy, including interconnection options, were assessed.
Several studies have assessed barriers and potentials for the implementation of added renewable energy conversion sources into the energy mix for Africa. An integrated approach where elements of demand, supply, implementation and policy are included is seen in a number of studies. One of these includes (Van der Zwaan et al 2018), where the optimisation-based TIAM-ECN integrated assessment is used, and a potential of adding approximately 160 GW of renewable energy generation into the African energy mix by 2030 is found. Aside from the TIAM-ECN model, several other models and tools have been applied for integrated energy assessments within Africa and include REVUB (Sterl et al 2020), OSEMOSYS-TEMBA (Taliotis et al 2016), IRENA-Flextool (IRENA 2018), ONSSET (Mentis et al 2017), CLEWS (Ramos et al 2021), LEAP (Ouedraogo 2017) and PLEXOS (van Dongen et al 2021). It is beyond the scope to characterise them all, but their abundance highlights the current political and research-oriented focus on addressing renewable energy sources in Africa from many perspectives and research questions.
Relevant to wind and solar power integration in Africa are also off-grid solutions, such as hybrid renewable energy systems, which are currently emerging in favour of traditional diesel/kerosene mini-plants, especially in the rural regions, to thereby omit the challenges of power distribution (Come Zebra et al 2021). Due to the intermittent nature of renewables, such hybrid systems would depend on several energy conversion technologies (e.g. solar and wind), possibly supplemented by hydropower systems and other storage solutions such as batteries.
Barriers to renewable energy implementation in Africa have been examined by e.g. (Sweerts et al 2019) arguing about the role of financing schemes in the deployment of renewable energies on the African continent. For Sub-Saharan Africa, a private investment-based financial model was found to be most effective and, at the same time, environmentally friendly for increasing rural electrification (Yang and Yang 2018). For Tanzania, (Aly et al 2019) investigated barriers to introducing large-scale solar power concluding that institutional, financial and technological barriers represent significant obstacles to the implementation of solar and wind projects, often discouraging investments.
1.2. Aims and novelty
This study aims to contribute to a current cross-disciplinary gap in between climate change robustness and implementation of renewables in energy planning. Specifically, the objective of the paper is to perform a combined assessment of the climate change signal on Solar PV and wind power potentials over the African continent with regards to trends, model ensemble robustness, extremes, spatial distribution and seasonality. The assessment methodology of energy potentials is designed to facilitate energy planning purposes regarding localisation, absolute energy potentials and changes in the interplay between renewable sources and minimum energy supply potentials, which enables an assessment of potential storage and transmission capacities.
The novelty of the study, is seen in the combination of climate science, where the most elaborate approach possible is applied with regards to data basis and state-of-the-art assessment methodologies, and renewable energy science, where a specific focus on metrics that meet stakeholder needs are designed and applied. Specifically, every GCM/RCM model combination covering the continent within the Coordinated Regional Climate Downscaling Experiment (CORDEX) available at the time of investigation is employed in a combined assessment of solar PV and wind energy potentials. This approach provides a previously unseen collection of geographically distributed measures of renewable energy conversion technology projections into the energy grid of Africa.
A list of general acronyms used within the manuscript is provided in appendix.
2. Data and methods
The analysis of projected future solar and wind energy potentials uses the standard 30-year climatic periods in its assessment of future periods of 2036–2065 (mid-century) and 2071–2100 (end-century) and employs the 1976–2005 period as a historical reference period, as seen in CORDEX. The climate data for the analysis stem from the CORDEX data repository (Giorgi and Gutowski 2015), which is the regional climate modelling community standard for obtaining output from well-established and research-based modelling communities globally. To obtain the best possible robustness, every available combination of global (GCMs) and regional climate models (RCMs) covering the continent at the time of investigation is included (appendix).
All data were analysed in daily resolution and processed in 0.44-degree spatial resolution (∼50 km), the finest available spatial resolution over Africa when a sufficient number of models is needed to employ a multi-model ensemble approach. The ERA5 reanalysis dataset (Hersbach et al 2020) was used as a reference to enable bias and validation of the multi-model ensemble simulations (appendix). Reanalysis data derive from models, which have been assimilated with observations and can therefore serve as a validation data set but with more variables available and a spatiotemporal coverage corresponding to the reanalysis model grid resolution and output storage frequency. The ERA5 data was bilinearly interpolated from its original horizontal resolution (∼30 km) to match the model grid of the CORDEX datasets (∼50 km). Variables to enable the calculation of PV and wind energy potentials were extracted from the GCM/RCM model combinations (appendix table A.1). For solar PV, the methodology was based on (Jerez et al 2015), employing the variables of 2m near-surface air temperature (tas), shortwave downwelling radiation (rsds, global radiation) and near-surface (10 m) wind speed (sfcwind) to provide the power potential for this technology at any given location in W/m2. Of the three controlling variables, the shortwave radiation (rsds) is the central control of resulting power potentials. For the calculation of wind energy potentials, the CORDEX variable of near-surface (10 m) wind speed (sfcwind) was used based on (Reyers et al 2015). The wind energy potential calculations take their onset in the output from a single 2.5 MW capacity wind turbine with an 80 m hub height and a 100 m rotor diameter, and the output is therefore measured in KW based on the wind levels at any given point. It is beyond the scope of this paper to assess the optimal type of wind turbine for each application.
The solar PV and wind energy potentials were assessed for the historical period (1976–2005) in terms of absolute levels for the ERA5 data and the multi-model ensemble and residuals for each GCM/RCM model combination (model minus ERA5). For the projected future, the climate change scenarios of RCP4.5 and RCP8.5 were used, representing medium- and high- emission scenarios, respectively. These scenarios represent the currently available state-of-the-art basis for RCMs as available from the CORDEX data repository and derive from the Intergovernmental Panel of Climate Change (IPCC) assessment report no. 5. (IPCC 2014). The relative changes for each of the two future scenarios were plotted for the 2036–2065 and 2071–2100 periods for the multi-model mean and each model combination. Relative changes were used since the critical variables for the calculation of solar PV and wind energy potentials are non-state variables (rsds and sfcwind) as in (Seaby et al 2013) and as seen in e.g. (Matte et al 2019).
Four selected criteria relevant for energy planning purposes were also assessed and visualised for the entire model domain for all combinations of RCPs, periods and both wind energy and solar PV potentials. The criteria assess whether a certain threshold is exceeded or not at any given grid point, and reflect measures of (1) robustness, (2) absolute energy potentials, (3) bias and (4) a combination of all three. All criteria were defined with a lenient (less strict) and a more conservative approach (severe) to include a robustness span. The criteria are described below and summarised in table 1.
- 1.Criterion no. 1 (robustness): For both solar PV and wind, the lenient threshold employs the signal-to-noise ratio (S/N) level of 1, as most often used, in e.g. (Christensen et al 2019), whereas the conservative threshold uses an S/N level of 2 as in e.g. (Ossó et al 2021). The S/N metric indicates the relationship between the degree of change against the degree of spread and is therefore a common measure of robustness.
- 2.Criterion no. 2 (absolute energy potentials): The two absolute solar PV energy potential thresholds follow specific economic and commercial viability levels from the literature (EPA 2015, U.S. Department of Energy Efficiency and Renewable Energy 2003). For wind energy potential, thresholds were set corresponding to mean wind speeds of five m/s and six m/s (at 80 m hub height for the design turbine used for this study), which is the upper and lower level of minimum mean wind speeds for economic viability in literature (Breeze 2016, von Krauland et al 2021).
- 3.Criterion no.3 (bias): Specific bias levels of 25% and 5% are used (model relative to reanalysis validation data), reflecting typical confidence levels. By applying this approach on threshold definitions, both technologies (solar and wind) were aligned in their assessment.
- 4.All of the above combined, but for both the lenient and conservative criteria.
Table 1. Criteria for assessing distributed energy potentials over the African continent.
| Criterion no. | Assessment criteria | Lenient criteria (less strict) | Conservative criteria (strict) |
|---|---|---|---|
| 1 | Robustness of climate change signal and model agreement | Absolute signal-to-noise ratio > 1 (relative change over standard deviation) | Absolute signal-to-noise ratio > 2 (relative change over standard deviation) |
| 2 | Absolute energy potential thresholds (from literature—see main text) | Solar: Energy potential > 208.33 W m−2 | Solar: Energy potential > 250 W m−2 |
| Wind: Energy potential > 210 KW | Wind: Energy potential > 264 KW | ||
| 3 | Model bias | Model ensemble bias for the historical period < 25% | Model ensemble bias for the historical period < 5% |
| 4 | Combination of criteria 1–3 | Criteria above combined | Criteria above combined |
Six regions covering the continent were selected to study sub-yearly dynamics based on their shared general climatic attributes (figure 1). Specifically, the analysis calculates and plots the model ensemble mean and standard deviation of minimum daily and monthly solar and wind energy potentials for each calendar month of the three 30-year periods and each RCP scenario. This analysis of the seasonality of minimum levels, and their occurrence throughout the year, was designed to assess the timing and magnitude between renewable energy source supply and their potential changes in the projected future.
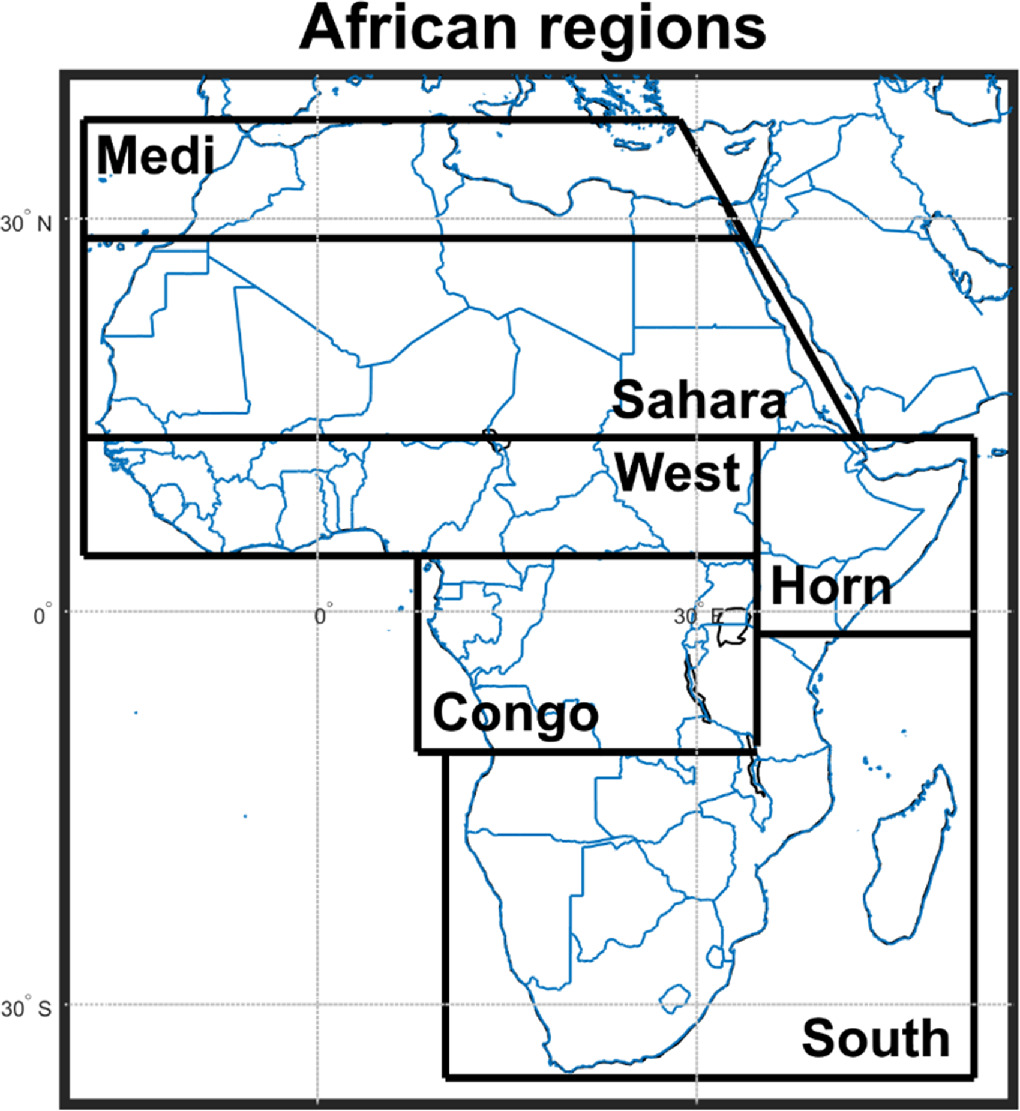
Figure 1. The six African regions from which land grid cells are extracted to plot the values in figures 9 and 10.
Download figure:
Standard image High-resolution image3. Results
3.1. Historical evaluation of regional climate models
Initially, the historical (1976–2005) RCM model ensemble simulations were compared to the ERA5 reanalysis data in absolute values followed by the individual bias (model subtracted from ERA5) for each RCM member, as well as for the ensemble mean, grouped by RCMs (figure 2). Absolute solar PV potentials are within the range of 150–300 W m−2, and the RCM ensemble-mean resembles the ERA5 dataset, whereas individual RCMs have biases within the typical range of +/− 50 W m−2. It is also highly evident that the RCM is the primary influential factor over the choice of GCM on the magnitude and pattern of solar PV potentials, and models can easily be grouped visually. For example, the RCA4 model, and to some extent the UQAM model, shows a pattern of a positive trend across the southern Sahel, the Horn and Congo regions, whereas differing but distinct negative biases dominate other models.
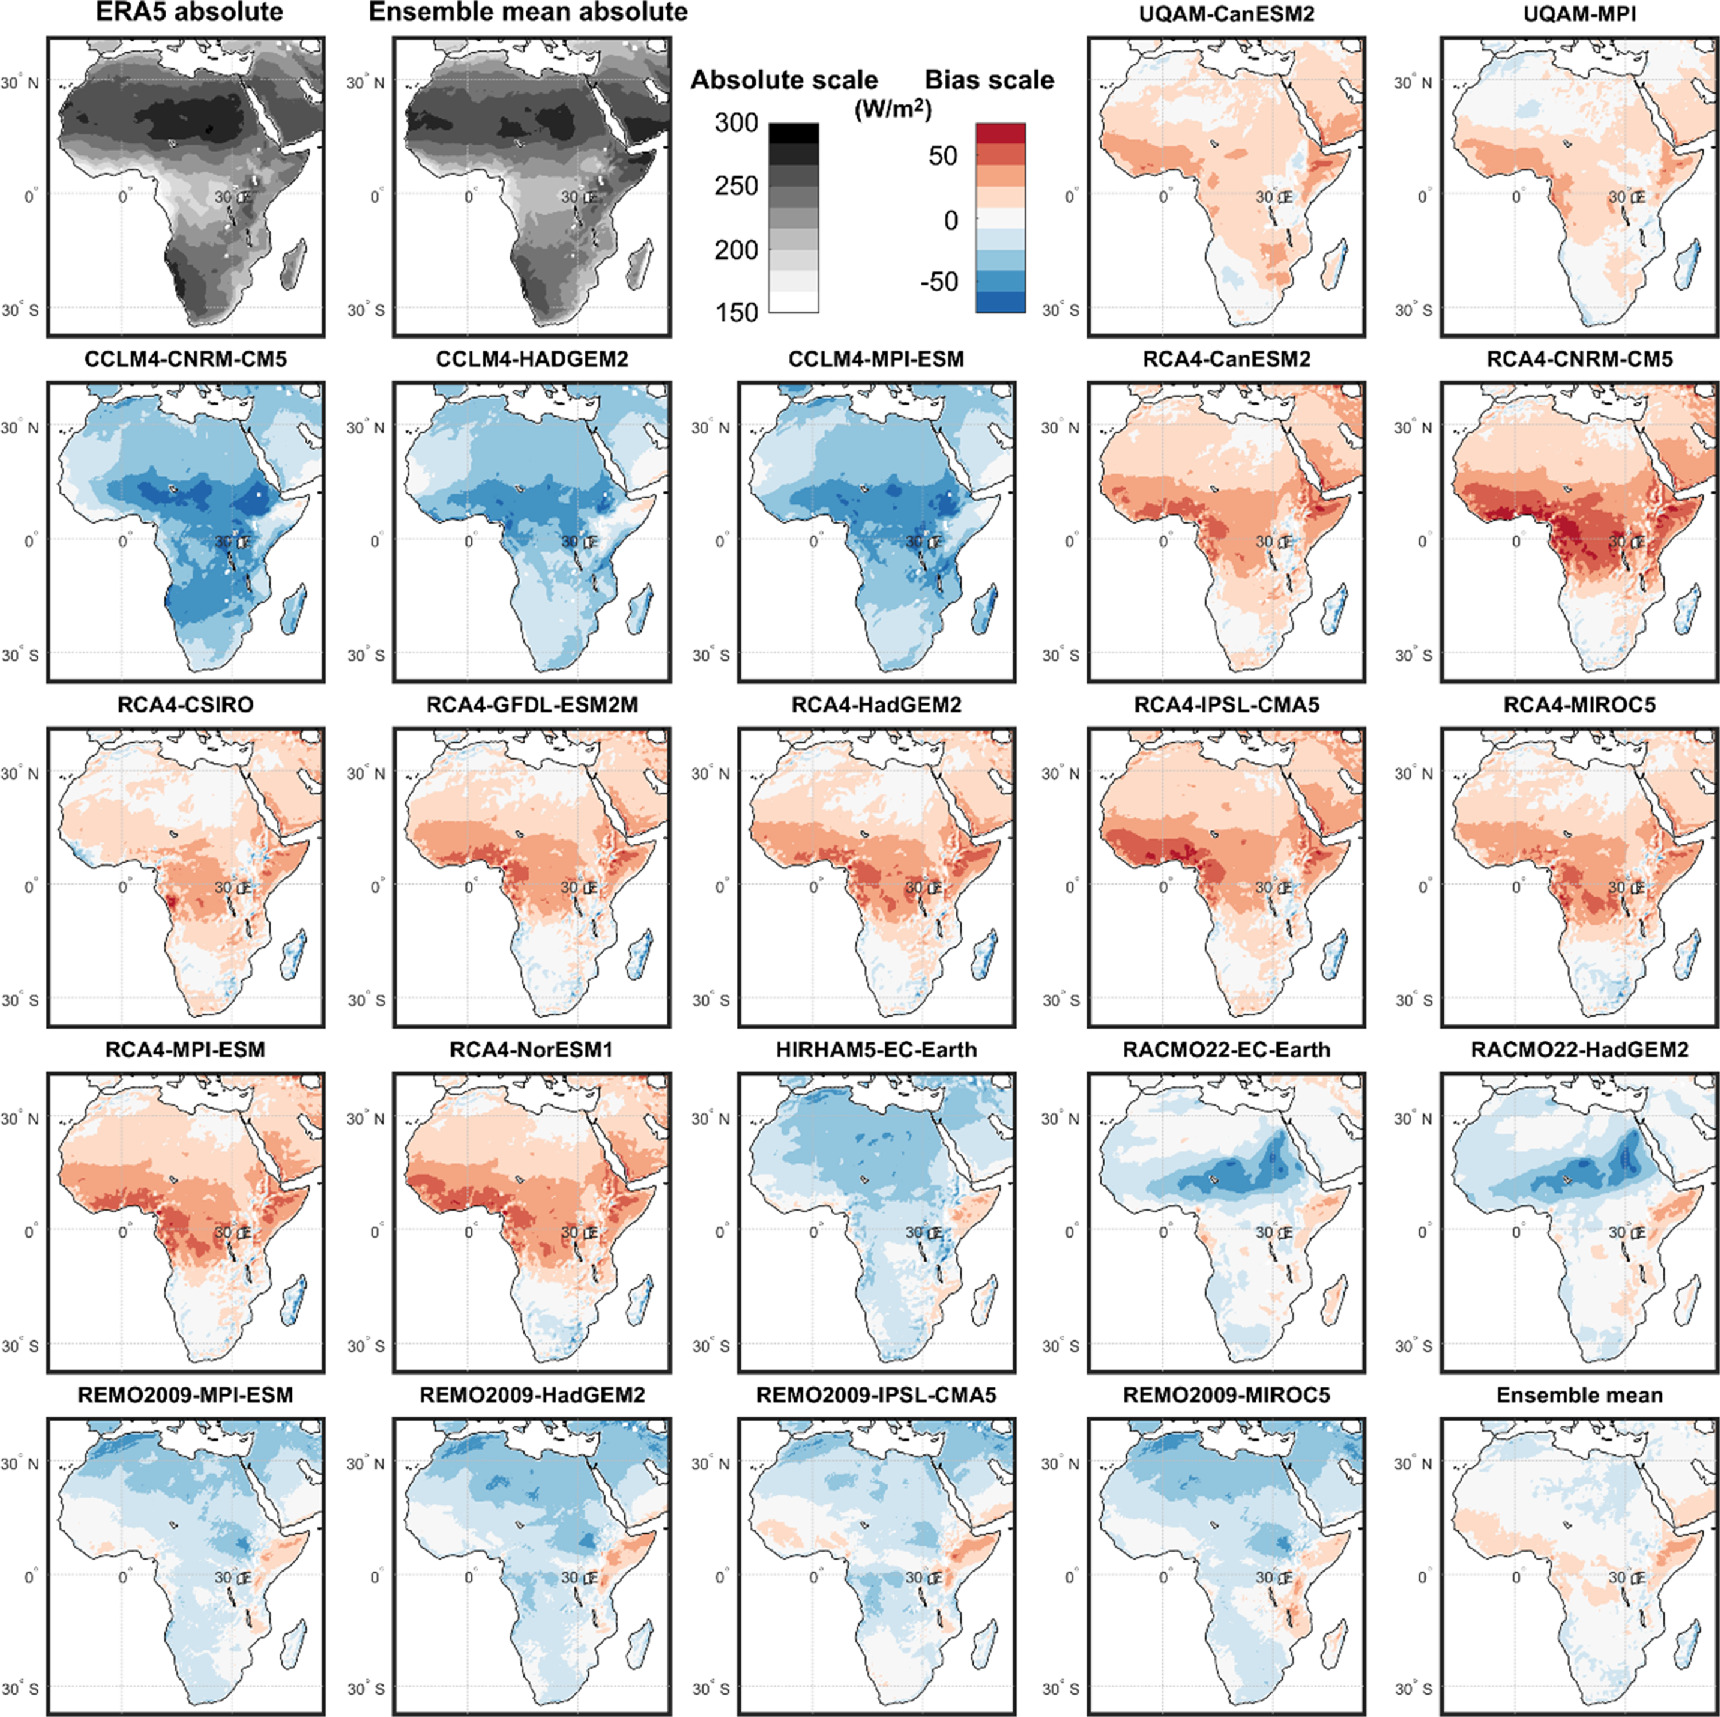
Figure 2. 1976–2005 solar PV potentials for ERA5 and the RCM multi-model ensemble mean (absolute) and the individual model and multi-model ensemble mean residual biases (all in W m−2). Relative changes for future RCPs and periods for individual models are shown in figures A.1–A.4 and summarised in figure 4.
Download figure:
Standard image High-resolution imageSimilar to the simulation of solar PV potentials, the RCM historical (1976–2005) wind energy potential ensemble-mean corresponds very well to ERA5 regarding both magnitude and spatial patterns, including very local features (figure 3). The absolute wind energy potentials range from virtually zero towards 1 MW. To some degree, and as for solar PV potentials, the resulting patterns affected by the driving RCM, e.g. the UGAM, CCLM4 and RCA4 models, distinctly exhibit the same spatial patterns with general negative biases over Sahara and positive biases over the Sahel, where the RACMO22 and REMO models agree in general terms on more positive biases here. In general, biases south of 10°N seem much more comparable across RCMs. Finally, the HIRHAM5 model stands out as an extreme positive bias outlier (checked—only one model run available in CORDEX).
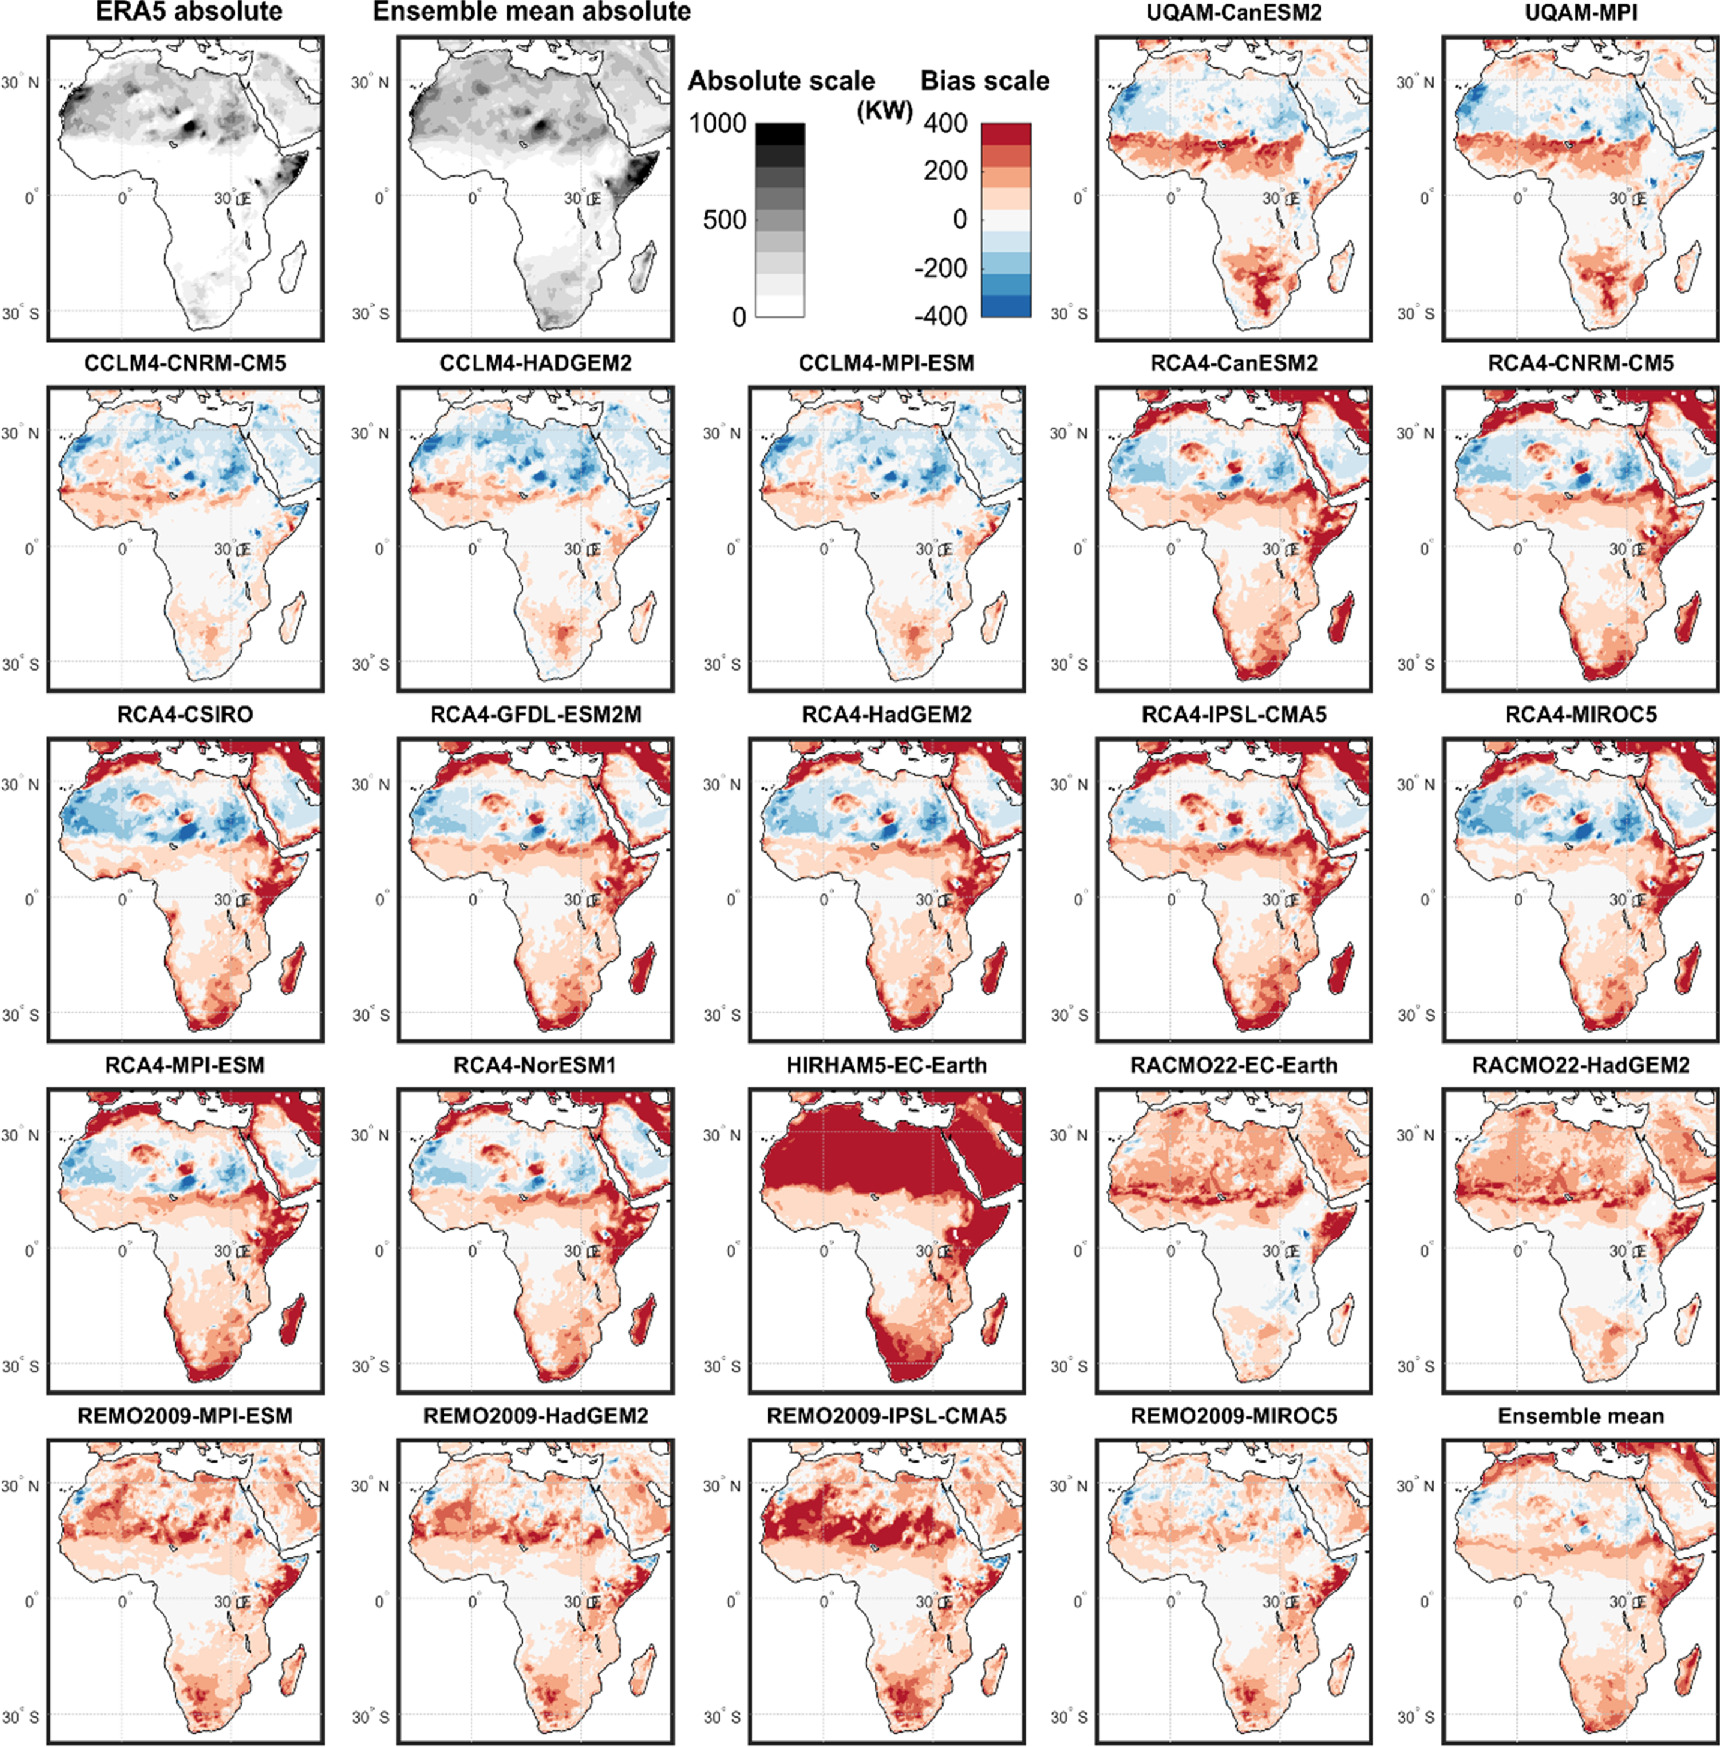
Figure 3. 1976–2005 wind energy potentials for ERA5 and the RCM multi-model ensemble mean (absolute) and the individual model and multi-model ensemble mean residual biases (all in KW). Relative changes for future RCPs and periods for individual models are shown in figures A.5–A.8 and summarised in figure 5.
Download figure:
Standard image High-resolution image3.2. Climate change impacts on renewable energy sources
For the results on the multi-model mean solar PV, a distinct difference is seen between the two RCPs where RCP4.5 exhibits a general decrease of 0%–5% in central Sahara, the greater Horn region and southwest Africa and increasing trends of similar magnitude towards the Mediterranean and the southwest African coastline and the Congo basin. No significant differences between the mid-and end-century periods are seen (figure 4). For RCP8.5, on the other hand, a general decrease is seen across all of the African continent, and with a higher magnitude for the 2017–2100 period beyond −5% for more significant parts north of −10°S. These reductions are related to the rsds variable (shortwave solar radiation—not shown). Looking into the results of the GCM/RCM combinations (figures A.1–A.4), the solar energy potential of the RCM ensemble mean is a result of a general pattern across the model runs where only the HIRHAM5 model and two of three CCLM4 models stand out as dissimilar to the general pattern.

Figure 4. The ensemble-mean relative change in solar PV potentials (%) for the combination of periods (2036–2065 and 2071–2100) and RCPs (RCP4.5 and RCP8.5) compared to the 1976–2005 reference period. Notice that the colour scale limits differ from the appendix plots for added detail. Individual models are shown in figures A.1–A.4.
Download figure:
Standard image High-resolution imageA general increase in wind energy potentials is projected across Africa (figure 5). The projections' magnitude increases towards the end of the century, primarily for RCP8.5 compared to RCP4.5. However, some areas with differing patterns, such as central Sahara, are seen between the RCPs. The most significant increase is projected for the region around the Democratic Republic of Congo, Congo and Gabon, which is also dominated by general low absolute wind energy potentials (see A.7). The increase for this region seems to result from mainly the RCA model. Other distinct patterns within each RCM grouping are seen, such as decreasing trends in West Africa for the RACMO22 model (figures A.5–A.8).
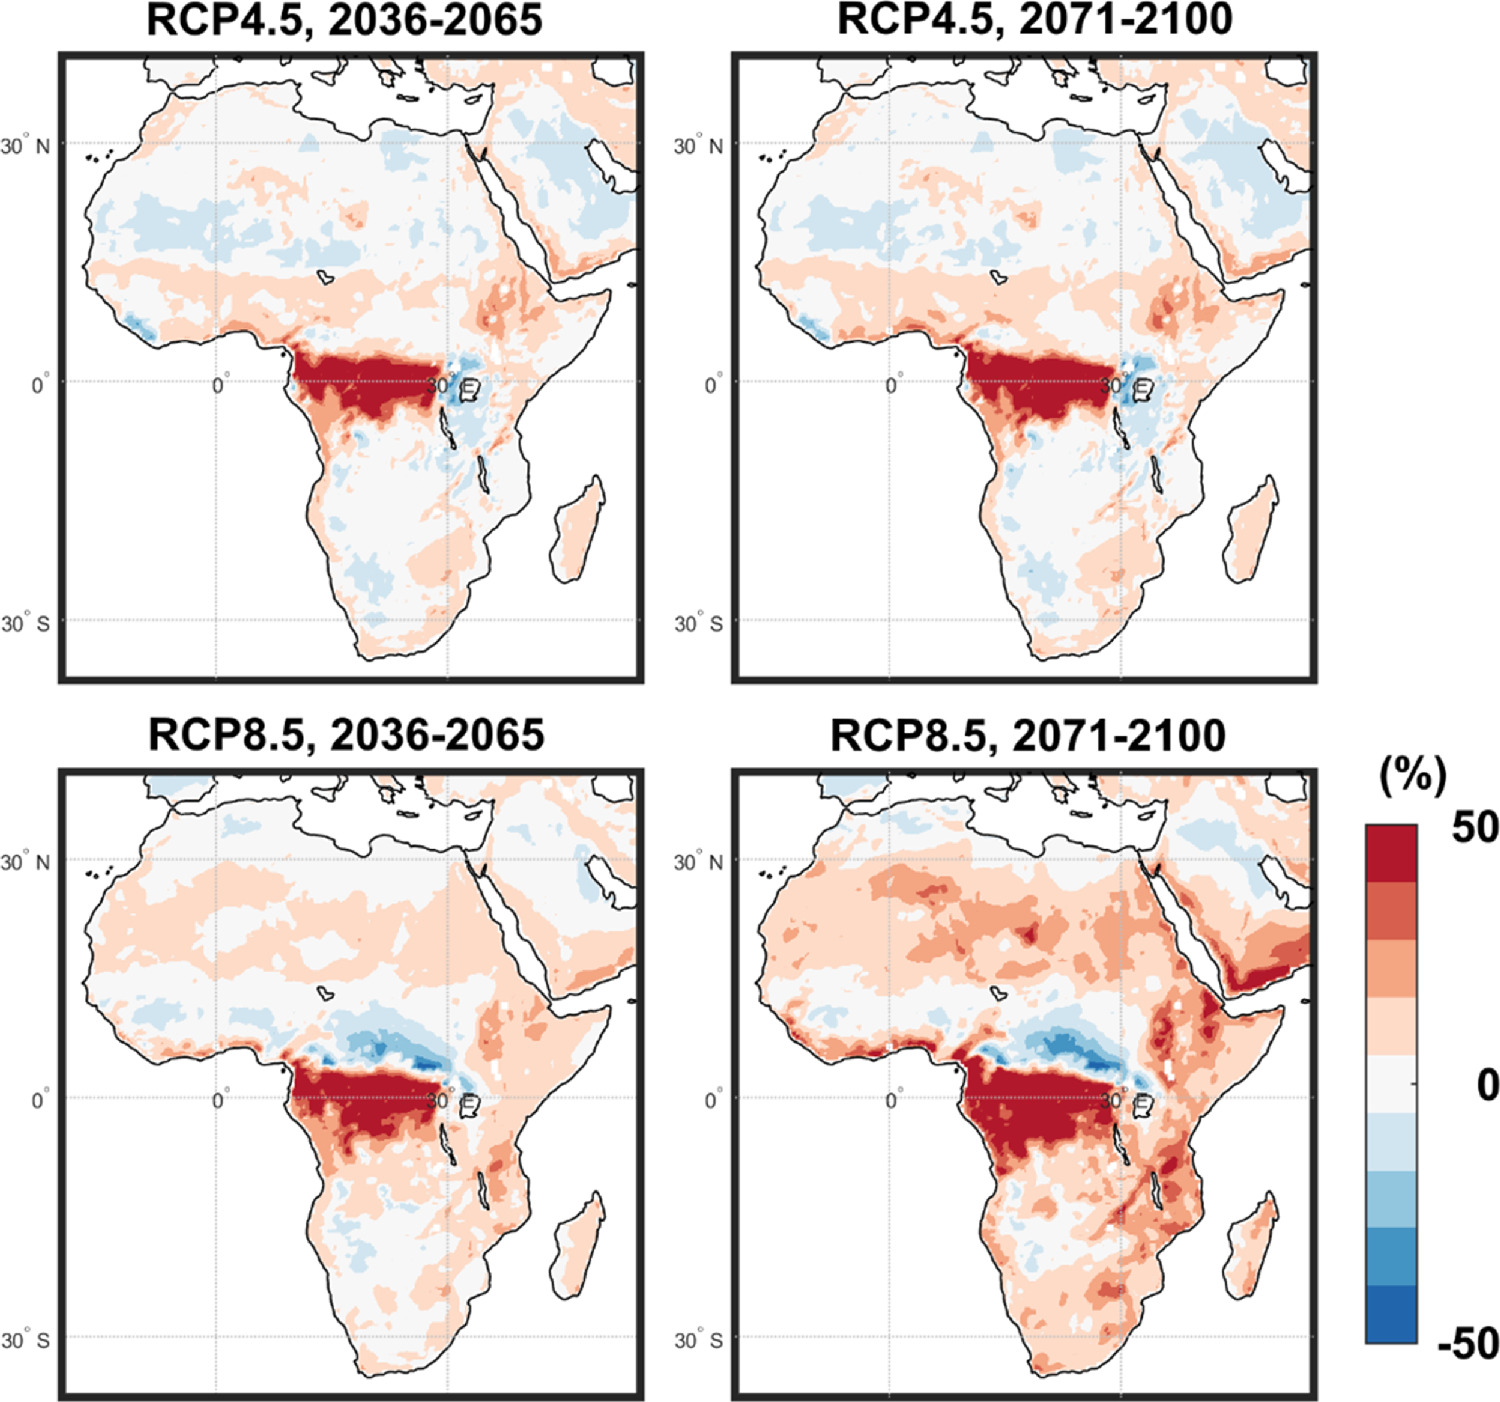
Figure 5. The ensemble-mean relative change in wind energy potentials (%) for the combination of periods (2036–2065 and 2071–2100) and RCPs (RCP4.5 and RCP8.5) compared to the 1976–2005 reference period. Individual models are shown in figures A.5–A.8.
Download figure:
Standard image High-resolution image3.3. Robustness of the change signals
For the measure of the projected climate change signal robustness and model agreement, S/N ratios >1 were generally met in Northern Africa north of Sahara and the Horn region for RCP4.5, whereas a substantially larger area towards the equator met this criterion for RCP8.5 (figure 6, column one). The S/N ratio >2 threshold is met in substantial subsets within the S/N >1 area. An absolute energy potential threshold of 208 W m−2 was met almost throughout Africa, corresponding to levels of, e.g., only the southernmost parts of Europe bordering the Mediterranean. In contrast, a threshold of 250 W m−2 was not met along the Mediterranean coastline in central and southeastern Africa (column two). Little effect was seen related to RCP and future projection period. Historically, the ensemble mean bias was below 25%, assessed against ERA5 data, for the entire African domain, eastern Madagascar coastlines excluded, whereas a 5% bias threshold was not met along the northwestern Mediterranean coastline and in parts of western and central Africa (column three). For the combined areas of these three sets of criteria (right column), the S/N ratio generally controls the fulfilment extent: Northern parts of Africa, the horn region included, fulfil the lenient criteria, whereas mainly the northern Sahara and small areas of southern Africa reach the conservative threshold criteria. The lenient criteria are generally controlled by RCP for the combined plots, whereas the traditional criteria measures are more similar between RCPs.
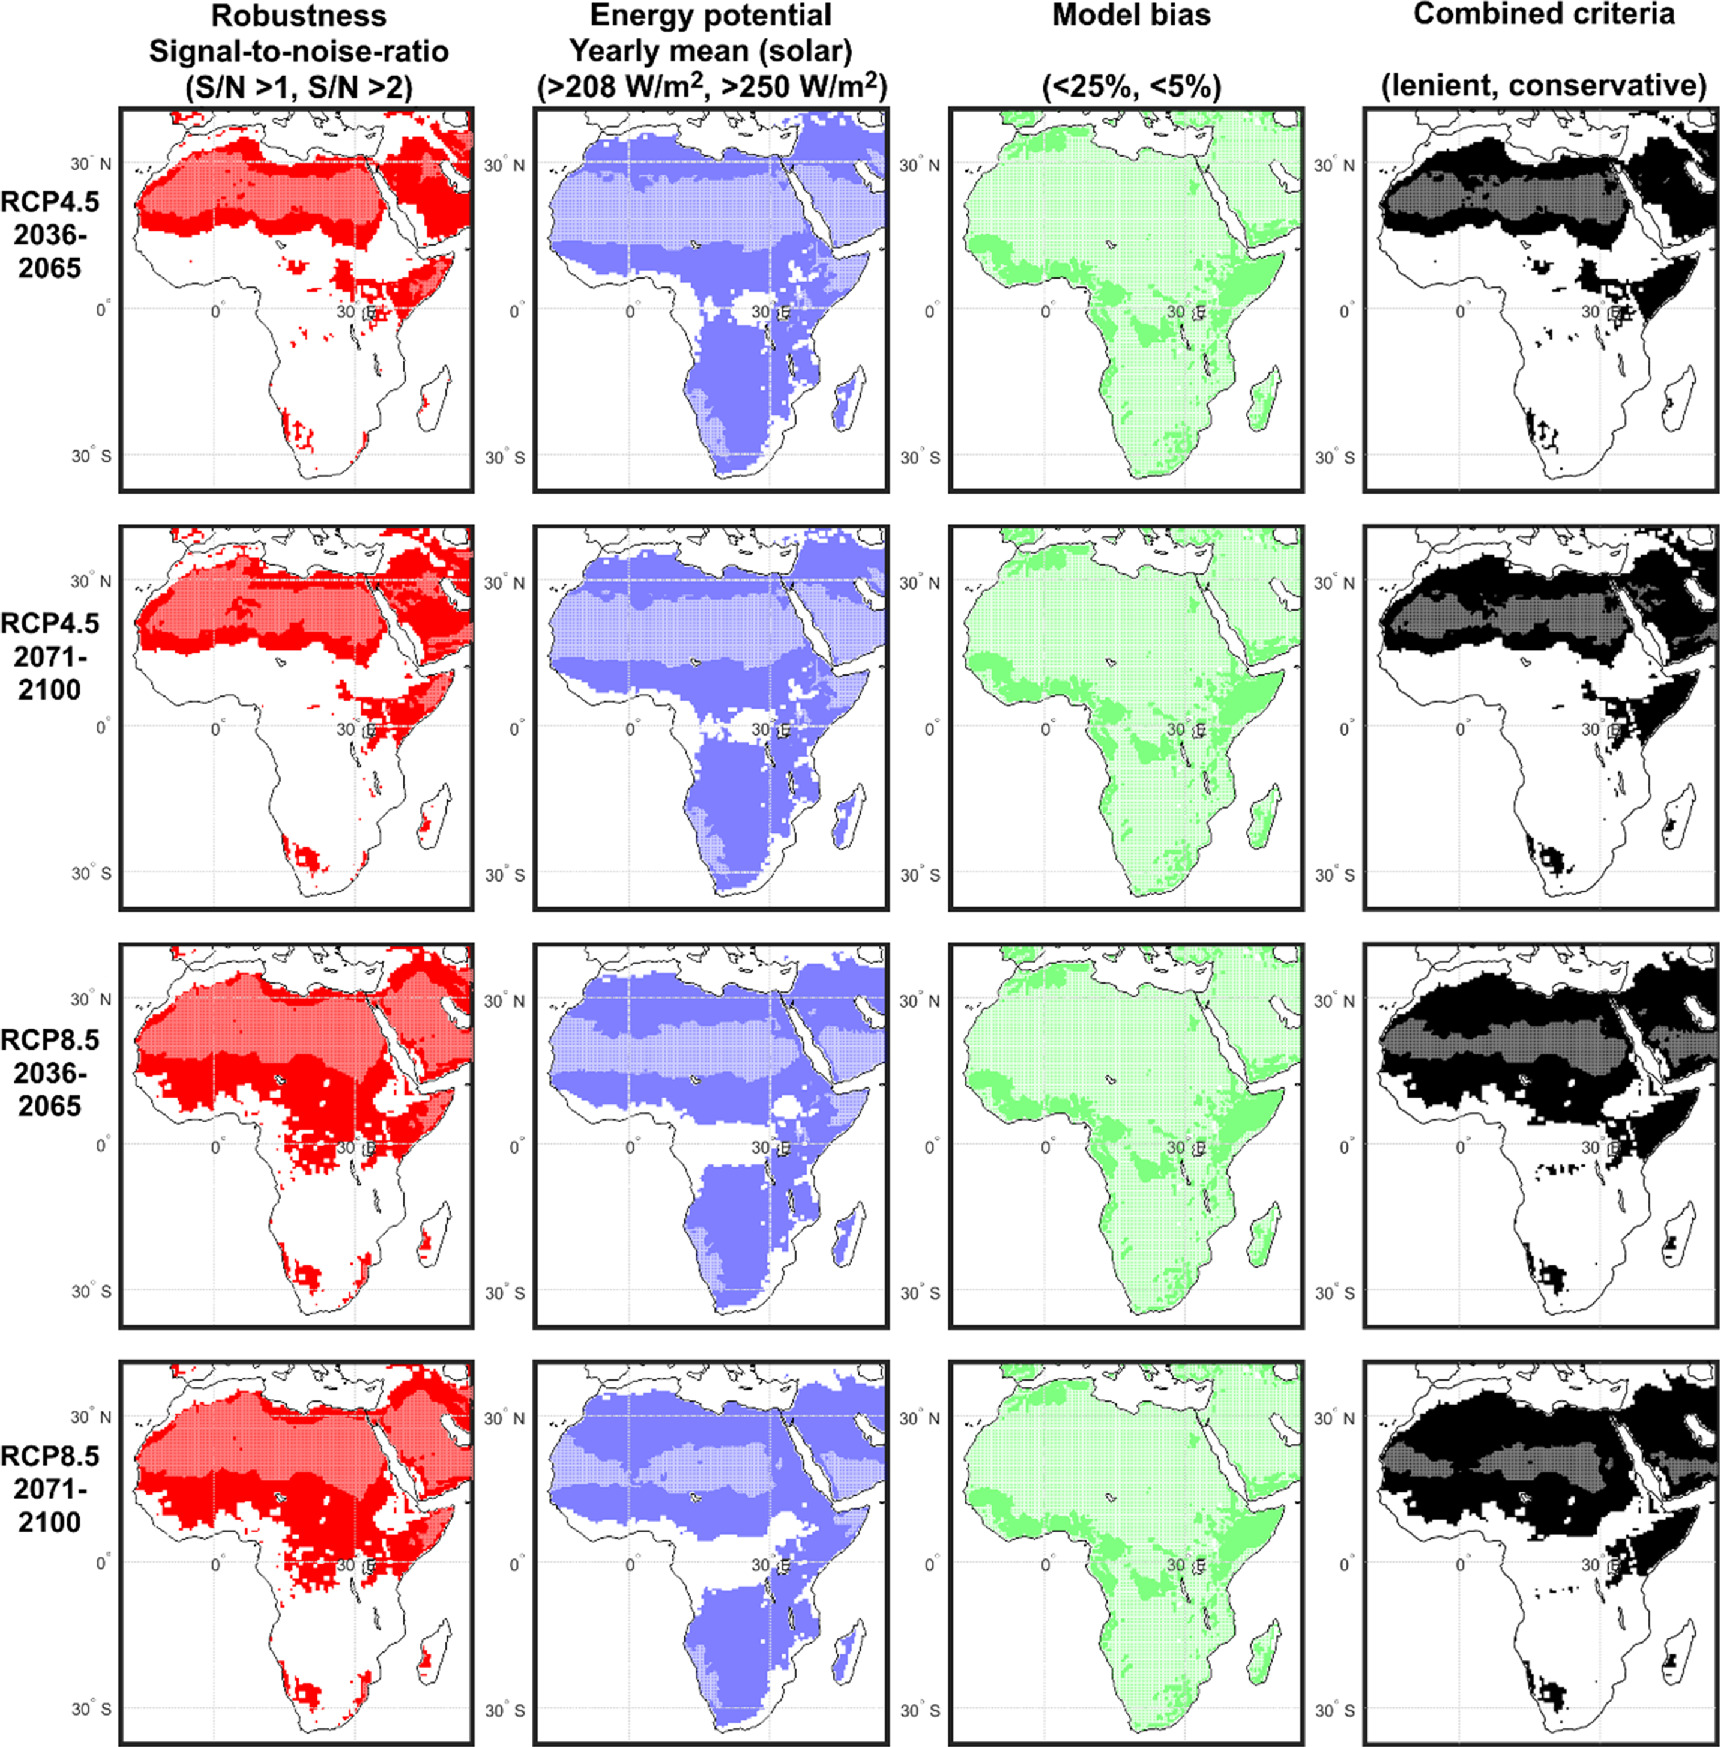
Figure 6. Spatial distribution of criteria shown in table 1 for solar energy potentials on the robustness of the climate change signal, absolute energy potential thresholds, model bias and all three combined (left to right) for both RCPs and periods. Bright colours (conservative criteria) superimpose dark colours (lenient criteria).
Download figure:
Standard image High-resolution imageFor wind energy potentials (figure 7), the S/N ratio threshold of >1 was fulfilled for scattered areas in mainly Sahel/Sahara, the Horn region, and southeastern Africa, growing substantially in extent from RCP4.5 to RCP8.5, whereas the threshold of >2 is met only in smaller regional subsets (column one). Minor differences were seen between RCPs and periods for the energy thresholds as basically all of the African continent north of approximately 15°N, and the Horn region and southwestern Africa fulfilled the lenient criteria (210 KW). The conservative criterion (364 KW) is increasingly met from RCP4.5 towards RCP8.5 (column two). Bias levels below 25% were seen in the Sahara region, whereas the 5% threshold was almost lacking and appeared largely unaffected between scenarios and periods (column three). The combined area, fulfilling all of the aforementioned lenient criteria, is mainly seen sparsely in the Sahara region, increasing in size related to period and RCP scenario, whereas the conservative criterion is unmet (column four).
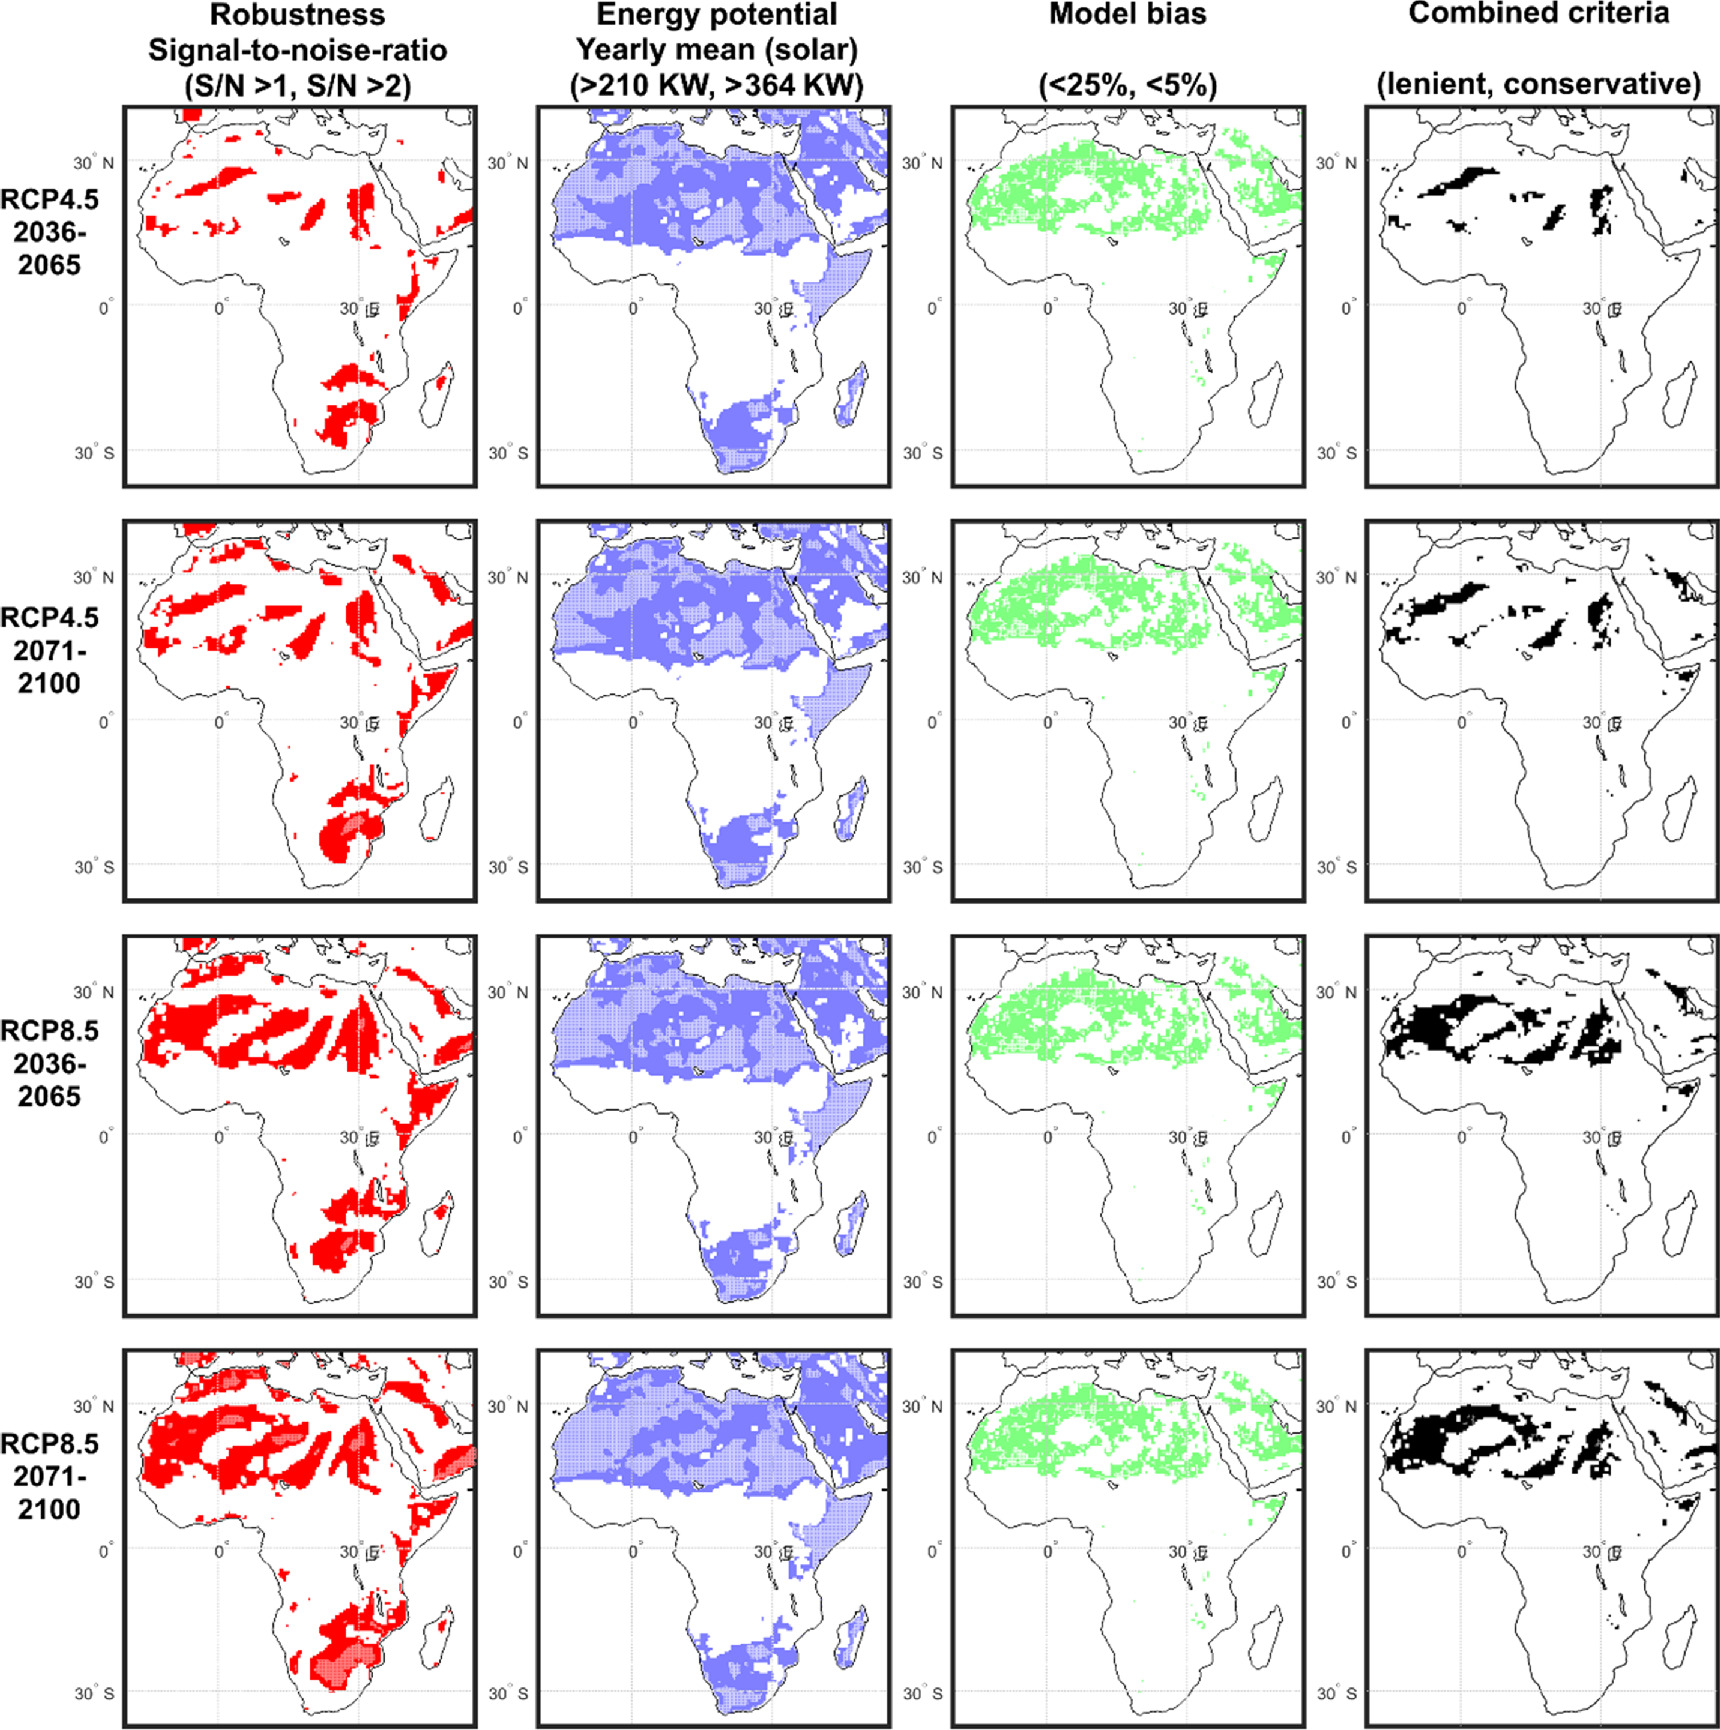
Figure 7. As for figure 6 but for wind energy potentials.
Download figure:
Standard image High-resolution imageFigure 8 depicts the spatial distribution of fulfilling all criteria in combination between solar PV and wind power potentials for both RCPs and periods and both the lenient and the conservative criteria. Generally, the conservative criteria are not met, primarily due to criteria no. 1 and 3 (table 1) for the wind power potentials, which are very sparsely represented. For the lenient criteria, the combined thresholds are met in a much-scattered distribution in a band across Sahara from approx. 15°N to 30°N, but also for smaller local areas at the African Horn and much higher for RCP8.5 than RCP4.5.
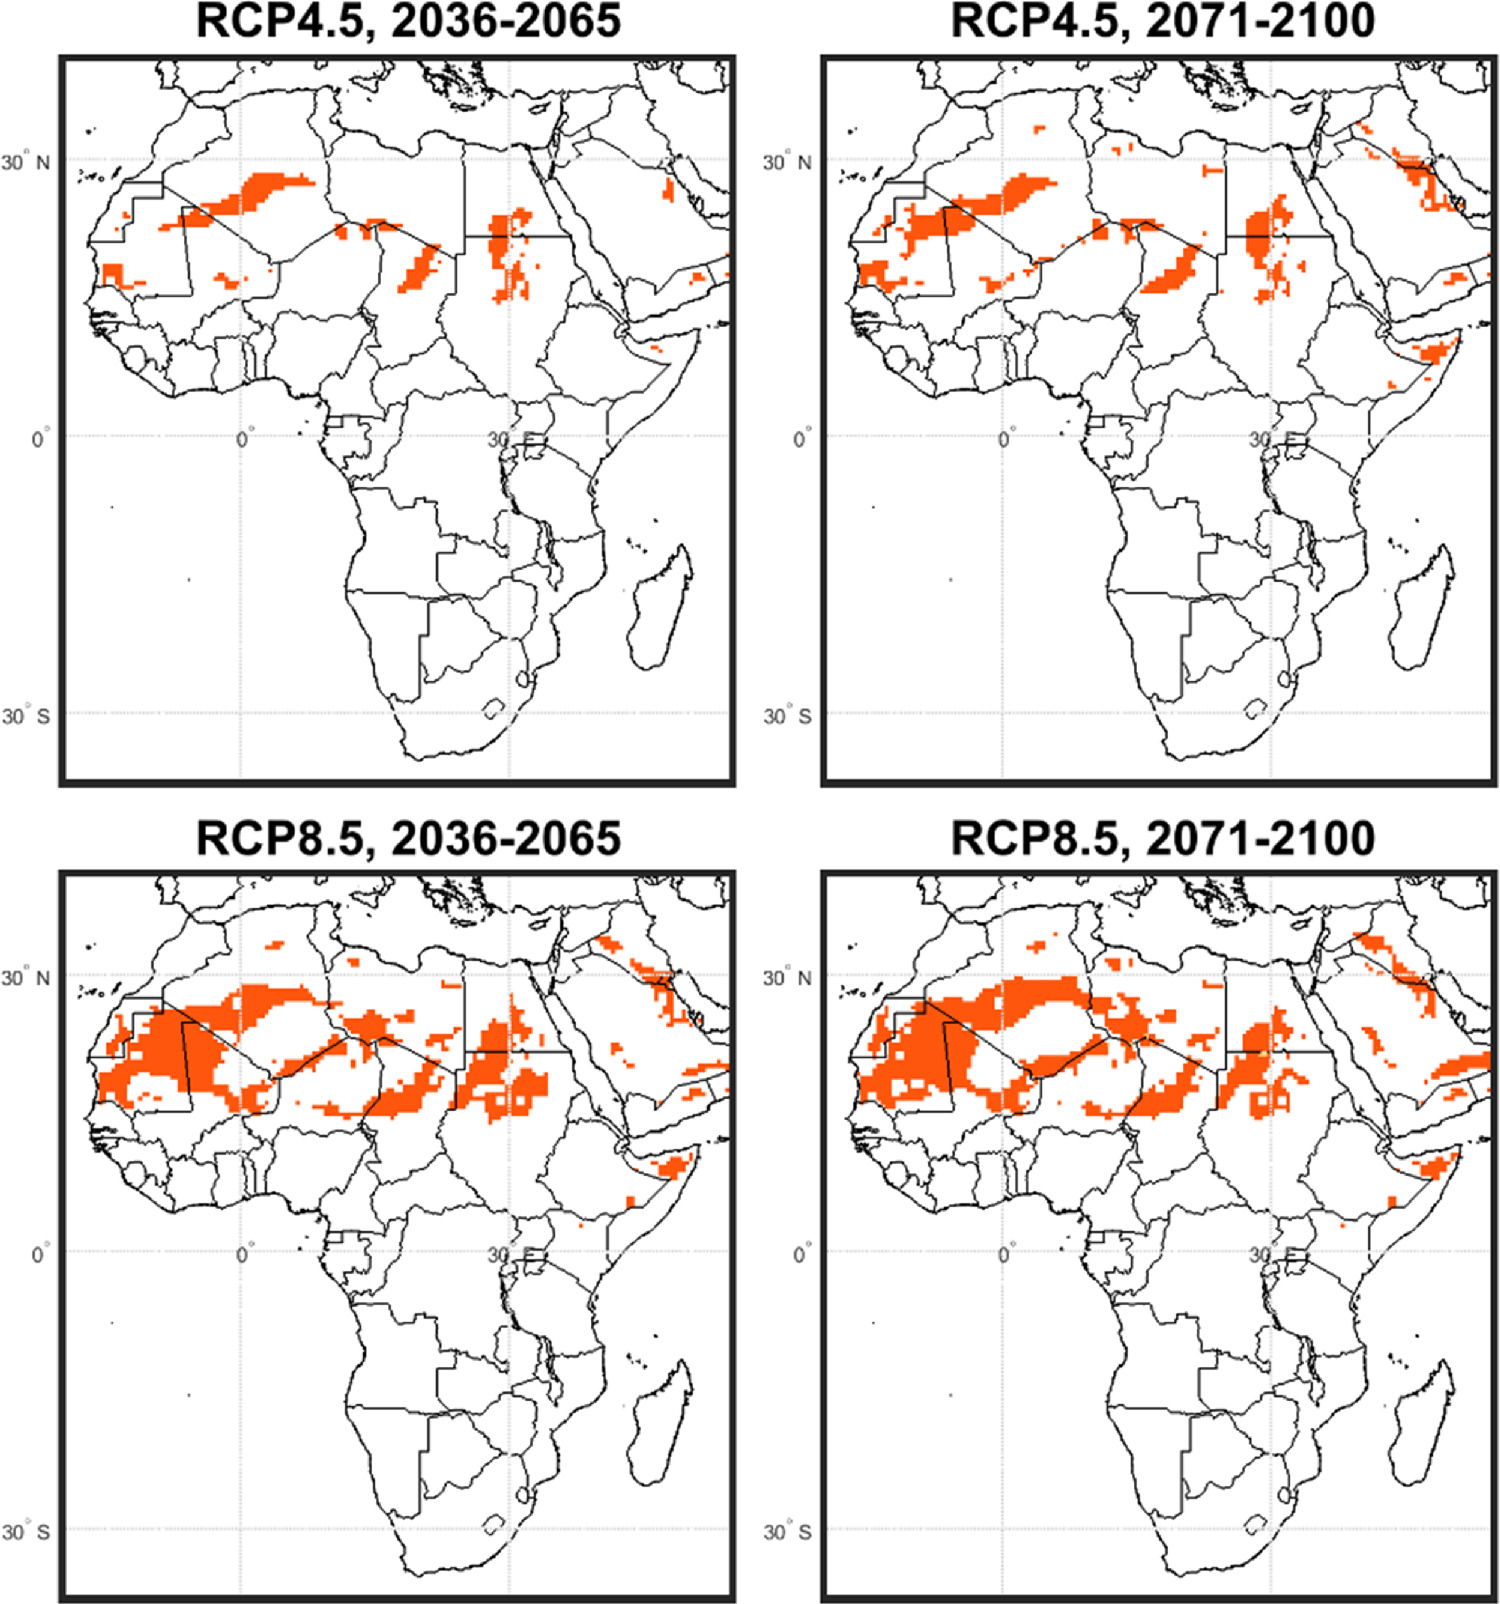
Figure 8. The combined criteria (see figures 6 and 7). Bright colours (conservative criteria) superimpose darker colours (lenient criteria).
Download figure:
Standard image High-resolution image3.4. Seasonal changes
For solar energy potential, the peaks vary in timing between the regions from fall (South), spring (Horn), winter (West) and summer (Sahara, Mediterranean and partly Congo). The general shape of the temporal patterns shows significant similarities between daily and monthly means. The highest minimum levels throughout the year are seen for the Sahara region, and a similar consistently high minimum level is seen for the Congo region, which on the other hand, shows the by far lowest levels with regards to annual means (figures 2 and 4). Regions such as West and Mediterranean, for the minimum daily levels, and supplemented by the South region for the monthly levels, show general inconsistent levels throughout the year.
The relative changes are generally highest for the daily values and are generally positive in the 0%–20% range for the RCP4.5 early period (2036–2065) compared to the RCP8.5 later period (2071–2100) where changes in the −30% to 5% range is seen, except for the Mediterranean region with values between 5%–20%. For the relative monthly changes, the difference between scenarios is smaller with RCP4.5 (2036–2065) levels around 0% and RCP8.5 (2071–2100) levels in the 0% to −10% range.
The temporal patterns for wind energy potentials show a much more dynamic pattern, compared to solar energy potentials, between regions and time of year, and to a lesser degree between RCP scenarios and future periods. As an example, some months exhibit low levels of daily minimum wind energy potentials during fall, winter and spring, such as October-May for the Congo region and September-March for the Mediterranean region, whereas the West region has its lowest levels from March-October. These patterns are somewhat mirrored in the monthly minima, although the Mediterranean region shows a skewed maximum occurrence three months earlier than the daily levels. The Horn region has, by far, the highest minimum wind energy potential, as also seen in figures 3 and 5, especially in June-September, followed by the regions of South and Sahara.
There is a general tendency for increasing daily minimum wind energy potentials, although some months with low absolute levels are sensitive to relative changes in daily minima. As an example, Sahara is projected to undergo increasing relative changes up to and beyond 50% for both scenarios and periods. The Horn region is an exception, with relative decreases from October-April/May. Between scenarios, there is a tendency for a more significant increase for RCP8.5 (2071–2100) in 6–12 months of the year over RCP4.5 (2036–2065) in for the South, Congo, Horn and Sahara regions. Compared to the daily minima, the monthly levels generally increase or balance around no-change.
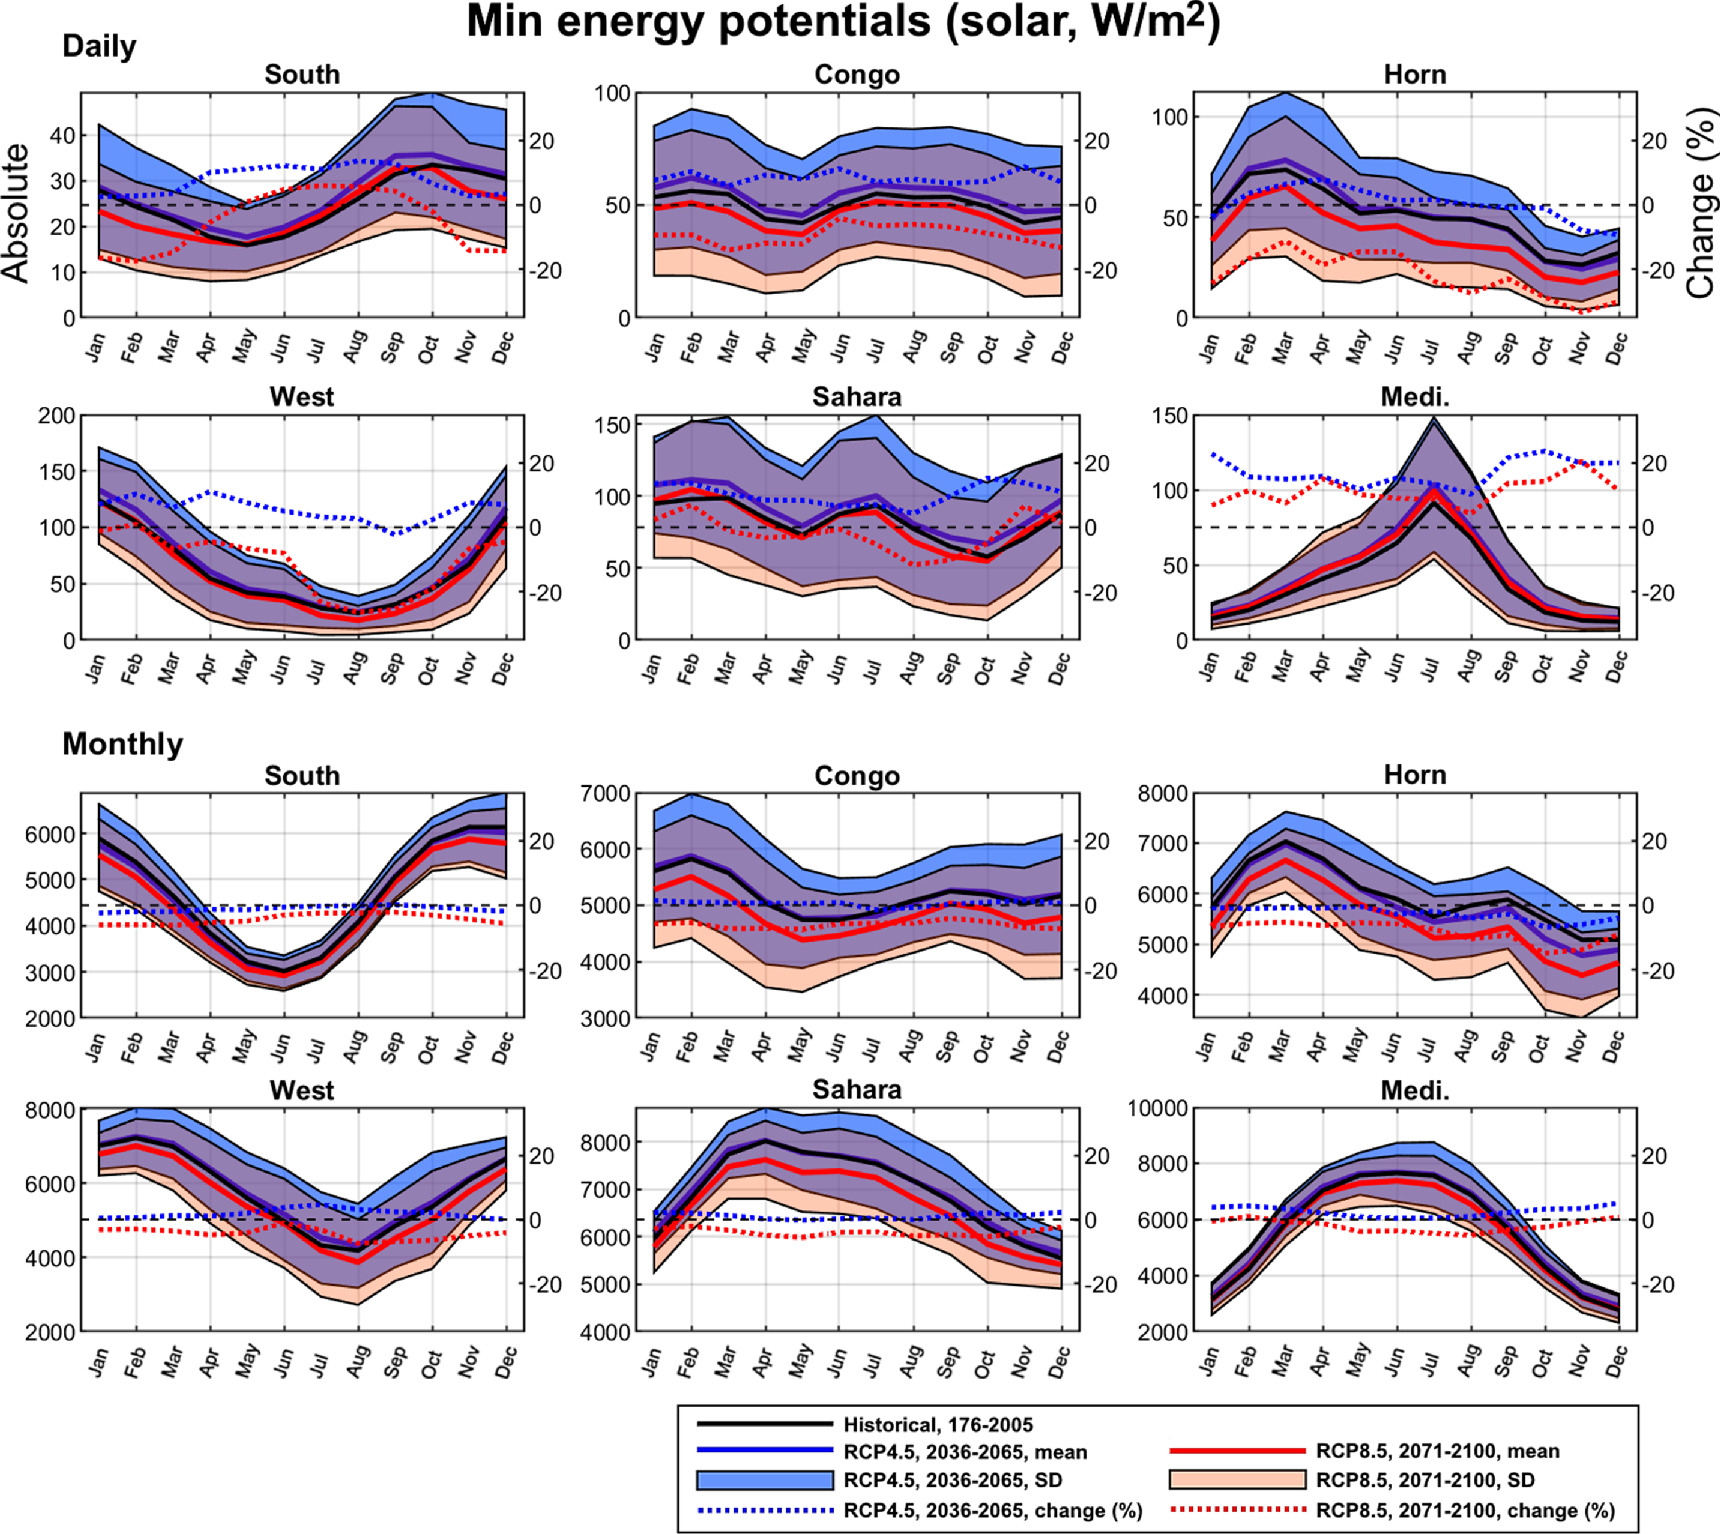
Figure 9. The daily mean (top six) and monthly mean (bottom six) minimum solar PV energy potentials for the RCM ensemble mean for RCP4.5 2036–2065 and RCP8.5 2071–2100, plotted with the standard deviation (SD, shaded area) for six selected regions covering the African continent (see figure 1). Notice the different left-hand y-axis between regions and daily/monthly depiction. The right y-axis is in %.
Download figure:
Standard image High-resolution image4. Discussion
This study presents the results of projected changes in solar and wind energy potentials over Africa towards 2100. The results generally show high potential all over Africa for solar power potentials. Only a few regions, such as the coastline region of Gabon and the Congo basin (figure 1), do not meet the levels of, e.g., Southern Italy and Greece (The World Bank Group 2021). In contrast, the Congo basin shows the most stable minimum conditions of all regions (figure 9) and does not fall below approx. 45 W m−2 (daily) and 4500 W m−2 (monthly). Also, the Horn, South, and Sahara regions show reasonably stable minimum daily mean conditions for solar power potentials, which could support local energy storage solutions. Minimum wind energy potentials appear much more volatile, and only the Sahara region shows stable daily levels throughout the year. In contrast, monthly minimum levels also appear above a certain threshold of approximately 4 KW for the South and Mediterranean Regions (figure 10).
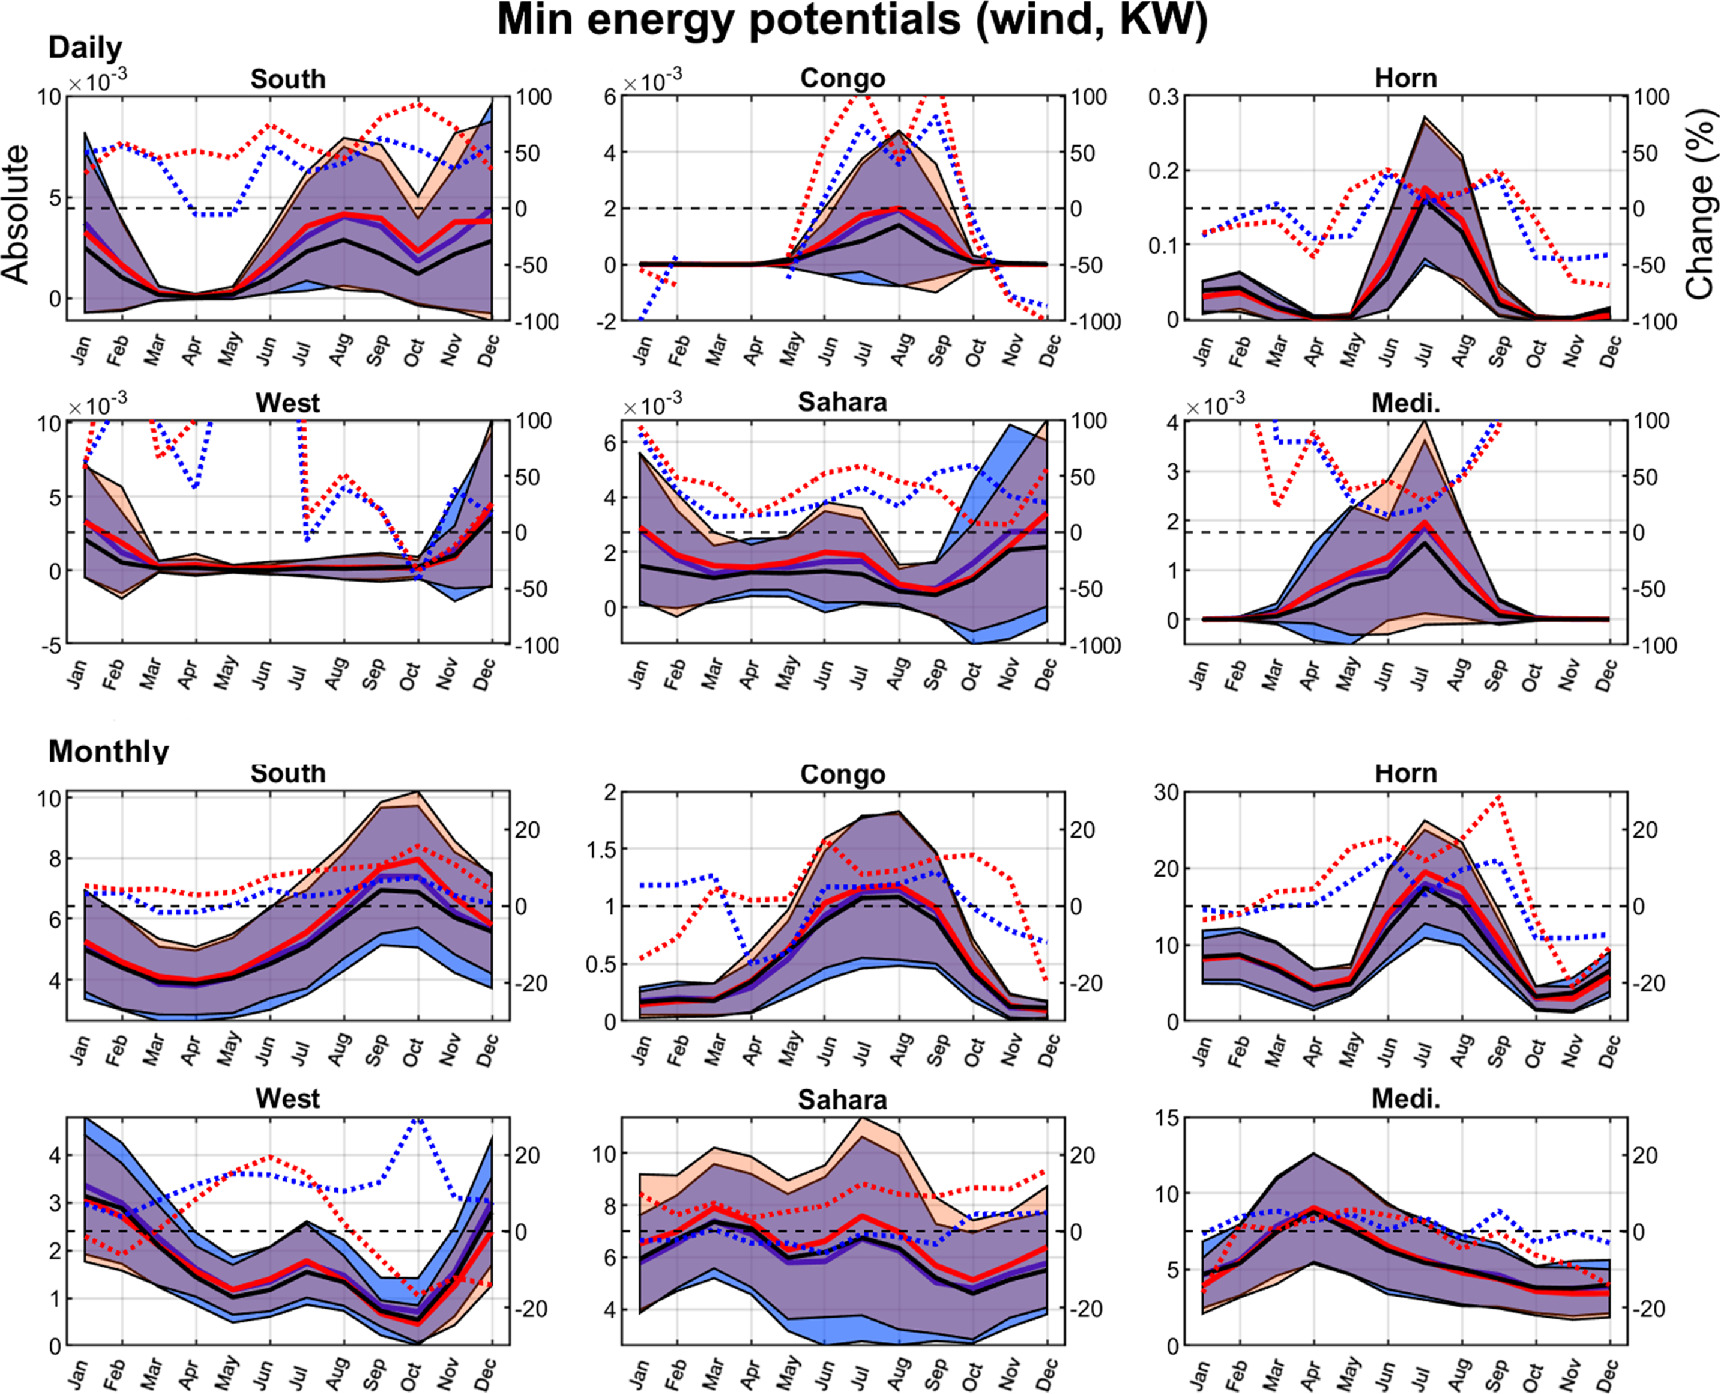
Figure 10. The daily (top six) and monthly (bottom six) minimum wind energy potentials for the RCM ensemble mean for RCP4.5 2036–2065 and RCP8.5 2071–2100, plotted with the standard deviation (SD, shaded area) for six selected regions covering the African continent (see figure 1). Notice the different left-hand y-axis between regions and daily/monthly depiction. The right y-axis is in % and the legend corresponds to figure 9.
Download figure:
Standard image High-resolution imageCentralised implementations of future African energy grids with a high share of renewables can use solar and wind energy hotspots, as found in this study, to guide localisation aspects regarding production and transmission in policy planning (Ouedraogo 2019). In light of uncertain climate change trajectories, strategies for individuals or smaller administrative groupings or villages can also benefit from robustness measures as provided within this study (Møller et al 2017). Such strategies would optimally be supported with the addition of energy modelling tools such as REVUB (Sterl et al 2020), The Electricity Model Base for Africa (TEMBA), based on the OSeMOSYS model (Taliotis et al 2016), the LEAP model (Ouedraogo 2017), water-energy-nexus-(food) models, such as CLEWS (Ramos et al 2021), or others. With this study, such energy models can implement localisation aspects for solar PV and wind combined and under the influence of climate change as opposed to using, e.g. the global Solar- (The World Bank Group 2021) and Wind- Atlas tools (DTU Wind Energy 2021) where climate change is currently not implemented. Further, the analytical approach based on ensembles, as is also the basis for the entire IPCC protocol (IPCC 2021), entails added trust with an increasing number of ensemble members and therefore, having employed the entire model basis, higher robustness cannot be reached at the theoretical level.
A high correlation between solar PV and wind power potentials and the driving RCM is generally seen, whereas the driving GCM seems to be of minor influence. This influence on energy potentials stems from the direct output of individual climate variables from the RCM models, of which wind energy potentials derive from the processing of wind speeds alone (sfcwind in CORDEX terminology). In contrast, solar energy potentials are derived from a combination of surface downwelling shortwave radiation, air temperature and wind speed (rsds, tas and sfcwind in CORDEX terminology). These results are in line with, e.g., (Sawadogo et al 2020), where minimal variation between GCMs is seen, running a single RCM for the variables of solar irradiance, total cloud cover, air temperature and wind speed over Africa. However, some GCMs stand out with distinct differences compared to the general trend in (Akinsanola et al 2021) where wind speeds are assessed over Africa, which is much in line with findings in the present study showing the most significant biases for wind energy potentials. In (Christensen and Kjellström 2020), a more substantial influence from the driving GCM was seen over the RCMs used for dynamical downscaling among present-day and future wind speeds but with significant spatial differences assessed over Europe. The influence of the combination of RCMs/GCMs emphasises the need to use multi-model ensemble estimates for energy planning purposes to obtain uncertainty ranges and avoid local to regional over- or underestimations due to limited model selection. Wind speeds and associated wind energy stand out as the measure with the highest degree of uncertainty. Nevertheless, the areas with the lowest uncertainty also have a fair spatial overlap with the areas of high absolute potentials and, therefore, the current and future wind potential of especially the Sahara region and the African Horn regions stand out.
Recent research suggests the RCP8.5 scenario, often called business-as-usual with no significant GHG reduction enforcing towards 2100, to be unrealistic and instead points toward an SSP3–7.0 forcing representing a 'no-policy' scenario (Hausfather and Peters 2020). For this study, however, requiring numerous RCM/CM combinations to assess robustness metrics, only the RCP4.5 and RCP8.5 scenarios were relevant. Any speculations on the outcome of a similar multi-model analysis, had they been available, using, e.g., the SSP3–7.0 scenario, would suggest results between RCP4.5 and RCP8.5 due to the proper scaling with timeframe and RCP as seen in figures 4 and 5. In quantitative terms, such scaling would imply smaller reductions in solar PV potentials towards the end of the century and a reduced increase in wind energy potentials.
One limitation of this study, was the lack of investigating offshore wind energy potentials, which was outside the scope and which therefore is a limitation in terms of providing a coherent planning background in adjoining demands and implementation opportunities. Still, coastal regions adjacent to land-based grid cells with prospects will provide additional possibilities, such as outside the areas of West Africa (West Sahara, Mauritania and Senegal), Somalia, South Africa and Madagascar (figures 3 and A.5–A.8), as also indicated in (Elsner 2019). Another key limitation is the lack of demand side inclusion, including their spatial distribution and temporal projections of these. The costs and technical-political feasablities of implementation have also been disregarded in this study. Further, while reflecting current state-of-the-art, more current SSP and RCP scenarios from the IPCC assessemt report no. 6 (IPCC 2021) are currently being implemented into global GCM CMIP runs, which in the coming years will feed into a new generation of RCM runs.
Prospects for further research include, e.g. implementing the results in energy systems modelling where geographically varying renewable energy potentials can be used for designing and analysing various energy grid trajectories concerning supply, demand, transmission and costs, which holds prospects also for cross-scale policy work, environmental aspects among others. The sub-annual and regional results also have relevance to planning as dynamic supply/demand patterns should be carefully implemented.
Despite limitations and perspectives for future research, the findings of this study, showing vast differences potentials across energy conversion source, scenario and timeline, highlight implications that could vastly affect the viability of implementation and that robustness aspects need to be accounted for.
5. Summary and conclusions
This study assesses the current and future solar PV and wind projected power potentials and their historical robustness for the African continent at a resolution of 50 km using the full ensemble range of CORDEX RCM/GCM model combinations for RCP4.5 and RCP8.5 for mid- and end-century periods.
For the future projections on renewable energy potentials, solar PV energy potentials show a general decreasing trend from mid- towards the end-century, primarily for RCP8.5. For this scenario, a decrease greater than 5% is seen for more than half of the African continent. On the other hand, wind energy projections have a general increasing trend towards the end of the century, especially for RCP8.5. A certain share of the differences between RCP4.5 and RCP8.5 is likely related to the availability of RCM/GCM combinations for each scenario. With regards to model influence, high dependency between the driving RCM and the resulting current and future energy potentials of both renewable energy technologies (solar and wind) is seen, whereas the driving GCM was of minor influence.
Regarding the renewable energy planning criteria metrics, for solar PV potentials the most significant climate change robustness is seen across Sahara and, to some degree, Sahel (criterion no. 1), absolute potentials alone are high across large parts of the African continent (criterion no. 2) with a general low historical model bias (criterion no. 3). For wind energy, lower general climate change robustness metrics (criterion no. 1) and larger historical biases (criterion no. 3) are seen compared to Solar PV while absolute potentials (criterion no. 2) are high across the Mediterranean region, Sahara, Sahel, the Horn region and Southern Africa. Hence, individual models within the multi-model ensemble tend to agree more on solar PV than wind energy, but vast potentials are seen for both energy conversion technologies. Fulfilling the combined metric (criterion no. 4), locations where both solar and wind energy projections are favourable regarding high potentials and model reliability, are seen mainly in a scattered band across Sahara and the Horn region and towards the Atlantic and, to some degree, the Mediterranean coastlines. RCP8.5 sees a much higher fulfilment of all metrics combined across all criteria over RCP4.5.
Minimum levels of daily and monthly mean solar PV and wind energy potentials show vast differences between African regions and during the year within single regions. Four of the six regions at this aggregated regional scale seem more robust for minimum daily mean solar PV potentials (South, Congo, Horn and Sahara) than for the West and Mediterranean regions. In contrast, all regions have low or negligible levels of daily minimum wind energy potentials during the year. At the monthly level, energy potentials are less vulnerable to the variability seen at the daily scale, and some regions even show monthly temporal patterns where the two energy conversion technologies supplement each other, such as the Horn region.
Acknowledgments
Research funding was provided by project CIREG project (Climate Information for Integrated Renewable Electricity Generation) - a part of ERA4CS/ERA-NET co-fund action by JPI Climate, funded by BMBF (Germany), FORMAS (Sweden), BELSPO (Belgium) and Innovationsfonden (Denmark) with co-funding from the European Union's Horizon2020 Framework Program (Grant 690462) and the German Research Foundation (DFG) (Project number 409670289).
Data availability statement
All data that support the findings of this study are included within the article (and any supplementary files) or can be provided by contact to the corresponding author.
Author contributions
Morten Andreas Dahl Larsen: Conceptualization, Methodology, Data processing, Formal analysis, Investigation, Writing- Original draft preparation, Writing- Reviewing and Editing, Visualization. Jean Bournhonesque: Data processing. Stefan Liersch: Project administration, Funding acquisition. Wim Thiery, Kirsten Halsnæs, Fred F Hattermann, Holger Hoff, Seyni Salack, Stefan Liersch and Ademola Adenle: review and editing.
Conflict of interests statement
The authors declare no conflicts of interests.
Ethical statement
The authors declare no ethical issues related to the creation of this manuscript.
Appendices
A.1. List of acronyms
Table A.1. Table of RCM/GCM model combinations used in this study based on the CORDEX data repository (Giorgi and Gutowski 2015) for the historical and RCP4.5/RCP8.5 future projections.
| GCM | CNRM-CM5 | HADGEM2 | MPI-ESM | CANESM2 | CNRM-CM5 | CSIRO | GFDL | HADGEM2 | IPSL | MIROC5 | MPI-ESM | NORESM1 | HADGEM2 | IPSL | MIROC5 | MPI-ESM | EC-EARTH | EC-EARTH | HADGEM2 | CANESM2 | MPI-ESM |
|---|---|---|---|---|---|---|---|---|---|---|---|---|---|---|---|---|---|---|---|---|---|
| RCM | CCLM4 | CCLM4 | CCLM4 | RCA4 | RCA4 | RCA4 | RCA4 | RCA4 | RCA4 | RCA4 | RCA4 | RCA4 | REMO2009 | REMO2009 | REMO2009 | REMO2009 | HIRHAM | RACMO22 | RACMO22 | UQAM | UQAM |
| Hist | x | x | x | x | x | x | x | x | x | x | x | x | x | x | x | x | x | x | x | x | x |
| RCP4.5 | x | x | x | x | x | x | x | x | x | x | x | x | x | x | x | x | x | x | |||
| RCP8.5 | x | x | x | x | x | x | x | x | x | x | x | x | x | x | x | x | x | x | x |
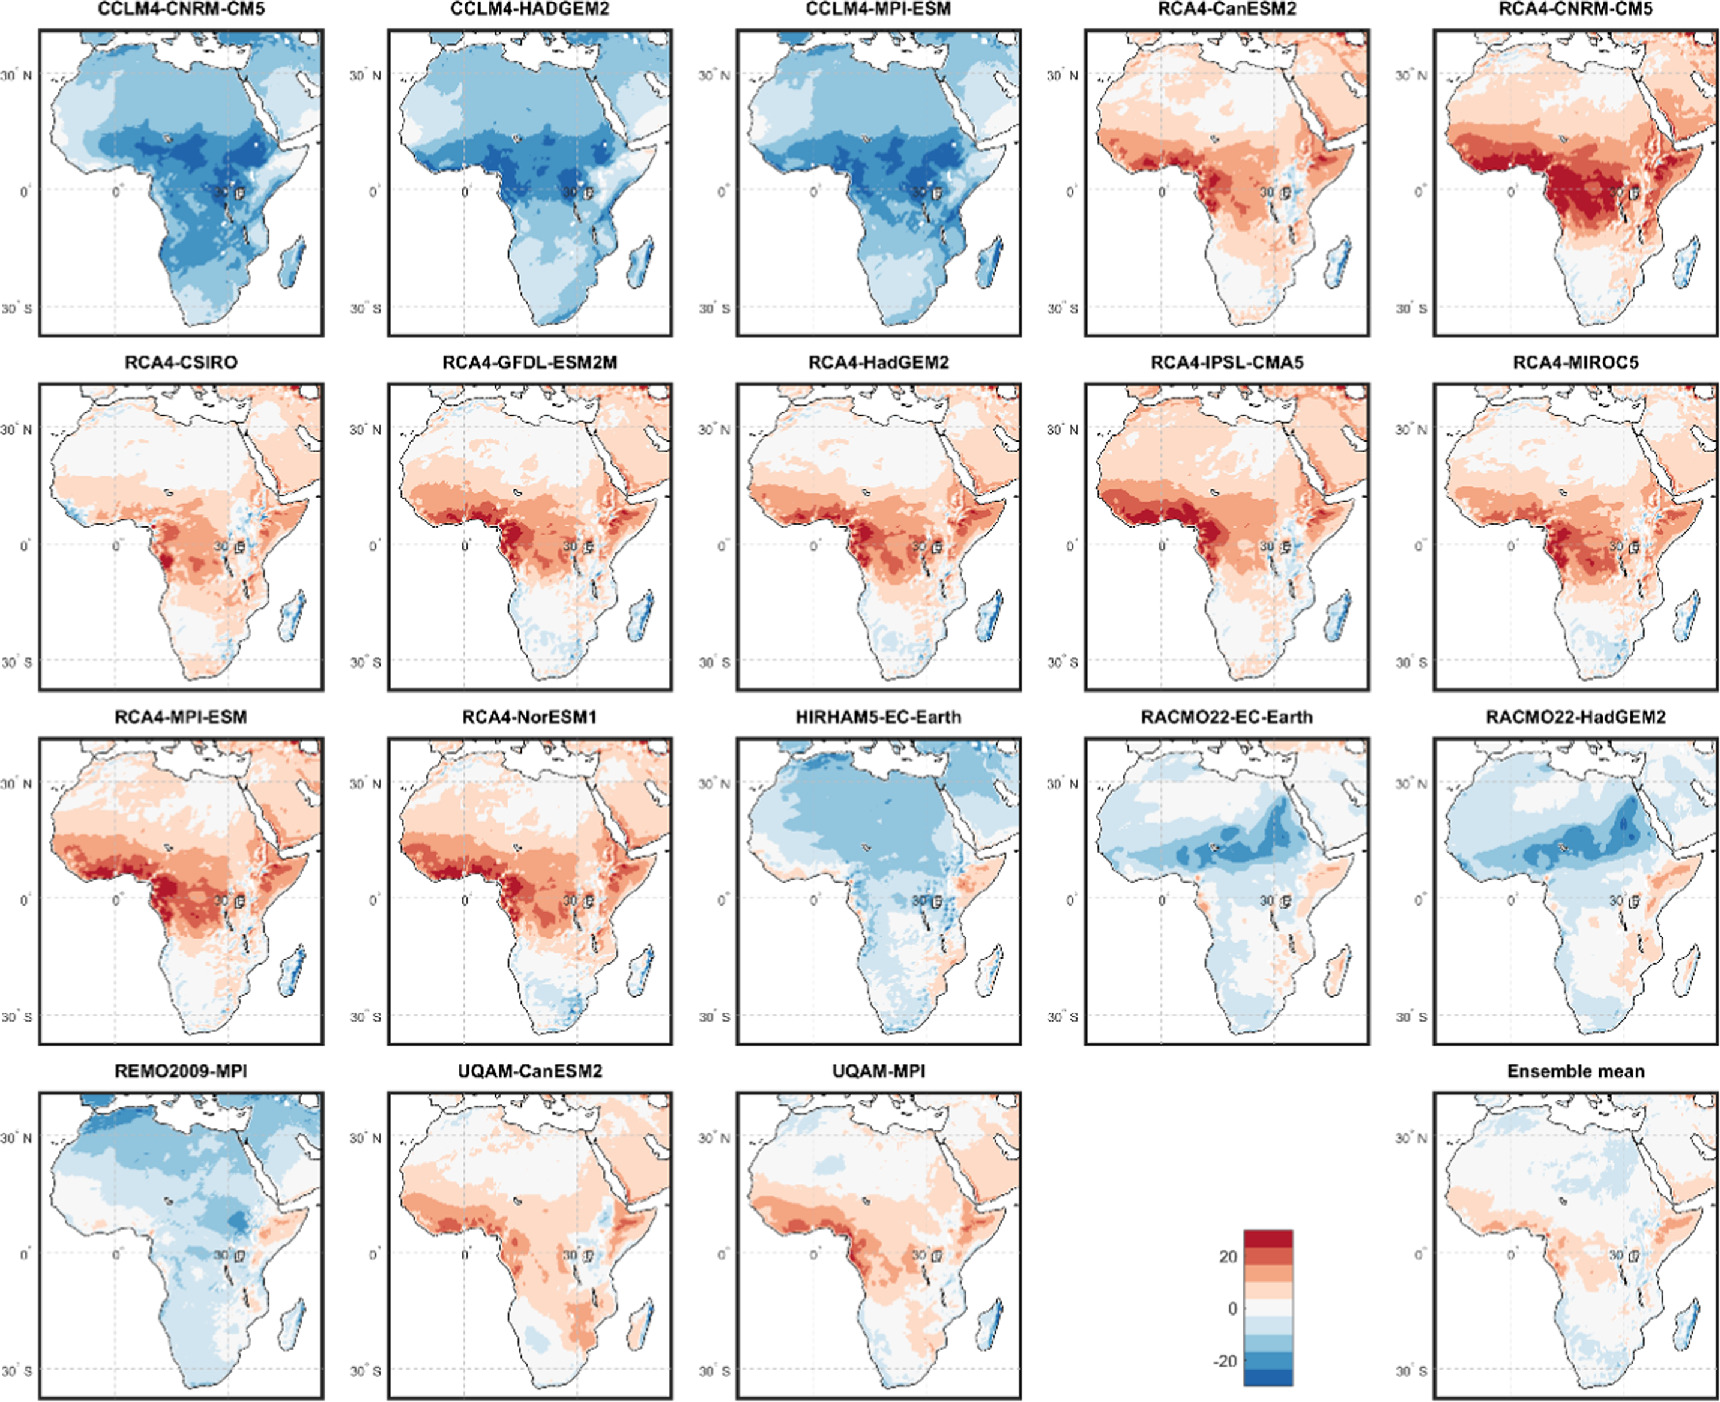
Figure A.1. Relative RCP4.5 2036–2065 solar energy potential biases against ERA5 for individual RCM models and the multi-model ensemble mean biases (%).
Download figure:
Standard image High-resolution image
Figure A.2. Relative RCP4.5 2071–2100 solar energy potential biases against ERA5 for individual RCM models and the multi-model ensemble mean biases (%).
Download figure:
Standard image High-resolution image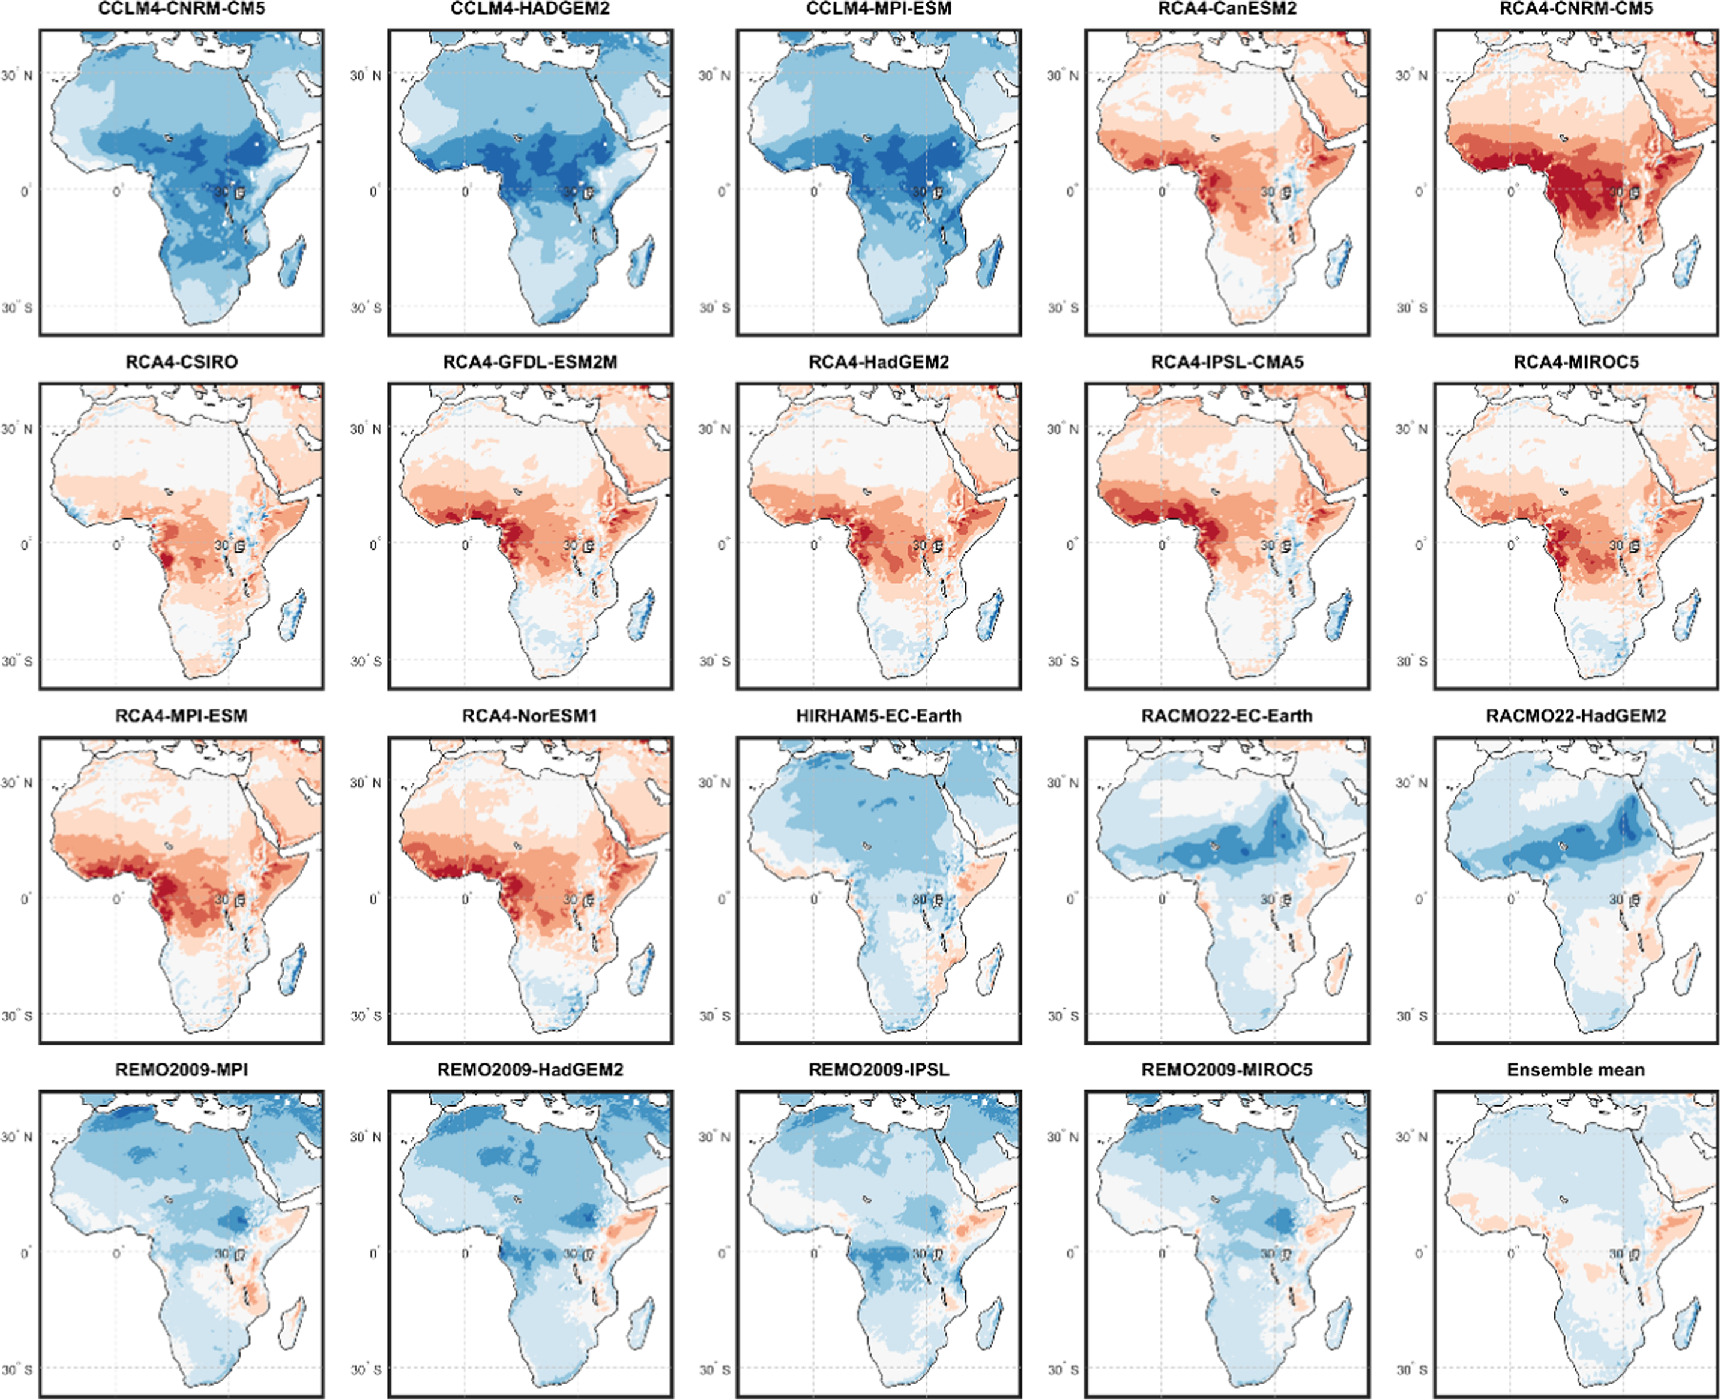
Figure A.3. Relative RCP8.5 2036–2065 solar energy potential biases against ERA5 for individual RCM models and the multi-model ensemble mean biases (%).
Download figure:
Standard image High-resolution image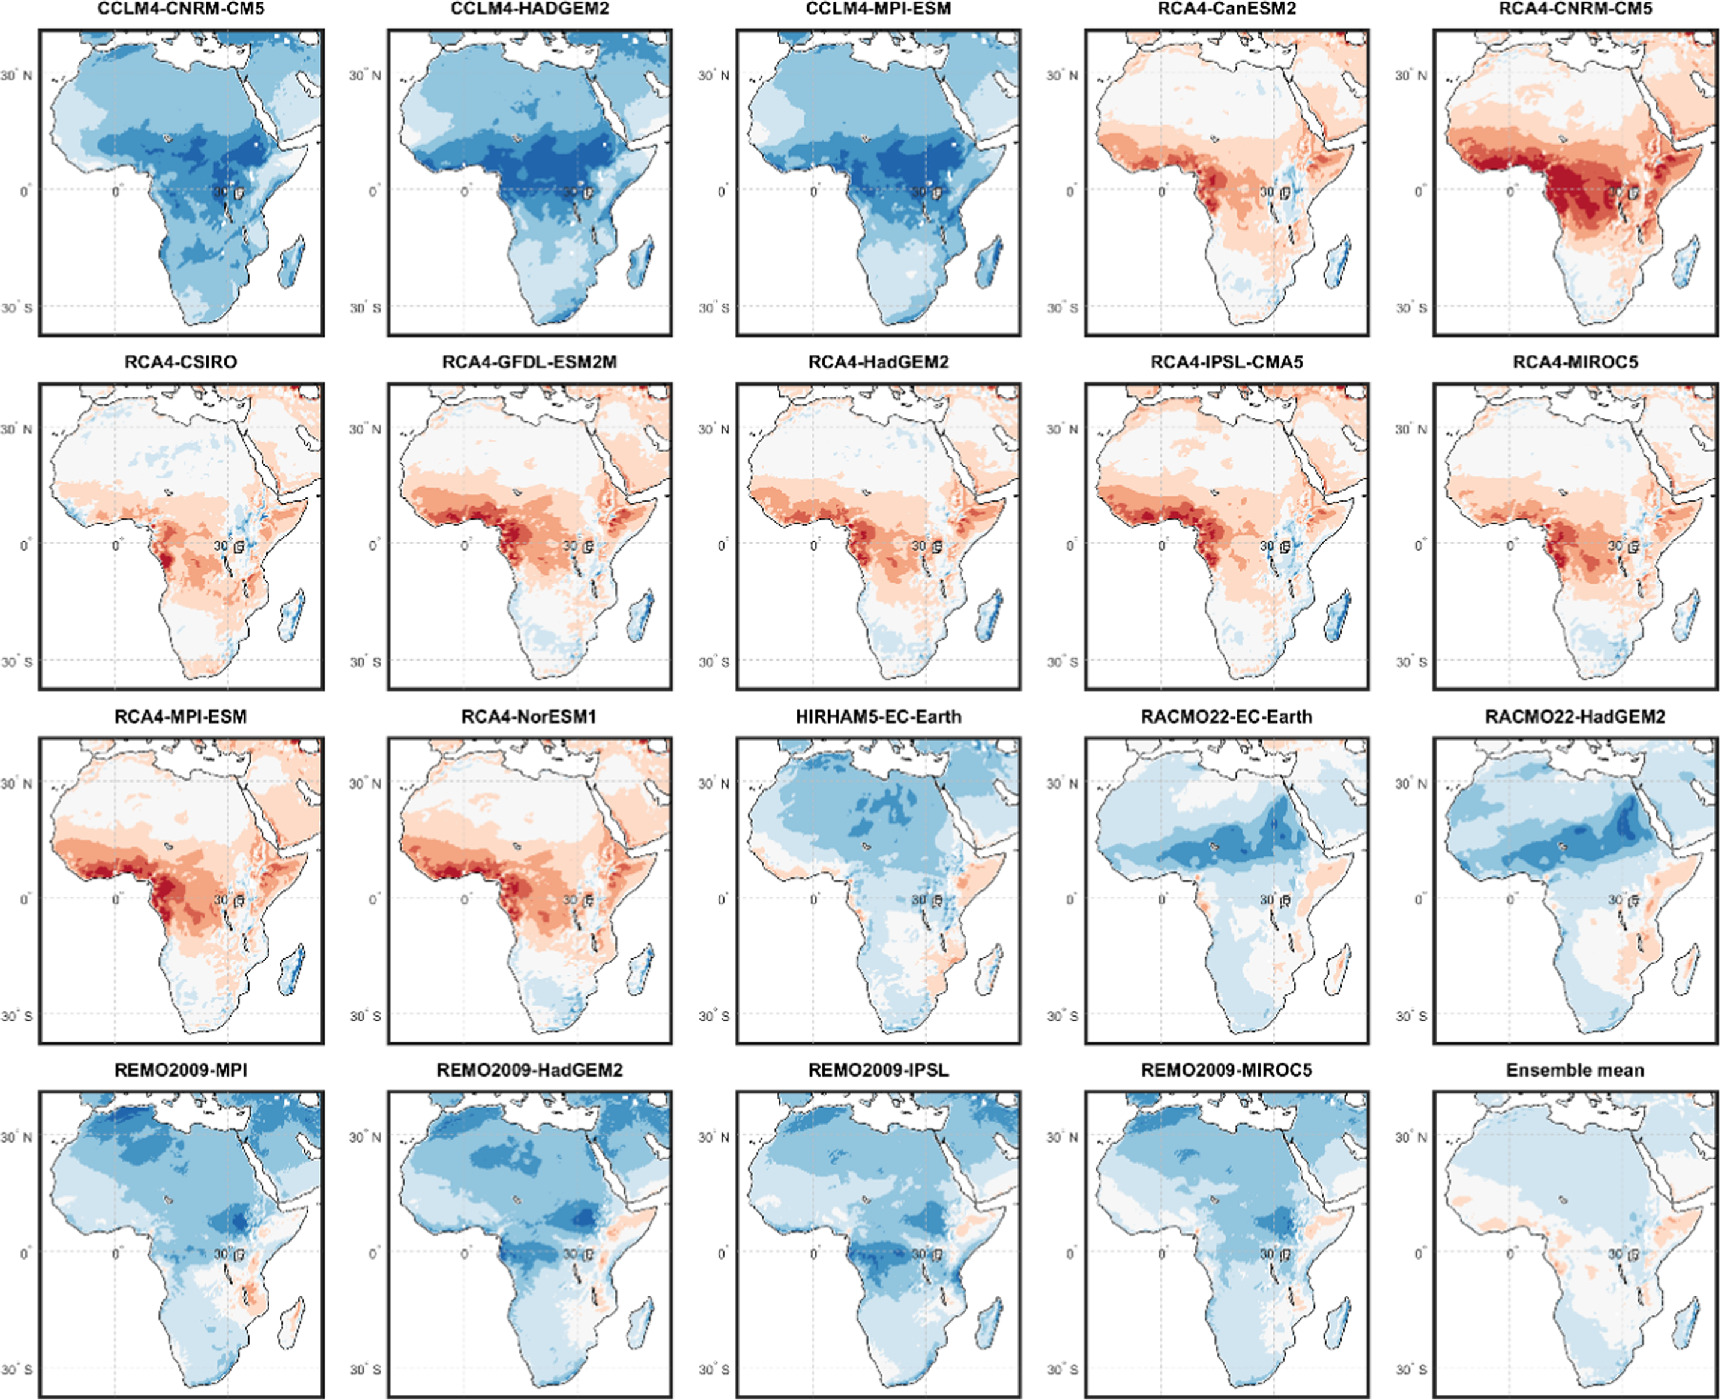
Figure A.4. Relative RCP8.5 2071–2100 solar energy potential biases against ERA5 for individual RCM models and the multi-model ensemble mean biases (%).
Download figure:
Standard image High-resolution image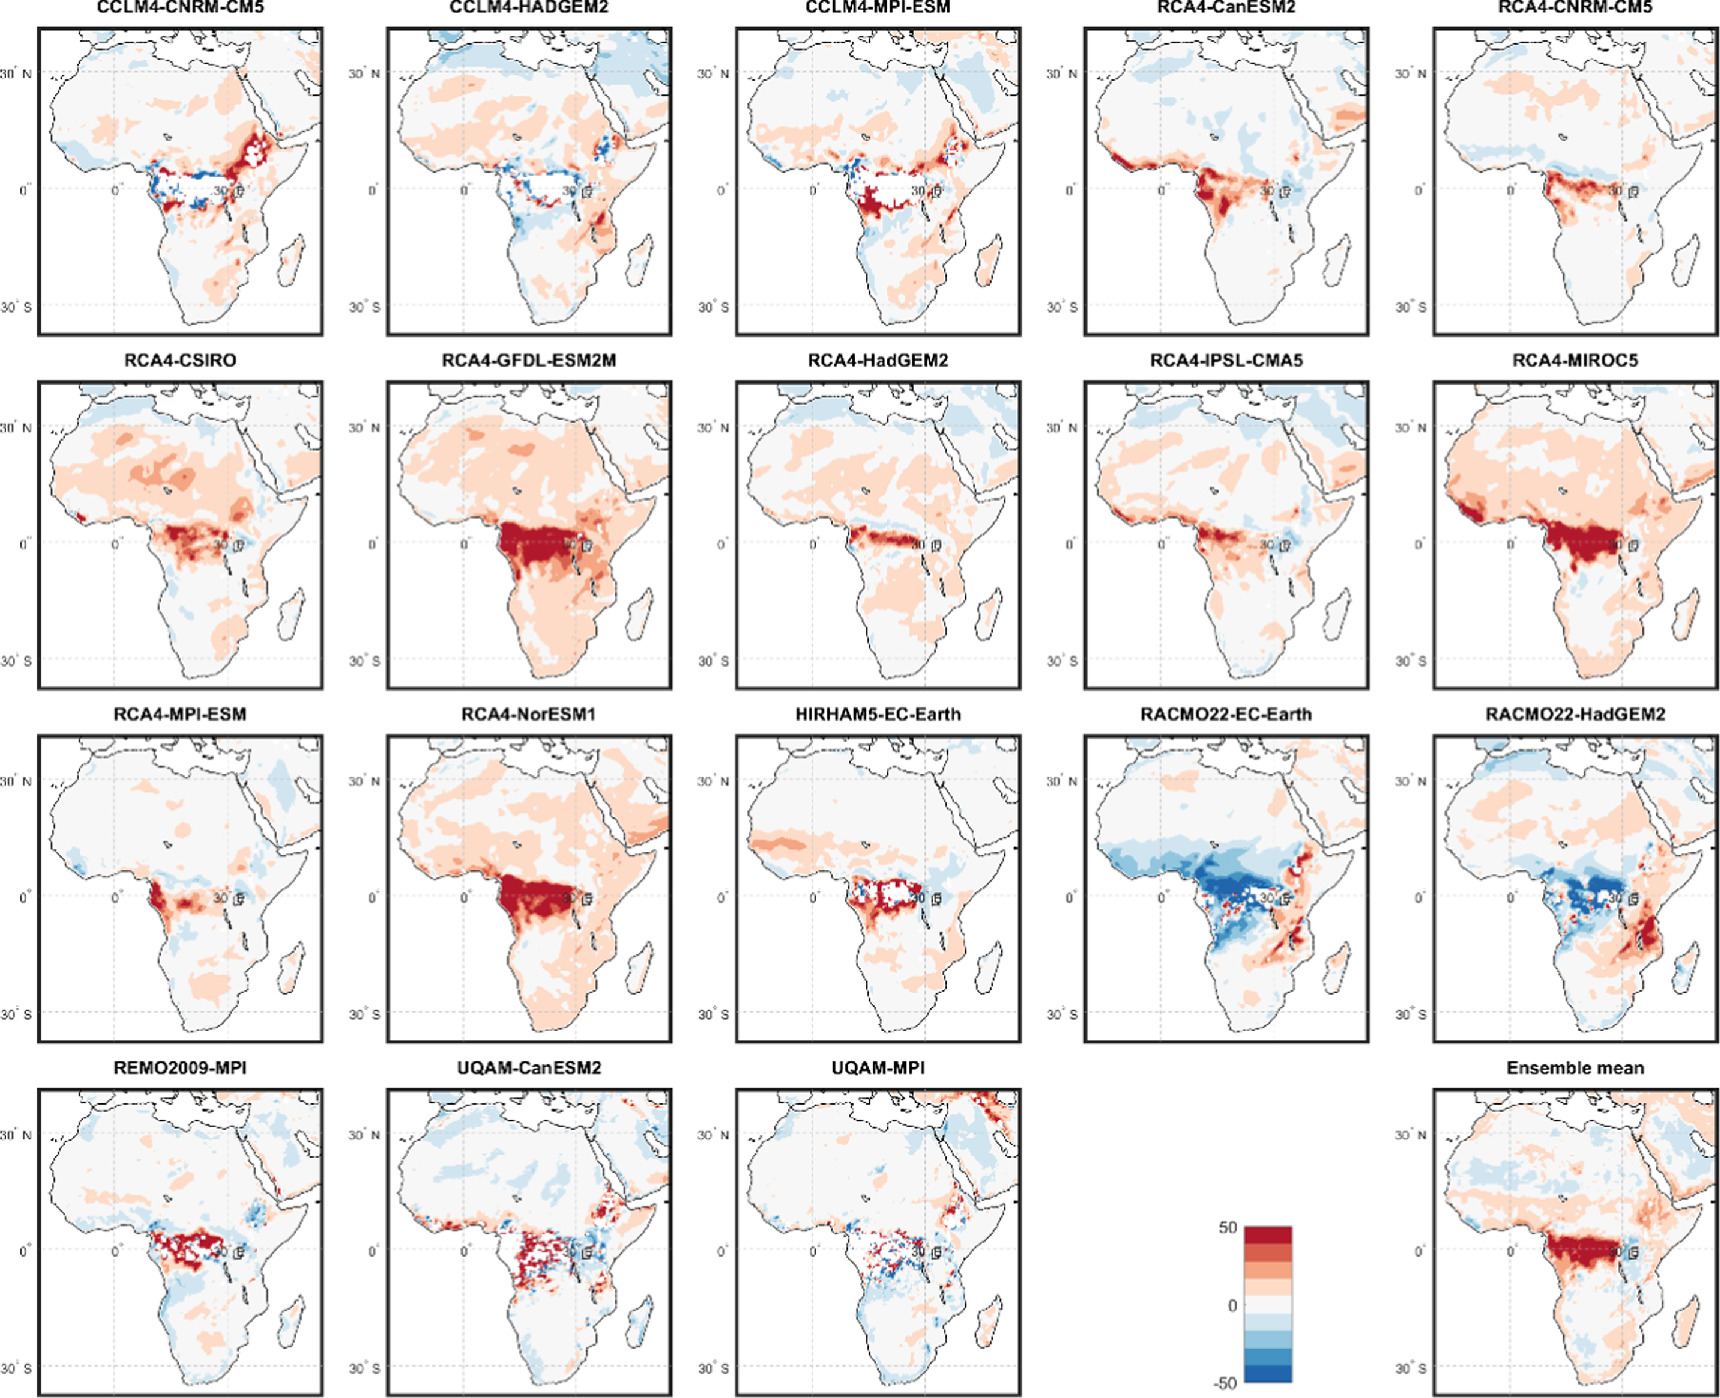
Figure A.5. Relative RCP4.5 2036–2065 wind energy potential biases against ERA5 for individual RCM models and the multi-model ensemble mean biases (%).
Download figure:
Standard image High-resolution image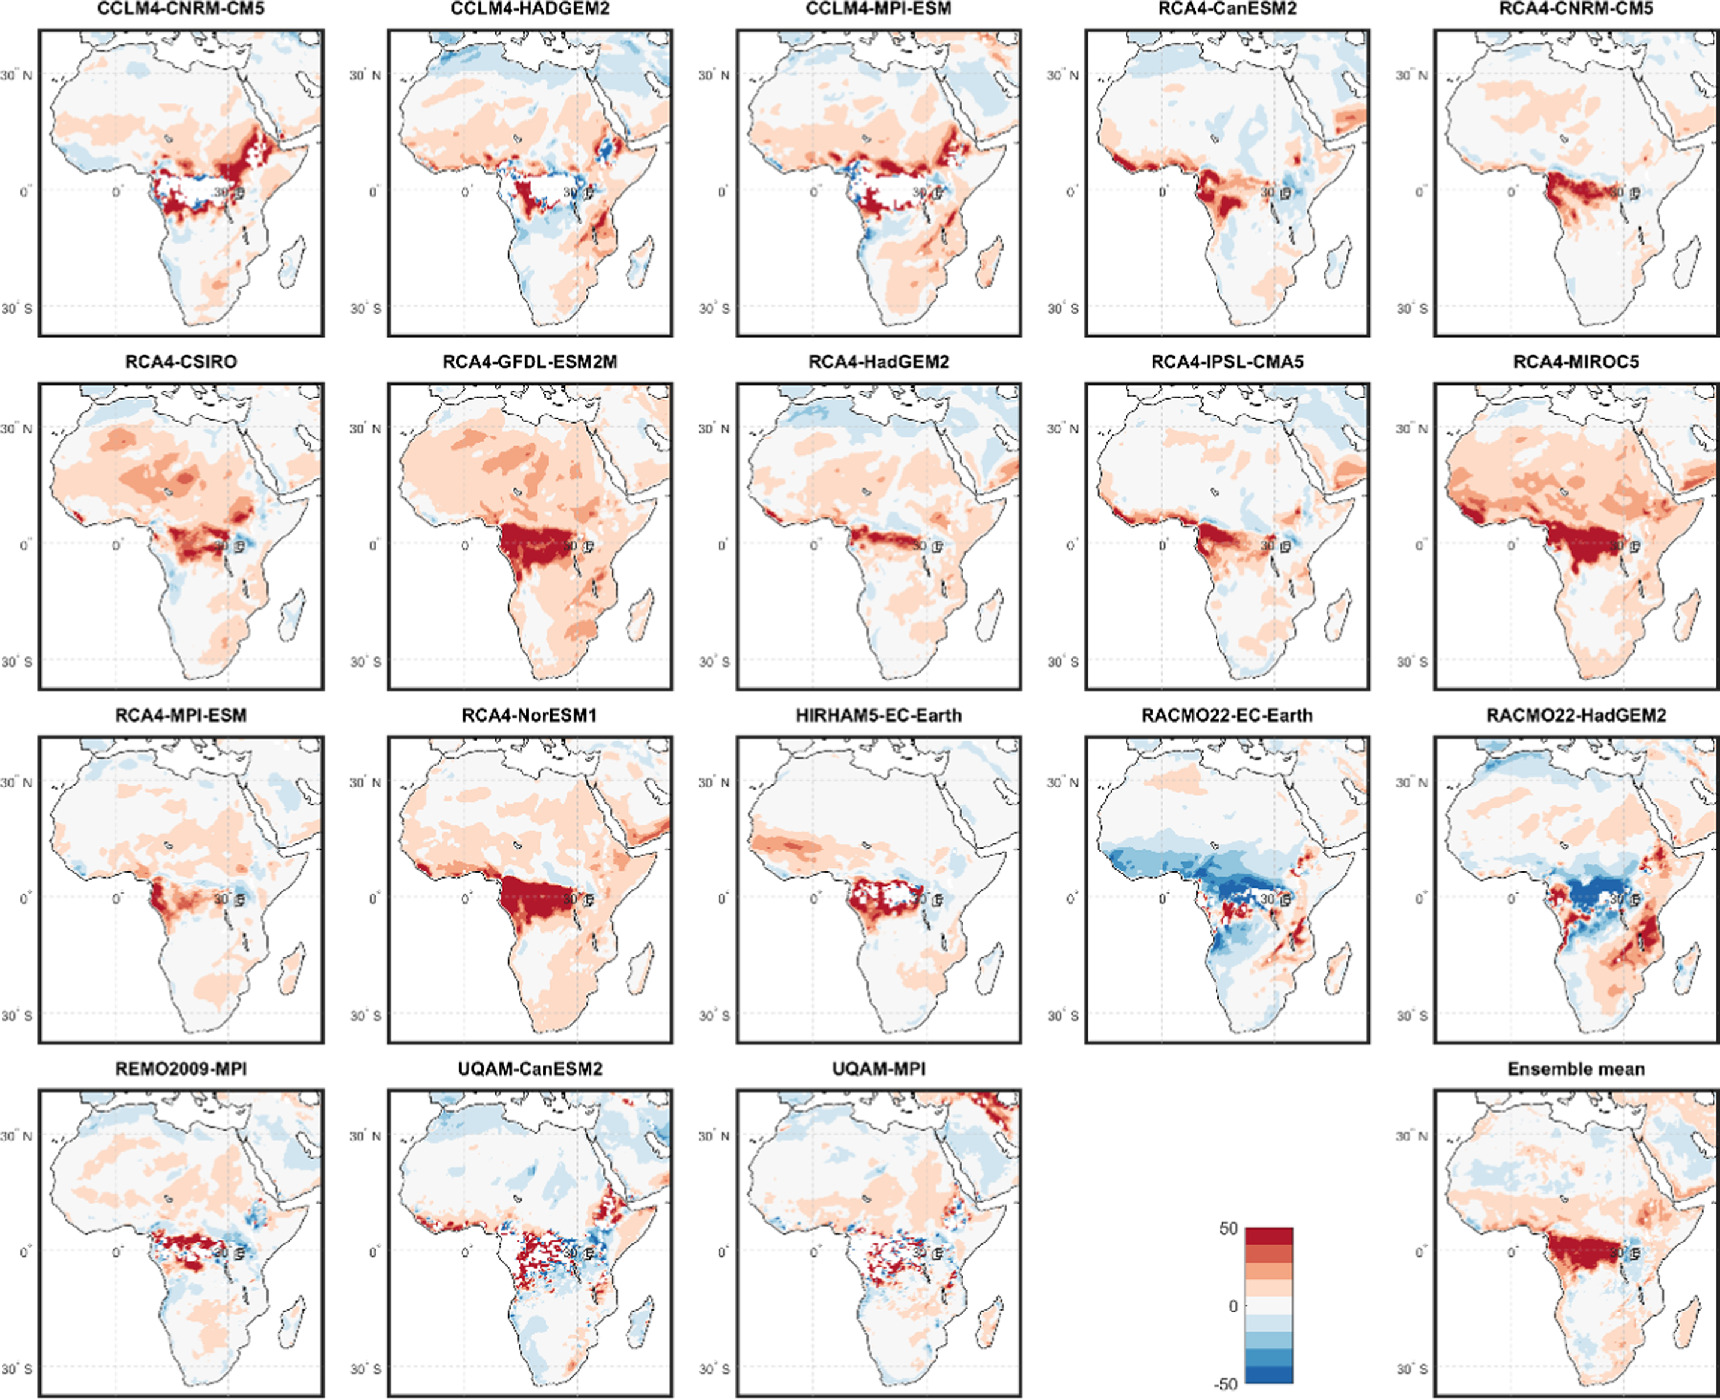
Figure A.6. Relative RCP4.5 2065–2100 wind energy potential biases against ERA5 for individual RCM models and the multi-model ensemble mean biases (%).
Download figure:
Standard image High-resolution image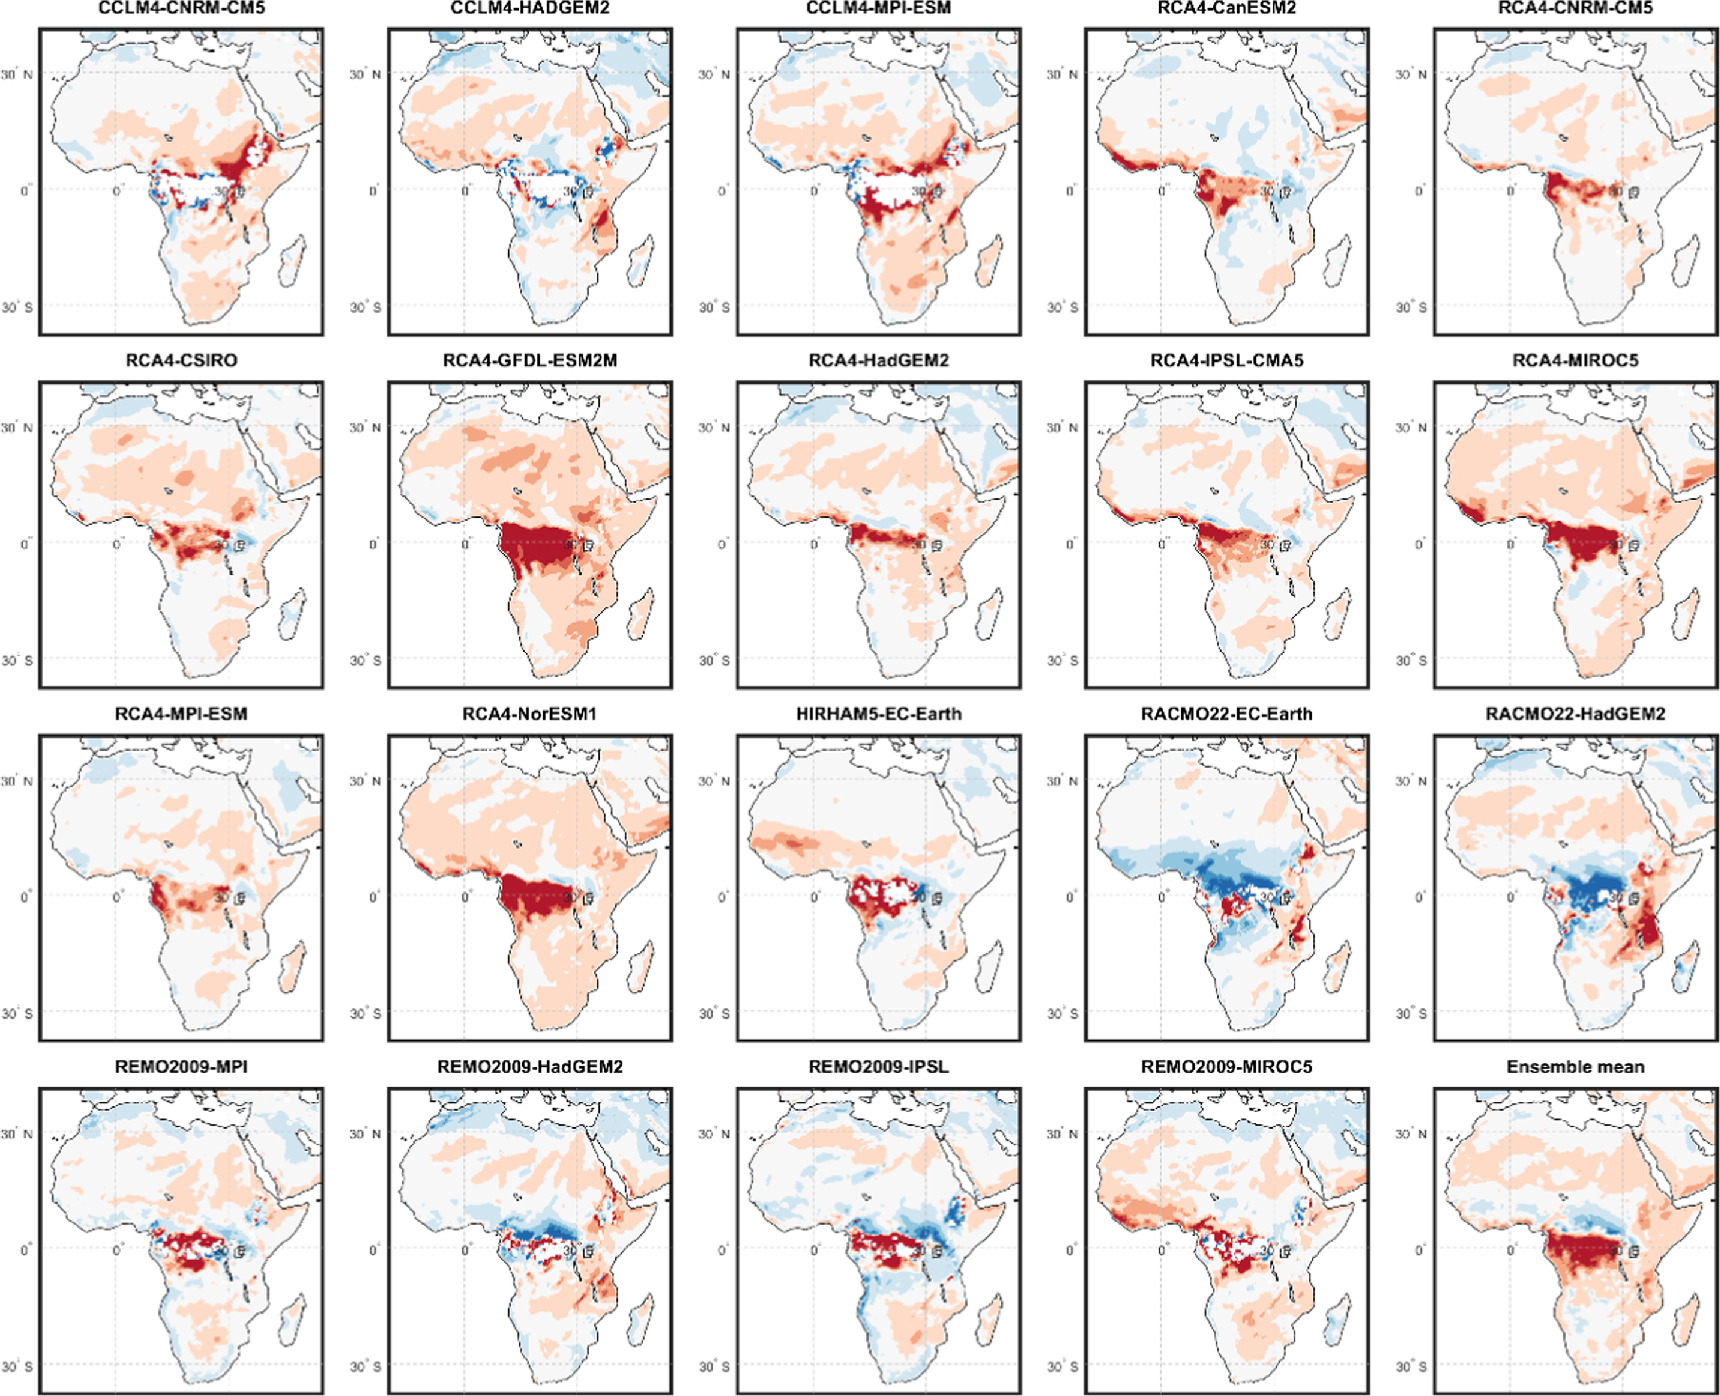
Figure A.7. Relative RCP8.5 2036–2065 wind energy potential biases against ERA5 for individual RCM models and the multi-model ensemble mean biases (%).
Download figure:
Standard image High-resolution image
Figure A.8. Relative RCP8.5 2071–2100 wind energy potential biases against ERA5 for individual RCM models and the multi-model ensemble mean biases (%).
Download figure:
Standard image High-resolution image