


Abstract
Ukraine ranks among the largest global producers and exporters of a variety of agricultural commodities. Despite its importance, there is limited research on the effect of climate change on the future of Ukraine's agricultural sector. We investigate how weather affects the yields of Ukraine's five major crops: winter wheat, spring barley, sunflower, soybean, and corn. Using panel data on village-level surveyed crop yields and fine-scale weather data from 2004–2020, we estimate flexible statistical yield models to characterize the impact of temperature and precipitation changes on crop yields. A simple linear model of the effect of average temperature and precipitation on yields suggests warming is beneficial for all crops in Ukraine. However, a more flexible model of the temperature-yield relationship implies that the yields of two cold-season crops, winter wheat and spring barley, respond negatively to temperatures above 29 °C and 30 °C, respectively. We find no negative effects of high temperatures for the three warm-season crops. We conclude that both average temperature and exposure to high temperatures affect Ukrainian yields.
Export citation and abstract BibTeX RIS

Original content from this work may be used under the terms of the Creative Commons Attribution 4.0 licence. Any further distribution of this work must maintain attribution to the author(s) and the title of the work, journal citation and DOI.
1. Introduction
Climate change dramatically affects agricultural productivity globally (IPCC 2014, Ray et al 2019). According to the most recent climate assessment report issued by IPCC, climate change has slowed the growth of the overall increasing agricultural productivity over the past 50 years globally, with negative impacts on mid- and low-latitude regions such as Africa (Nhamo et al 2019, Sultan et al 2019, Kogo et al 2021) and Australasia (Molotoks et al 2021) and positive impacts in some high latitude regions such as Europe (Raza et al 2019) and North America (IPCC 2022).
The exact impacts of climate change on crop yields differ among crop species (Chang 2002, Kurukulasuriya and Rosenthal 2013) and vary with environmental endowments, such as latitude (Rosenzweig and Hillel 1998), elevation (Brammer 1990, Downing 1992, Fischer and van Velthuizen 1996, Mirza et al 2003), soil condition (Purakayastha et al 2019, Qiao et al 2022), water efficiency, etc. The adaptive capacity of the agricultural sector may also contribute to heterogeneous yield responses. Such adaptation may occur at the farm level through diversification in seed genetic structure and composition (Mortimore and Adams 2001, Fosu-Mensah et al 2012), use of intercropping (Hassen et al 2017), adoption of drought-tolerance varieties (Tambo and Abdoulaye 2012, Lunduka et al 2019, Dejene et al 2011), changes in cropping calendar (Rhodes et al 2014), weed management (Scott et al 2016), pest control (Chen and McCarl 2001), nutrient management (Chiotti and Johnston 1995), irrigation (Kahil et al 2015, Rosa 2022), etc. Adaptation may also occur at the society level, through investments in weather prediction, agricultural research, technology development, etc.
As one of the largest crop producers and exporters in the world, Ukraine plays an important role in the world food supply chain, which has recently been highlighted by the effects of the ongoing Russia-Ukraine war on global food supply and price, and the food security of countries that import most of their grain supply from Ukraine (Behnassi and Haiba 2022). With 41.5 million hectares of agricultural land covering 70% of the country and about 25% of black soil 4 reserves on the planet, Ukraine's agriculture sector generated approximately 9.3% of the nation's GDP and 14.11% of employment in 2020. As one of the main exporters of agricultural products in the world, the country contributed 47% of sunflower oil, 10% of wheat, 14% of corn, and 17% of barley to global export markets in 2021 5 .
Given the importance of the agriculture sector in Ukraine and its vulnerability to climate change, understanding the exact impacts of climate change on agriculture production in Ukraine is important. However, little is known about the impacts of changing climate on crop yields and agricultural production in Ukraine. And the validities of the small number of studies that examined climate impacts on crop yields in Ukraine are constrained by either the aggregate crop yields data they use (Tarariko et al 2017) or the relatively short time interval and crop coverage of the data (Müller et al 2016).
In the past century, extreme weather and climatic shocks have brought challenges to agricultural production in Ukraine. The annual air temperature in Ukraine in the 20th century has increased by 0.6±0.2 °C (Boychenko et al 2016 ), which corresponds to more frequent arid years and the changing rhythm of seasonal phenomena such as floods and snowfall (Rudych and Batazhok 2018). Since crop growth responses to changes in weather may vary considerably across crops and regions, it is important to develop location-specific estimates of the weather-yield response. The negative relationship between warming and crop yields found in Brazil (Assunção and Chein 2016), France (Gammans et al 2017), and the United States (Schlenker and Roberts 2009) may not extend to the cooler climate of Ukraine. Under certain conditions, warming may result in more arable land and increasing crop yields (IPCC 2022). In the context of Ukraine, Tarariko et al (2017) analyzed the effect of historical and current climate change on grain yields in the country based on historical satellite data and climatic modeling approach and predicted that the grain yields in Ukraine may increase by 25% and 29%–30% in 2025 and 2050 accordingly compared with yields in 2015. Müller et al (2016) also predicted that while the wheat yields in Ukraine may substantially decrease under a high emission scenario (particularly in the southern Steppe zone), rising temperatures and increasing precipitation may increase wheat yields in less fertile areas in northern Ukraine.
To investigate the contextualized impacts of changing climate conditions (especially the temperature) on different crops, we combine large-sample survey data in Ukraine (46,799 farms each year) and climate data from 2004 to 2020 to examine how the yields of five main crops in Ukraine respond to short-run variation in temperature and precipitation in the growing season. Our results suggest that the overall rising temperature is associated with short-run yield rises of all five main crops, which contradicts findings in other related studies which conclude that the overall rising temperature harms the crop yields in other European contexts such as France (Gammans et al 2017). However, the yields of two cold-season crops (winter wheat and spring barley) respond negatively to exposure toward or heat accumulation in temperature intervals above a crop-specific stressful temperature bound (29/30 °C). For warm-season crops on the other hand—sunflower, soybean, and corn, we did not find evidence of a stressful temperature threshold in the Ukrainian data.
By examining the heterogeneous relationships between changing climate conditions and land productivity across crops, our study contributes to the literature by providing a comprehensive analysis that encompasses multiple crop types in a high-latitude context. Our finding that cold-season crops and warm-season crops respond differently to the rising temperature in Ukraine contributes to the broader understanding of the climate impacts on agricultural productivity. With the pressing challenges in agriculture posed by the changing climate, our study has important implications for food security and policymakers and farmers involved in agricultural production.
The rest of the paper is structured as follows. The following chapter introduces the data and methods we use for empirical analysis. Chapter 3 presents our empirical results and chapter 4 concludes the paper.
2. Data and empirical methods
2.1. Data
We combine the farm-level survey data collected by Ukraine's State Statistics Department and rayon-level climate data from the WCRP Coordinated Regional Downscaling Experiment program (CORDEX, Giorgi et al 2009) for our analysis.
The farm-level data collects information on cropped areas of crops and outputs from farms in Ukraine, which results in an average sample size of 46,799 farms each year from 2004 to 2020 (except 2015). As a comparison to the macro-level data, the aggregated cereal and wheat production in our dataset accounts for 84% of the national cereal production (59.79 out of 70.77 million tons, FAO 6 ) and 76% of the national wheat production (21.58 out of 28.38 million tons, USDA 7 ) accordingly in 2020. We restrict our analysis to five major crops in Ukraine—winter wheat, spring barley, sunflower, soybean, and corn, which account for approximately 90% of the total cereal and legumes production (winter wheat, spring barley, corn, and soybean) and 65% of the total technical crops production (sunflower).
As indicated in Figure 1, the yields of the five main crops in Ukraine have been increasing continuously over time. Beyond the climate factors, the rising yields are mainly driven by factors such as the increasing use of agricultural inputs, investment in infrastructure such as irrigation systems, adaptations to new varieties or technology, etc.
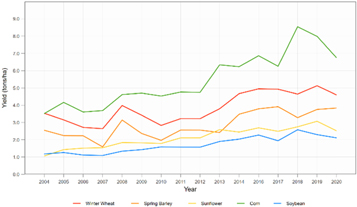
Figure 1. Yields of five main crops in Ukraine over time.
Download figure:
Standard image High-resolution imageWhile the survey data we use is advantaged in its large sample size, the survey conducted before and after 2015 could only be matched at the aggregated level (village or rayon) but not at the farm level due to the inconsistency in farm ID in two periods. As a result, our empirical analysis is mainly based on aggregated data at the village level to utilize recent data after 2014. The crop yields at the village level are calculated based on the aggregated output and planting area.
The temperature and precipitation data we use come from EURO-CORDEX (Jacob et al 2014), a sub-program of the Coordinated Regional Downscaling Experiment (CORDEX) program sponsored by the World Climate Research Program (WCRP). EURO-CORDEX provides a set of simulations on climate data in Europe with a horizontal resolution of 12.5 km. Based on the EURO-CORDEX data, we calculate regional climate data including the daily precipitation and daily maximum, average, and minimum temperature for each rayon (sub-district) in Ukraine. The temperature and precipitation data are then processed and merged with the survey data based on rayon information.
2.2. Empirical methods
Our analysis focuses on 5 main crops in Ukraine—winter wheat, spring barley, sunflower, soybean, and corn. The growing seasons of the five crops are defined as March-June, April-June, June-August, June-July, and June-September accordingly based on the agronomic calendar in Ukraine (USDA 8 ), and all climate-related variables are constructed based on crop-specific growing seasons 9 .
To estimate the weather-yield relationship for each of our five crops of interest, we first adopt the fixed effects panel regression and estimate the baseline model:

where  is the logarithm of crop yield at village
  in year
  Weather variables include
  average daily temperature, along with average daily precipitation,
  and its square, which addresses the non-linear relationship between precipitation and yields as suggested in the literature. Location-fixed effects,
  absorb time-invariant factors at the village level that might affect crop yields such as geographic conditions or soil type, λt
denotes the year-fixed effects that control the common factors that could contribute to variation in crop yields over time such as technology availability, and
absorb time-invariant factors at the village level that might affect crop yields such as geographic conditions or soil type, λt
denotes the year-fixed effects that control the common factors that could contribute to variation in crop yields over time such as technology availability, and  is the error term. All climate variables in our analysis are calculated based on crop-specific growing seasons.
To address the nonlinearity in crops' yield response to temperature, we then follow the approach of Schlenker and Roberts (2009). The model can be written as:

where  is the logarithm of crop yield at village
  in year
 is the temperature response function and
  is the time distribution of heat over the growing season at village
  in year
 and
and  indicate the lower and upper bounds of temperature in the growing season. Control variables

 and
and  are the same as in equation (1).
We estimate the temperature response function  in equation (2) under two specifications—a temperature exposure step function and a growing degree days (GDDs) approach. For the step-function approach, we define a function that implies a distinct marginal effect within each 3 °C temperature exposure interval. More formally, we can replace the term
  in equation (2) with this step-function to obtain the following regression equation:

where  is the exposure time in the growing season when the temperature is between
  and
and  Other variables are represented the same as in equation (1). Moreover, it needs to be noted that the 3-degree bins are chosen for simplicity concerns. We also conduct the analysis using 1-degree bins for robustness check and the results are similar to 3-degree specifications.
To calculate the exposure to different 3-degree temperature intervals, we apply a method that has been widely adopted in the literature (Allen 1976)—the sine curve approach. More specifically, the within-day temperature distribution of each day is simulated by a sine curve based on daily maximum and minimum temperature, after which the daily exposure to each 3-degree temperature interval will be calculated and then aggregated across the growing season.
An alternative specification we apply to capture the nonlinear effect of temperature is based on the growing degree days (GDDs hereafter) approach. Rooted in agronomic research, GDDs are widely used to measure the accumulated heat unit in the growing season, which assumes that crop development will only occur when the temperature exceeds a minimum or lower temperature threshold  while the heat accumulation after the temperature exceeds a maximum or upper-temperature threshold
  would either have no effects on crop growth or even harm the crop. Empirically, the accumulated heat unit within the temperature interval [
 ] is defined as GDDs and the accumulated heat unit above
  measures the stress degree days (SDDs hereafter)
10
. We apply the GDDs specification by estimating the following equation:
measures the stress degree days (SDDs hereafter)
10
. We apply the GDDs specification by estimating the following equation:

where  is the GDDs in the growing season when the lower and upper-temperature thresholds are set as
  and
and  accordingly,
  denotes SDDs measured by the heat accumulation when the temperature is above the upper-temperature threshold


 and
and  are the same as in previous models.
Similar to our temperature exposure variables, the GDDs and SDDs of each day are calculated based on the simulated daily temperature distribution using the sine curve approach, which is the integral area between the given temperature threshold ![${[l}_{0},{{l}}_{1}]\,$](https://content.cld.iop.org/journals/2515-7620/5/10/105015/revision2/ercacde36ieqn40.gif) on the simulated daily temperature distribution curve, after which the daily data are aggregated to calculate the GDDs and SDDs for the growing season.
on the simulated daily temperature distribution curve, after which the daily data are aggregated to calculate the GDDs and SDDs for the growing season.
To determine the temperature thresholds, we select the lower temperature threshold  based on the agronomic knowledge for each crop
11
and loop for possible upper-temperature threshold
based on the agronomic knowledge for each crop
11
and loop for possible upper-temperature threshold  to determine the appropriate thresholds based on changes in estimated coefficients of GDDs/SDDs and
  in the regression. The estimated results from the former temperature bins approach are also used to determine the range of upper-temperature thresholds we loop across. More specifically, we choose temperatures around the temperature bins of which the estimated coefficient turns from positive to negative as it unveils the approximate 'stressful' temperature for crop growth, above which the rising temperature would negatively affect crop yields.
3. Empirical results
This section presents our empirical results on the estimated weather-yield responses of five main crops in Ukraine. We first present the results of our baseline model described in equation (1). The climate-related independent variables include the average daily temperature, average daily precipitation, and its square term to address the quadratic relationship between crop yields and precipitation.
Table 1 reports the estimated yield responses of crops to weather variations based on equation (1), which indicates that the yields of the five main crops in Ukraine respond positively to the overall rising temperature. Our results indicate that a 1 °C rise in average daily temperature in the growing season is associated with 2.8%, 5%, 3.5%, 8.8%, and 3.5% increases in the yields of winter wheat, sunflower, soybean, and corn respectively. We conclude that, unlike most low-latitude areas, the overall rising temperature (or global warming) is likely to benefit crop yields or land productivity in Ukraine. This finding is consistent with findings in other related literature based in colder high-latitude areas—the warming trend may have positive effects on land productivity in some areas such as northern Europe (Olesen and Bindi 2002, Alcamo et al 2007) and North America (Motha and Baier 2005).
Table 1. Estimated yield response of five crops in Ukraine to weather variation in FE estimation.
| (1) | (2) | (3) | (4) | (5) | |
|---|---|---|---|---|---|
| Log(yield) | Winter wheat | Spring Barley | Sunflower | Soybean | Corn |
| Daily temperature | 0.028*** | 0.050*** | 0.035*** | 0.088*** | 0.035*** |
| (0.005) | (0.007) | (0.007) | (0.009) | (0.012) | |
| Prec (mm) | −0.059* | −0.138*** | −0.107*** | −0.001 | 0.033 |
| (0.033) | (0.028) | (0.021) | (0.023) | (0.034) | |
| Prec2 (mm*mm) | −0.003 | 0.020*** | 0.015*** | −0.004 | −0.008 |
| (0.006) | (0.005) | (0.003) | (0.003) | (0.005) | |
| Observations | 155,215 | 123,716 | 112,644 | 57,578 | 91,383 |
| R-squared | 0.579 | 0.569 | 0.612 | 0.537 | 0.610 |
All climate-related variables are calculated based on the crop-specific growing season, standard errors are clustered at the rayon level, *** p < 0.01, ** p < 0.05, * p < 0.1.
The positive outcomes of rising temperatures on crop yields at high latitudes in Europe (e.g., Ukraine) could be explained by various mechanisms such as the extension of growing seasons, lower risk of frost or icing, etc. that are associated with the higher temperature. For example, the prolongation of the vegetation period associated with the warming climate may contribute to the rising crop yields (especially the winter crops) in Ukraine (Tarariko et al 2017). Moreover, in a regional study based in western Ukraine, Fischer et al (2014) conclude that the risk of frosting or icing reduces with the rising temperature, which could potentially benefit crop growth. Additionally, the temperature might also affect crop yields indirectly through soil fertility (Leirós et al 1999), pests (Skendžić et al 2021, Cannon 1998), diseases (Coakley et al 1999), etc., that are associated with temperature. However, the exact effects of rising temperature on the interaction of crops and land, pests, and diseases might vary across contexts and farmers' adaptation capacity.
In terms of precipitation 12 , our results suggest that the precipitation in the growing season in Ukraine is significantly associated with the yields of spring barley and sunflower only. However, the typical inverse-U relationship between precipitation and crop yield is not found on all five crops. While the relatively sufficient level of rainfall in Ukraine might contribute to such a result, the fact that farmers could adapt to rainfall change through irrigation could be the other factor that can explain the weak association between precipitation and yields of crops such as winter wheat, soybean, and corn.
The estimation results of equation (3) are displayed in Figure 2 13 . For winter wheat, we find that exposure to temperatures between 9 °C and 30 °C significantly increases yield, while an additional day of exposure to temperatures above 30 °C decreases yields by 81.7%. Spring barley exhibits a similar temperature response with yield responding positively to exposure temperatures between 6 °C and 30 °C, while an additional day above 30 °C is associated with a 46% decrease in yield. The relatively small number of observations with daily temperatures over 30 °C in the growing season could explain the magnitudes of the coefficients. This is because through March to June, there is only a small number of days when the daily maximum temperature exceeds 30 °C. Therefore, one extra day of exposure to temperatures above 30 °C implies a great increase in the number of days when the daily maximum temperature exceeds 30 °C, indicating a much hotter growing season.
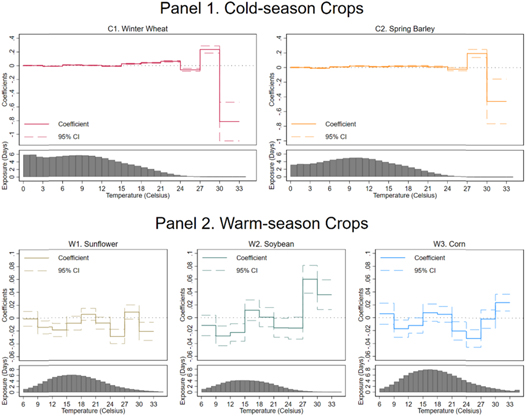
Figure 2. Estimated non-linear yield response of five crops to exposure to temperature intervals. Notes: This graph displays changes in log yield if a county is exposed for one extra day to each 3 °C temperature interval relative to a day spent below 0 °C (winter wheat and spring barley) or 6 °C (sunflower, soybean, and corn).
Download figure:
Standard image High-resolution imageWhile different in magnitude, several studies have shown the overall negative relationship between the rising temperature and yields of spring-season crops such as winter wheat and spring barley in high-latitude regions such as Denmark (Kristensen et al 2011), France (Licker et al 2013), North America (Klink et al 2014). However, our empirical results suggest that what hurts the yields of these spring-season crops is more likely the exposure to stressful high temperatures, not the temperate warmer environment.
We find strikingly different results for the three warm-season crops— sunflower, soybean, and corn. In contrast with wheat and barley, we do not find any statistical evidence of an upper-temperature threshold above which the crop yields respond negatively to temperature exposure. This contrasts with findings in other contexts such as the U.S. (Burke and Emerick 2016) and China (Chen et al 2016) which find negative effects for temperatures above 28 °C or 29 °C. 14 The relatively colder environment in Ukraine could be a possible explanation for such a result, as increased exposure to temperatures above 28 or 29 °C in colder areas with a relatively small scale of exposure might indicate a favorable rising temperature for crop growth rather than an increasing duration of exposure to stressful hot days, such as in hotter regions.
Furthermore, we investigate the heterogeneity in yield-temperature response across regions in Ukraine. For each crop, we divide the sample villages into two categories—warm region and cold region, depending on whether the average daily temperature of the village is above the sample mean. Our results suggest that, for cold-season crops, the negative association between yields and exposure to temperatures above the stressful temperature threshold is more significant in warm regions (Figure A2 in the appendix) than in cold regions (Figure A3 in the appendix). While for hot-season crops, it is consistent in both regions that no clear upper-temperature thresholds (above which the crop yields respond negatively to temperature exposure) are detected. The heterogeneity across regions implies that the hotter eastern and southern Ukraine with a higher temperature and less precipitation might be facing more stress in mitigating the negative impacts of the warming climate 15 .
Based on the results from the temperature intervals approach, we apply the growing degree days (GDDs) specification and estimate equation (4) to examine the relationship between heat accumulation in the growing season and crop yields. To address the previous finding that the temperature in the growing season rarely reaches a potential stressful temperature threshold for the three warm-season crops in Ukraine, the stress degree days (SDDs) term is removed from the equation for sunflower, soybean, and corn. More specifically, we define the lower temperature threshold as 6 °C and loop for all possible upper-temperature thresholds from 25 °C to 34 °C and estimate equation (4) for winter wheat and spring barley. On the other hand, for sunflower, soybean, and corn, the lower temperature thresholds are set as 8 °C, 10 °C, and 10 °C accordingly for estimating the impacts of GDDs on the yields of these crops 16 .
To determine the appropriate upper-temperature thresholds for winter wheat and spring barley, we utilize both the results from the previous temperature bins specification and the results from the regression loop. More specifically, the significant negative coefficients of the temperature intervals above 30 °C from the previous result first indicate that the 'stressful' temperature thresholds for winter wheat and spring barley are both at around 30 °C. Moreover, the changes in the coefficients of GDDs (decreasing) and SDDs (increasing in absolute value) in the regression loop, when a higher temperature threshold is selected, indicate that the turning points for winter wheat and spring barley are at somewhere around 29 °C (Table A2 in the appendix) and 30 °C (Table A3 in the appendix), respectively.
The results from the GDDs specification after we select 29 °C and 30 °C as upper-temperature thresholds for winter wheat and spring barley, respectively, as shown in Table 2, are consistent with previous results in the temperature bins specification. For the two cold season crops—winter wheat and spring barley, crop yields respond positively to GDDs while negatively to SDDs, i.e., the heat accumulation when the temperature is below a stressful temperature threshold is positively associated with crop yields, while the heat accumulation after the temperature exceeds the threshold would likely to harm crop yields. However, for the other three hot season crops—sunflower, corn, and soybean, heat accumulation is positively associated with crop yields. More specifically, one extra growing degree days (GDDs) is associated with a 0.16%, 0.153%, 0.024%, 0.169%, and 0.034% yield increase of winter wheat, spring barley, sunflower, soybean, and corn accordingly. While for winter wheat and spring barley, one extra stress degree days (SDDs) is associated with 16.47% and 31.28% yield loss, respectively 17 .
Table 2. Nonlinear impacts of temperature on crop yields (GDDs).
| (1) | (2) | (3) | (4) | (5) | |
|---|---|---|---|---|---|
| Log(yield) | Winter wheat | Spring barley | Sunflower | Soybean | Corn |
| GDDs6,29 (Mar-Jun, *100) | 0.160*** | ||||
| (0.015) | |||||
| SDDs29 (Mar-Jun, *100) | −16.474*** | ||||
| (4.304) | |||||
| GDDs6,30 (Apr-Jun, *100) | 0.153*** | ||||
| (0.020) | |||||
| SDDs30 (Apr-Jun, *100) | −31.280** | ||||
| (15.921) | |||||
| GDDs8 (Jun-Aug, *100) | 0.024*** | ||||
| (0.007) | |||||
| GDDs10 (Jun-Jul, *100) | 0.169*** | ||||
| (0.016) | |||||
| GDDs10 (Jun-Sep, *100) | 0.034*** | ||||
| (0.010) | |||||
| Prec (mm) | −0.036 | −0.150*** | −0.126*** | 0.000 | 0.034 |
| (0.032) | (0.027) | (0.022) | (0.023) | (0.033) | |
| Prec2 (mm*mm) | −0.003 | 0.024*** | 0.017*** | −0.004 | −0.008 |
| (0.006) | (0.005) | (0.004) | (0.003) | (0.005) | |
| Observations | 155,215 | 123,716 | 112,644 | 57,578 | 91,383 |
| R-squared | 0.581 | 0.569 | 0.612 | 0.538 | 0.610 |
All climate-related variables are calculated based on crop-specific growing season, standard errors are clustered at the rayon level, *** p < 0.01, ** p < 0.05, * p < 0.1.
4. Conclusion
Given the complexity of crop growth and its interaction with climate conditions, as well as the potential adaptations that can be applied in agricultural practices by farmers, assessing the exact impacts of climate change on agricultural production is never an easy task. In most cases, the results vary across crops and depend largely on the environment of the studied area (geographic location, climate condition, soil type, etc.), as well as the empirical approaches researchers apply.
Our empirical results on yield responses of crops to short-run changes in climate conditions indicate that increasing average temperature is positively associated with the yields of all five main crops in Ukraine. For the two cold season crops—winter wheat and spring barley, crop yield increases with exposure to moderate temperatures. Exposure to temperature intervals above a 'stressful' temperature bound (29 °C for winter wheat, 30 °C for spring barley) harms crop growth. Furthermore, our heterogenous analysis indicates that the negative yield-temperature relationship after the temperature exceeds the stressful temperature thresholds is more significant in warmer regions, suggesting that hotter southern and eastern Ukraine might face more stress in mitigating warming climate in the future.
For the three warm-season crops—sunflower, corn, and soybean, we do not find similar stressful temperature thresholds above which the crop yields respond negatively to temperature increases. Instead, the yields of the three warm-season crops respond positively to overall rises in average temperature and growing degree days (GDDs) in the growing season.
While earlier studies have pointed out the importance of threshold temperature effects, our study adds to the literature by highlighting that such threshold effects will be crop-specific. To the extent that for a subset of crops, relevant thresholds do not yet seem to have been crossed in Ukraine, changes in cropping patterns seem to offer an opportunity for Ukrainian farmers to adjust to climate change. Follow-up research to assess the extent to which such changes already happened as well as the likelihood that the threshold to stressful temperatures for the more heat-resistant crops will be crossed in the future, will be important to assess how climate change may impact agricultural production in Ukraine and also global food security. Furthermore, recent improvements in methods such as machine learning also provide other possibilities for exploring the climate impacts on crop yields.
Data availability statement
The data cannot be made publicly available upon publication because they are owned by a third party and the terms of use prevent public distribution. The data that support the findings of this study are available upon reasonable request from the authors.
Appendix
Table A1. Nonlinear impacts of temperature on crop yields (3-degree intervals).
| (1) | (2) | (3) | (4) | (5) | |
|---|---|---|---|---|---|
| Log(yield) | Wheat | Barley | Sunflower | Soybean | Corn |
| Exposure | |||||
| 0 °C–3 °C | 0.002 | 0.001 | |||
| (0.002) | (0.003) | ||||
| 3 °C–6 °C | −0.009*** | −0.008*** | |||
| (0.002) | (0.003) | ||||
| 6 °C–9 °C | 0.008*** | 0.008*** | −0.001 | −0.012 | 0.006 |
| (0.002) | (0.002) | (0.006) | (0.008) | (0.008) | |
| 9 °C–12 °C | 0.002 | 0.020*** | −0.014*** | −0.028*** | −0.017** |
| (0.003) | (0.003) | (0.005) | (0.008) | (0.007) | |
| 12 °C–15 °C | −0.008** | 0.011*** | −0.019*** | −0.023*** | −0.012** |
| (0.003) | (0.003) | (0.005) | (0.007) | (0.006) | |
| 15 °C–18 °C | 0.025*** | 0.018*** | −0.009 | 0.012 | 0.008 |
| (0.003) | (0.004) | (0.005) | (0.008) | (0.007) | |
| 18 °C–21 °C | 0.040*** | 0.020*** | 0.005 | 0.001 | 0.005 |
| (0.004) | (0.005) | (0.005) | (0.008) | (0.006) | |
| 21 °C–24 °C | 0.061*** | 0.010* | −0.008* | −0.016** | −0.021*** |
| (0.005) | (0.006) | (0.005) | (0.007) | (0.007) | |
| 24 °C–27 °C | −0.063*** | −0.022** | −0.029*** | −0.016* | −0.032*** |
| (0.010) | (0.011) | (0.006) | (0.009) | (0.007) | |
| 27 °C–30 °C | 0.234*** | 0.193*** | 0.009 | 0.060*** | −0.002 |
| (0.027) | (0.028) | (0.006) | (0.011) | (0.007) | |
| 30 °C–33 °C | −0.817*** | −0.460*** | −0.021*** | 0.036*** | 0.024*** |
| (0.144) | (0.154) | (0.007) | (0.012) | (0.007) | |
| Observations | 155,215 | 123,716 | 112,644 | 57,578 | 91,383 |
| R-squared | 0.589 | 0.573 | 0.614 | 0.542 | 0.615 |
Daily precipitation and its square term in growing seasons are controlled, Standard errors are clustered at the rayon level, *** p < 0.01, ** p < 0.05, * p < 0.1.
Table A2. GDDs estimates on winter wheat for various temperature thresholds.
| Log(yield) | (1) | (2) | (3) | (4) | (5) | (6) | (7) | (8) | (9) | (10) |
|---|---|---|---|---|---|---|---|---|---|---|
| Threshold (°C) | 25 | 26 | 27 | 28 | 29 | 30 | 31 | 32 | 33 | 34 |
| GDDs: 6 °C - Threshold (*100) | 0.159*** | 0.156*** | 0.157*** | 0.159*** | 0.160*** | 0.160*** | 0.157*** | 0.154*** | 0.152*** | 0.152*** |
| (0.015) | (0.015) | (0.015) | (0.015) | (0.015) | (0.015) | (0.015) | (0.015) | (0.014) | (0.014) | |
| SDDs: > Threshold (*100) | −0.750** | −0.708 | −1.638 | −5.525*** | −16.474*** | −54.787*** | −175.969*** | −533.727*** | −19,556.538*** | — |
| (0.375) | (0.641) | (1.127) | (2.094) | (4.304) | (11.608) | (25.617) | (131.380) | (781.268) | ||
| Observations | 155,215 | 155,215 | 155,215 | 155,215 | 155,215 | 155,215 | 155,215 | 155,215 | 155,215 | 155,215 |
| R-squared | 0.580 | 0.580 | 0.580 | 0.581 | 0.581 | 0.581 | 0.581 | 0.581 | 0.580 | 0.580 |
Daily precipitation and its square term in growing seasons are controlled, standard errors are clustered at the rayon level, *** p < 0.01, ** p < 0.05, * p < 0.1.
Table A3. GDDs estimates on spring barley for various temperature thresholds.
| Log(yield) | (1) | (2) | (3) | (4) | (5) | (6) | (7) | (8) | (9) | (10) |
|---|---|---|---|---|---|---|---|---|---|---|
| Threshold (°C) | 25 | 26 | 27 | 28 | 29 | 30 | 31 | 32 | 33 | 34 |
| GDDs: 6 °C - Threshold (*100) | 0.148*** | 0.146*** | 0.147*** | 0.151*** | 0.153*** | 0.153*** | 0.153*** | 0.149*** | 0.147*** | 0.147*** |
| (0.020) | (0.020) | (0.020) | (0.020) | (0.020) | (0.020) | (0.020) | (0.020) | (0.020) | (0.020) | |
| SDDs: > Threshold (*100) | 0.028 | 0.284 | −0.032 | −2.293 | −8.521 | −31.280** | −135.351*** | −452.297*** | −14,972.049*** | — |
| (0.451) | (0.792) | (1.476) | (2.874) | (6.045) | (15.921) | (36.216) | (145.184) | (778.662) | ||
| Observations | 123,716 | 123,716 | 123,716 | 123,716 | 123,716 | 123,716 | 123,716 | 123,716 | 123,716 | 123,716 |
| R-squared | 0.569 | 0.569 | 0.569 | 0.569 | 0.569 | 0.569 | 0.569 | 0.569 | 0.569 | 0.569 |
Daily precipitation and its square term in growing seasons are controlled, standard errors are clustered at the rayon level, *** p < 0.01, ** p < 0.05, * p < 0.1.
Table A4. Summary of empirical methods and main results.
| Empirical methods | Fixed effects (FE) | Temperature bins | Growing degree days (GDDs) |
|---|---|---|---|
| Model specification a | Linear | Non-linear | Non-linear |
| Cold-season crops | |||
| Winter wheat | 1 °C rise in average daily temperature is associated with a 2.8% yield increase | Yields respond positively to exposure temperatures between 9 °C and 29 °C, while an additional day above 30 °C is associated with an 81.7% decrease in yields | 1 extra growing degree days (GDDs6,29) is associated with a 0.16% increase in yields, 1 extra stressful degree days (SDDs29) is associated with a 16.47% yields reduction |
| Spring barley | 1 °C rise in average daily temperature is associated with a 5% yield increase | Yields respond positively to exposure temperatures between 6 °C and 30 °C, while an additional day above 30 °C is associated with a 46% decrease in yields | 1 extra growing degree days (GDDs6,30) is associated with a 0.15% increase in yields, 1 extra stressful degree days (SDDs30) is associated with a 31.28% yields reduction |
| Warm-season crops | |||
| Sunflower | 1 °C rise in average daily temperature is associated with a 3.5% yield increase | No stressful upper temperature is detected | 1 extra growing degree days (GDDs8) is associated with a 0.02% increase in yields |
| Soybean | 1 °C rise in average daily temperature is associated with an 8.8% yield increase | No stressful upper temperature is detected | 1 extra growing degree days (GDDs10) is associated with a 0.18% increase in yields |
| Corn | 1 °C rise in average daily temperature is associated with a 3.5% yield increase | No stressful upper temperature is detected | 1 extra growing degree days (GDDs10) is associated with a 0.03% increase in yields |

Figure A1. Estimated non-linear yield response of five crops to exposure to 1-degree temperature intervals. Notes: This graph displays changes in log yield if a county is exposed for one extra day to each 1 °C temperature interval relative to a day spent below 0 °C (winter wheat and spring barley) or 6 °C (sunflower, soybean, and corn).
Download figure:
Standard image High-resolution image
Figure A2. Non-linear yield response of five crops to exposure to 3-degree temperature intervals in warm regions. Notes: This graph displays changes in log yield if a county is exposed for one extra day to each 3 °C temperature interval relative to a day spent below 0 °C (winter wheat and spring barley) or 6 °C (sunflower, soybean, and corn). For each crop, the sub-sample of warm regions includes all villages where the average daily temperature in the growing season is above the national mean.
Download figure:
Standard image High-resolution image
Figure A3. Non-linear yield response of five crops to exposure to 3-degree temperature intervals in cold regions. Notes: This graph displays changes in log yield if a county is exposed for one extra day to each 3 °C temperature interval relative to a day spent below 0 °C (winter wheat and spring barley) or 6 °C (sunflower, soybean, and corn). For each crop, the sub-sample of cold regions includes all villages where the average daily temperature in the growing season is below the national mean.
Download figure:
Standard image High-resolution image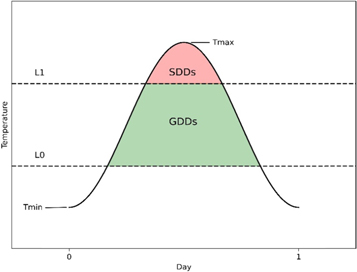
Figure A4. GDDs and SDDs in sine curve approach. Notes: The sine curve is a simulation of temperature change on a given day based on daily maximum (Tmax) and minimum temperature (Tmin). The green area and red area denote the daily GDDsL0, L1 and SDDsL1 accordingly, in which the L0 and L1 are the lower and higher temperature thresholds used in the GDDs approach, which are then aggregated across the growing season to calculate the GDDs and SDDs for specific crops.
Download figure:
Standard image High-resolution image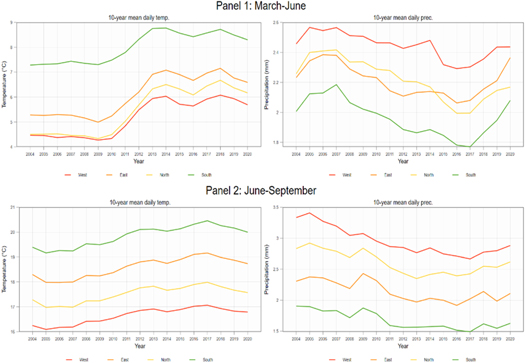
Figure A5. Time trend of 10-year mean daily temperature and precipitation in selected growing seasons by region.
Download figure:
Standard image High-resolution image
Footnotes
- 4
A highly fertile soil with high organic matter contents.
- 5
Data source: USDA https://www.fas.usda.gov/data/grain-world-markets-and-trade.
- 6
Data source: https://www.fao.org/faostat/en/#country/230.
- 7
- 8
- 9
We note that farmers' adjustments in planting and harvest time can affect the accuracy of the arbitrary growing season we apply to each crop and indeed result in bias in our estimation. To address such an issue due to the unavailability of data on planting and harvest dates, we repeat our analysis based on different growing seasons for robustness check and the result remains the same.
- 10
The diagram in Figure A4 in the appendix shows how the daily GDDs and SDDs are calculated.
- 11
North Dakota Agricultural Weather Network (NDAWN): https://ndawn.ndsu.nodak.edu/help-wheat-growing-degree-days.html.
- 12
The average daily precipitation in growing season for the five crops are 2.23 mm (winter wheat), 2.36 mm (spring barley), 2.62 mm (sunflower), 2.95 mm(soybean), and 2.39 mm (corn) accordingly.
- 13
The estimated coefficients based on which the graphs are drawn are shown in Table A1 in the appendix.
- 14
- 15
The time trends of temperature and precipitation in selected growing season of four administrative regions are shown in Figure A5 in the appendix.
- 16
The selection of lower temperature thresholds is mainly based on recommendations from the North Dakota Agricultural Weather Network (NDAWN) Center (https://ndawn.ndsu.nodak.edu/help-corn-growing-degree-days.html). We also test with 6 °C, 8 °C, and 10 °C for all five crops as a robustness check. The results are consistent with what we find using our preferred specification.
- 17
Empirical results are summarized in Table A4 in the appendix.