

Abstract
The impact of the growing cruise ship industry on air quality levels was investigated at the port of Copenhagen, Denmark. In 2018, 345 cruise ships visited Copenhagen, emitting 291 tons of NOx near the city centre. A spatiotemporal cruise ship emission inventory was developed for 2018 based on port list information, engine data, main and auxiliary engine power functions, and NOx emission factors, and was implemented in the OML-Multi atmospheric dispersion model. Evident plume effects from the cruise ships, which were traced by introducing the concept of likely concentration contribution, were obtained in the modelled and measured concentrations at Langelinie Quay, which is the busiest cruise ship terminal in Copenhagen port. Hourly peak values of NOx well above 200 μg m−3 were obtained at the top of a residential building at Langelinie Quay. The emissions from cruise ships were increasing the annual concentration of NO2 in the port area by up to 31% at ground level, and 86% 50 m above the ground in comparison to the urban background level. No exceedance of the European annual limit value of NO2 was obtained. The short-term impact of cruise ships was more pronounced with local exceedances of the hourly European limit value for NO2. Increasing cruise ship activity in Copenhagen port leads to air quality deterioration on short time scales with implications for human health.
Export citation and abstract BibTeX RIS

Original content from this work may be used under the terms of the Creative Commons Attribution 4.0 licence. Any further distribution of this work must maintain attribution to the author(s) and the title of the work, journal citation and DOI.
1. Introduction
Shipping emissions impact climate, environment, and human health with both global and local implications (Endresen et al 2003, Corbett et al 2007, Toscano and Murena 2019). Therefore, the International Maritime Organization (IMO) has continuously been adjusting their regulations to reduce the environmental impact of the maritime sector. The sulphur limit was lowered to 0.1% in 2020 within Emission Control Areas (ECA, IMO 2016), while the North Sea and the Baltic Sea were converted to ECA for NOx in 2021 (IMO 2017). Likewise, has the amendment to the International Convention for the Prevention of Pollution from Ships (MARPOL) Annex VI been adopted requiring ships to reduce their GHG emissions (IMO 2021).
In recent years, the global cruise ship industry has grown from 19.1 million passengers in 2010 to 29.7 million passengers in 2019 (CLIA Cruise Line IndustryAssociation 2021) raising concerns as to its effect on air quality in harbours near or within densely populated areas. Previous studies have shown that shipping emissions can have a substantial influence on the total emission of NOx, SOx and particular matter (PM) in urban areas and on local air pollution levels (Poplawski et al 2011, Chen et al 2017, López-Aparicio et al 2017, Merico et al 2017), while others only show minor impact (Mocerino et al 2020). When studying the impact of harbour shipping emissions on nearby urban environments there are typically three approaches: (i) direct measurements of air quality, (ii) atmospheric dispersion modelling, and (iii) a combination of the former two. Albeit measurements offer exact air pollution levels, other sources are also impacting the measurements, and their high running cost limits their spatial coverage. As such, atmospheric dispersion modelling studies have become more widespread (Murena et al 2018).
Common to the modelling approaches is the need for shipping emission inventories. Activity-based or bottom-up emissions inventories have proved to be the most detailed relying on a vast data collection either from databases or the Automatic Information System (AIS) containing information on vessel size, weight, type, position, speed and heading (see e.g. Tichavska and Tovar 2015, Johansson et al 2017, Wiacek et al 2018, Goldsworthy et al 2019, Mao et al 2020). Moreover, bottom-up emission inventories rely on emission factors and fuel consumption or energy output of the different engine types (Toscano and Murena 2019).
Northern Europe was the fourth most popular cruise destination in 2019 (CLIA Cruise Line IndustryAssociation 2021). The number of cruise ships in Copenhagen port, Denmark, has increased by 24% in just four years from 282 in 2015 to 350 in 2019 (Jensen et al 2021). At the same time, the city has greatly expanded its residential area towards the port. In this study, we wish to investigate the impact of the growing cruise ship industry on air quality in Copenhagen and investigate whether it will lead to pollution levels in the urban area critical to human health. We will construct a detailed spatiotemporal emission inventory for the shipping emission within Copenhagen port that will be used by the atmospheric dispersion model OML-Multi (Olesen et al 2007). Measurements of NOx and NO2 conducted at the rooftop of a residential building in the port only 25 m from the Langelinie cruise ship terminal in 2018, will be used to evaluate the model's capability to simulate the contribution to air pollution from cruise ship emissions in the port of Copenhagen. As NOx is the only pollutant recently causing exceedances of air quality thresholds in Copenhagen, we focus on this pollutant in our study
2. Method
2.1. Study area
In July 2018, 616,098 people lived in the municipality of Copenhagen with a population density of 6,937 making it one of the most densely populated regions in Scandinavia. Figure 1 shows the port and how it stretches through the city of Copenhagen including all berths in the port. There are 18 berths for cruise ships in Copenhagen and 106 for other commercial ships. More than half of the cruise ships arriving in 2018 (table 1) were mooring in the inner areas of the port (mooring sites 177, 190, 192–198) in particular at the approximately 900 m long Langelinie Quay. The study domain is 4.6 km × 6.0 km.
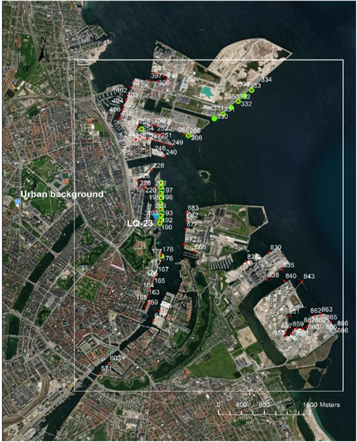
Figure 1. The study area of Copenhagen Port, showing all mooring sites of the port with cruise ship mooring sites highlighted in green and red for other ships. The measurements site LQ-23 at Langelinie Quay is highlighted in blue, as is the Urban background site. The model domain is encapsulated by the white square.
Download figure:
Standard image High-resolution imageTable 1. 2018 data of NOx emissions and number of cruise ships and other commercial ships mooring in Copenhagen port. Data is shown for the entire year and the measurement period in addition to Langelinie Quay and its berth numbers.
| NOx emissions [kg] | Number of ships | |||||
|---|---|---|---|---|---|---|
| Ship type | Location | Berth no. | 2018 | 31/5–19/9 2018 | 2018 | 31/5–19/9 2018 |
| Cruise | Langelinie | 190 | 406 | 0 | 1 | 0 |
| 192 | 28,526 | 19,194 | 49 | 35 | ||
| 193 | 16,716 | 13,083 | 25 | 19 | ||
| 194 | 582 | 582 | 1 | 1 | ||
| 195 | 5,127 | 3,362 | 6 | 3 | ||
| 196 | 4,306 | 3,375 | 5 | 4 | ||
| 197 | 61,208 | 39,480 | 84 | 51 | ||
| 198 | 1,784 | 1,784 | 3 | 3 | ||
| Total | 118,655 | 80,860 | 174 | 116 | ||
| Cruise | Outside Langelinie | Total | 172,951 | 130,456 | 171 | 133 |
| Cruise | All | Total | 291,606 | 211,316 | 345 | 249 |
| Other | All | Total | 274,351 | 85,418 | 2,593 | 799 |
| All | All | Grand total | 565,958 | 296,735 | 2,938 | 1,048 |
2.2. Measurement campaign at Langelinie Quay
During the cruise ships season of 2018, measurements of particle number, NO, NOx and NO2 were conducted at the top of a 23 m high residential building adjacent to berth no. 192 (henceforward reference to as LQ-23). The mooring sites 192 to 198 are positioned at the Langelinie quay, where half of the cruise ships during 2018 were hotelling at berth while in Copenhagen. The measurements were conducted by FORCE Technology using a chemiliuminescence NO/NOx/NO2 analyzer (Teledyne T200) (Fuglsang et al 2019) in the units of μg m−3. The Langelinie quay is positioned North to East of the monitoring site (approximately in the 0° to 90° sector). The measurement period was from 31/5 to 19/9 2018.
2.3. Emissions in 2018 in Copenhagen port
The emission inventory is including both cruise ships and all other commercial ships arriving and departing in Copenhagen port during 2018. The needed input data for constructing the emission inventories are; (i) detailed port list information that contains ship IMO code, ship type, gross tonnage, time of arrival/departure, berth no., and ship manoeuvring times provided by Copenhagen Malmö Port (Nørgaard, 2020); (ii) main engine size (kW), engine stroke (2/4) and ship build year data provided by Danish Shipowners (Kristensen, 2020); (iii) auxiliary engine power (kW) functions estimated from vessel data in the SHIP-DESMO model (e.g. Kristensen, 2017); and (iv) NOx emission factors (g/kWh) provided by MAN Energy Solutions (2012) for slow speed (2-stroke) and medium speed (4-stroke) diesel engines as a function of ship build year.
Specific main engine and auxiliary engine power loads are used for the ships during manoeuvring in the port and hotelling at berth (Jensen et al 2021).
The NOx emissions are calculated for each vessel in the port as the product of engine size (kW), engine load factor (%), time duration at berth/during manoeuvring (hrs) and NOx emission factor (g/kWh). The emission calculations consider increased NOx emissions at low main engine loads during manoeuvring in the port. NOx emission rates (g/s) for all the individual ship berthing periods are subsequently derived from the emission results, and the emissions are spatially distributed according to the time and berth locations within the port.
The cruise ship NOx emissions for the berths at the Langelinie quay are shown in table 1, as well as total NOx emissions for cruise ships outside Langelinie, and total emissions for other commercial ships in the port. The emissions are shown for the full year of 2018 and the measurement period (31/5–19/9 2018) coinciding with the busiest cruise ship period.
For 2018 [measurement period] the percentage emission contribution of NOx for cruise ships at Langelinie is 21% [27%] to the total port emissions. For cruise ships outside Langelinie the 2018 [measurement period] percentage emission contribution is 31% [44%]. Thus, cruise ships contribute with 52% [71%] of NOx emitted by ships in Copenhagen port.
Separately, for Langelinie the largest emission percentage shares of NOx are calculated for the berth numbers 197 with 52% [49%], 192 with 24% [24%], and 193 with 14% [16%].
2.4. The OML-Multi model
The OML-Multi model is a local-scale atmospheric dispersion model for multiple point and area sources (Olesen et al 2007). It is a Gaussian plume model that relies on physical parameters such as friction velocity, heat flux, and atmospheric stability, and takes plume rise, partial penetration of the mixing layer, and building and terrain effects into consideration. The spatial domain of the OML model is flexible, and within the defined domain the model calculates the dispersion for all the defined sources. For our study, a receptor resolution of 100 m × 100 m was chosen covering the port area of Copenhagen and the central part of the city.
A simplified scheme for NOx-O3 chemistry (Düring et al 2011) is incorporated into the OML model. Background concentrations of NOx, NO2 and O3, global radiation and wind direction are obtained from measurements at the urban background monitoring station HCOE 2.5 km from Langelinie. Where data is missing from the observations, concentrations are obtained from the regional scale atmospheric chemical transport model DEHM (Frohn et al 2021). The remaining meteorological data needed in OML-Multi (e.g., friction velocity, Monin-Obukhov length, temperature, boundary layer height) are obtained from the weather research and forecasting model, WRF, which drives the DEHM model (Skamarock et al 2008).
The stack height influences the atmospheric dispersion, and it is estimated for the individual cruise ships based on a linear correlation between ship stack height and brutto tonnes found by Olesen and Berkowic (2005). The mean stack height of the cruise ships in Copenhagen port was found to be 51.7 m with a standard deviation of 12.7 m. In addition, building effects from the cruise ships themselves will impact the dispersion, and based on previous findings we set the height of the ship to 67% of the stack height (Olesen and Berkowic 2005). The exhaust velocity is in all cases set to 27.5 m s−1, while the exhaust temperature is set to 200 °C and 250 °C, for heavy fuel oil (HFO) and marine diesel/marine gas oil (MDO/MGO), respectively (Olesen and Berkowic 2005). A roughness length of 0.5 is chosen for OML-Multi corresponding to dense urban areas.
Emissions from the individual ships are released at the mooring site during the time they are at berth. This means that the point source shipping emissions are located at the exact berth no. coordinates provided by the port authorities. We estimate 15 min for manoeuvring at arrival and departure, however, for simplicity these emissions are released at berth. Simulations were done for the entire study area at the surface (1.5 m), at 25 m and 50 m heights.
3. Results
3.1. Applicability of OML
To assess the general capability of OML-Multi to simulate the dispersion of pollutants in Copenhagen port the relation between the hourly measured and modelled NOx concentrations at LQ-23 at Langelinie quay is examined with a quantile-quantile (q - q) plot (figure 2). The modelled NOx concentrations are extracted from a height of 25 m for the time period covering the measurement campaign. The fit indicates a strong similarity with linearity close to x = y between the observed and modelled concentrations with a few difficulties for the model to accurately mimic the highest observed NOx concentrations. This indicates that the observed and simulated atmospheric NOx stem from the same distribution type and that OML-Multi can simulate the given situation in Copenhagen port with realistic values from low to peak concentrations of NOx values except for the very highest.

Figure 2. q-q plots of the measured and modelled NOx concentrations at LQ-23.
Download figure:
Standard image High-resolution image3.2. Peak concentrations at Langelinie
To better understand the origin of the emissions giving rise to peaks in the NOx concentrations at LQ-23 we introduce the concept of likely concentration contribution (LCC) from shipping emissions at berth upwind from the measurement site. The LCC from emissions at berth up-wind is estimated by simple assumptions to the Gaussian plume model formulation
Where Q is the emissions from a specific berth no., u is wind velocity, σy and σz are horizontal and vertical dispersion parameters, z is the height of the measurement site, and hef is effective emission height. The equation takes reflection from the bottom and top of the mixing layer into account. For simplicity we use a mean wind velocity of 5 ms−1, assume that the dispersion parameters are one-tenth of the mean velocity multiplied by the distance to the berth no., and only look at the likely concentration contribution at the plume centerline (y = 0). The direction of the LCC arising from up-wind emissions is plotted relative to the measuring site LQ-23 in figure 3 together with the measured and modelled concentration of NOx at 25 m and wind direction used by the OML-Multi model. LCCs smaller than 50 μg m−3 are excluded from the figure. When LCC and wind direction are from the same direction, peak concentrations are to be expected at LQ-23.
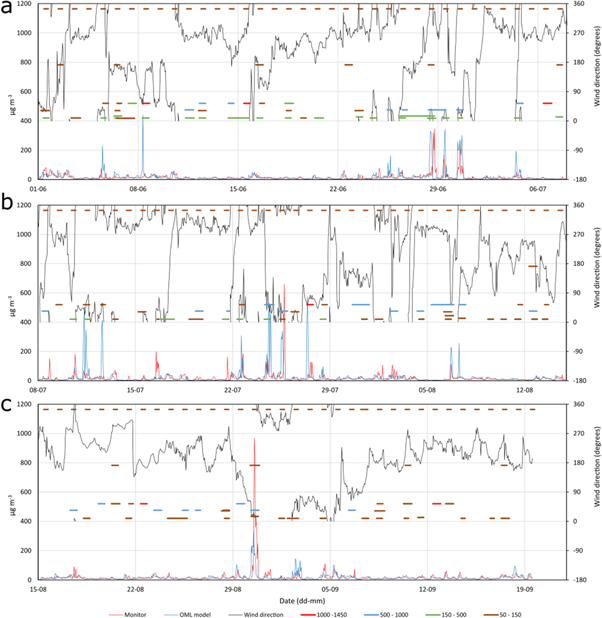
Figure 3. Measured and model concentrations of NOx for the measurement period at Langelinie plotted together with wind direction and likely concentration contribution (LCC) at berth up wind from LQ-23. The LCC are colour coded according to size and plotted in their relative direction to LQ-23 using the same axis as the wind direction (right y-axis). The data is divided into three periods fully covering the measurement period; 1/6 2018-7/7 2018 (a); 8/7 2018 -14/8 2018 (b); and 15/8 2018 to 19/9 2018 (c).
Download figure:
Standard image High-resolution imageFrom figure 3 it is evident that most of the emission from cruise ships at berth causing peak concentrations at LQ-23 is originating from the northeastern sector (0°– 90°) relative to the measurement site corresponding to the Langelinie quay. Wind direction coinciding with LCC from this sector results in the largest concentration peaks increasing the NOx concentration by up to several 100% for sources very close to the site. All peak values higher than 200 μg m−3 correspond to plume effects originating from the northeastern sector. In addition, emission from berth no. 177 south of the measurement site have an impact on the NOx concentrations, but only in the first 16 days of June instances are occurring with coinciding southern winds and emissions resulting in small peaks. Moreover, the passenger ferry sailing between Copenhagen and Oslo, Norway, is positioned north of the measurement site and stays in the port during daytime hours resulting in periodic emissions, however with limited impact on the measured and simulated NOx concentrations.
As stated, peak concentrations should occur when the wind direction and the LCC direction are similar, but this is more often the case for the simulated concentrations than the measured ones. This is because the used wind directions in OML-Multi are from HCOE, and not from LQ-23, as there are no direct measurements of wind direction here. The actual wind directions at the LQ-23 measurement site were likely different from the wind directions at HCOE 2.5 km away. Plumes close to the observation site are very sensitive to wind direction, and this wind direction discrepancy is a contributing factor to the differences in size and timing of peaks from the measured and simulated NOx concentrations.
In general, there is a poor correlation (r = 0.23) between the observed and modelled concentrations, although they have similar averages (17.6 μg m−3 and 20.5 μg m−3), median values (10.5 μg m−3 and 11.0 μg m−3), and standard deviations (37.3 μg m−3 and 42.9 μg m−3). Figure 3 shows that peaks only arise when there are considerable emissions from cruise ships in the port, but also indicates problems with capturing the timing of the peaks. If wind data had existed from the LQ-23 as input for the OML-Multi model better compliance between observed and modelled NOx would likely have been obtained.
3.3. Modelled concentration
According to air quality regulations the hourly NO2 limit value of 200 μg m−3 can be exceeded 18 times during a year, and thus the 19th-highest hourly values of NO2 at ground level are shown in figure 4(a). The hourly values are well below the limits. In two separate areas of the port, the highest concentrations are found—one is the outer industrial port, and the other is the inner part, where the cruise liners are moored while in the port. The latter is also the area where the city is expanding with residential and office buildings in the port. The maximum 19th-highest hourly concentration of NO2 at ground level in the port is 133.8 μg m−3. The mean annual NO2 concentrations are in the range of 14 μg m−3 to 18.1 μg m−3 and have a similar spatial pattern as the 19th-highest hourly concentrations. Hence, the emissions from cruise ships and other commercial ships in the port do not cause an exceedance of the annual EU limit value of 40 μg m−3 for NO2 in 2018 (figure 4(b)).

Figure 4. NO2 concentrations [μg m−3] in Copenhagen port 1.5 m above the surface showing (a) the 19th-highest hourly value, and (b) annual average values.
Download figure:
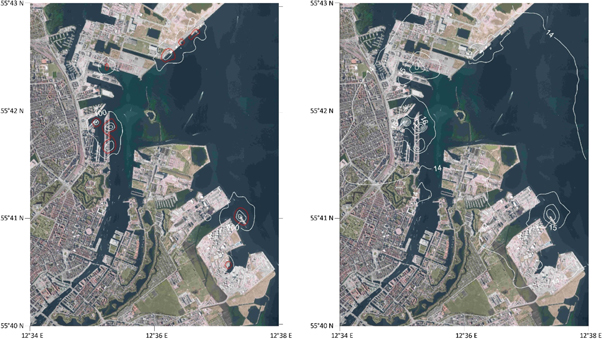
Standard image High-resolution imageSince most new buildings in the harbour will be multiple storages, the concentrations are examined at a higher level (50 m) close to the average stack height (51.7 m) of the cruise ships visiting Copenhagen port (Jensen et al 2021). At this height, exceedances are obtained for the hourly limit value of NO2, but only very locally at the quays in the outer industrial port area, at Langelinie and a few curise ship berths outside Langlinie (figure 5). The 19th-highest hourly value of 1048 μg m−3 is obtained at 50 m, while the highest annual average of NO2 is 24 μg m−3.
Figure 5. NO2 concentrations [μg m−3] in Copenhagen port 50 m above the surface showing (a) the 19th-highest hourly value, and (b) annual average values. Red counters indicate exceeding of the European NO2 limit values.
Download figure:
Standard image High-resolution image
In comparison, the urban background concentration in Copenhagen measured at HCOE is 13 μg m−3 and 63 μg m−3 for the annual average and the 19th-highest hourly concentrations of NO2 in 2018 (Ellermann et al 2020). Thus, our calculations indicate a substantial augmentation of the urban background level in some areas of Copenhagen Port for both the annual aveage of NO2 (up to 31% at ground level and 86% at 50 m) and the 19th-highest hourly concentration ( up to 100% at ground level and a factor 10 at 50 m). On the other hand, the measured concentration of NO2 at the busiest street in Copenhagen in 2018 had an annual average of 39 μg m−3, and a 19th-highest hourly value of 117 μg m−3 (Ellermann et al 2020). Thus, the maximal annual mean concentration in the port is not uncommonly high when compared to other places in the City. However, the 19th-highest hourly concentration in the port area is unprecedented in Copenhagen.
3.4. Uncertainties
Although bottom-up emission inventories are better than top-down (Eyring et al 2009) which typically are based on fuel-based approaches, they are not without uncertainties. Cooper and Gustafsson (2004) estimate an uncertainty range of 20% to 50% on emission factors, while Moreno-Gutiérrez et al 2015 find that in particular engine load factors, emission factors and specific fuel consumption factors contribute to a 30% difference in total emissions among different inventory methodologies. Studying the health impact of shipping emissions in the Sydney port area, Broome et al (2016) consider an uncertainty of 30% to be realistic for shipping emission inventories in port areas. Our port emission inventories for Copenhagen are state-of-the-art. They are based on the best available data to determine auxiliary engine power functions and NOx emission factors, in addition to being spatiotemporal explicit with exact arrival and departing time together with mooring site position. They offer a great improvement in comparison to a previous study of Copenhagen port, where all emissions were gathered in seven points and cruise ship emissions averaged over the year (Saxe and Larsen 2004). However, an uncertainty in the range of 30% is not unlikely. To reduce the uncertainty further, improvements to auxiliary engine power functions and NOx emission factors would be the way forward.
Greater uncertainties might stem from the use of wind speed and direction from the HCOE monitoring site. This is illustrated at LQ-23, where both the measured and modelled concentrations of NOx are very sensitive to the plumes emitted very close to the site, which in turn are very sensitive to the wind direction. The difference between the wind direction used in OML-Multi and the actual wind direction (which was not measured at the site) results in peak concentation values of NOx that are not always well correlated.
4. Discussion and concluding remarks
Our study finds that the shipping emissions of NO2 are increasing the annual mean concentration of NO2 within the port area of Copenhagen. However, the impact is much greater at 50 m than at ground level with increases up to 11 μg m−3and 2 μg m−3, respectively - both concentration values are far below the European limit value. Similarly, Mocerino et al (2020) found a limited impact on air quality at ground level but an increased impact with height within the Naples port area using dispersion modelling in combination with observations.
On short-term scale, we find that the hourly limit value of 200 μg m−3 is exceeded in a few locations at 50 m height in Copenhagen port, where some of these are close to residential areas. Isolating the contribution from the growing cruise ship industry, considerable short-term influence was likewise found in Barcelona using an econometric regression model showing that when cruise ships were hotelling at berth NOx levels increased by 22% in urban Barcelona (Perdiguero and Sanz 2020). Using the dispersion model CALPUFF, impact on short-time averages of NO2 was found in Naples, where cruise ships contributed up to 86% to the hourly concentration, while annually, the cruise ship emissions increased the NO2 concentration by 3.65% (Murena et al 2018). Investigations of the plume effect from cruise ships at berth on air pollution levels in James Bay, Canada, found contributions of 57% to the maximum 1-hourly NO2 concentrations, exceeding the WHO guidelines for NO2 (Poplawski et al 2011). In our study, we likewise find the largest short-term impact arising from plume effects momentarily increasing the NOx concentrations at LQ-23 with several hundred percentages for plumes originating from the Langelinie Quay. Direct plume effects arising further away are difficult to detect for both modelled and simulated concentrations, due to the dispersion of the plumes.
In comparison to a previous study of Copenhagen port (Saxe and Larsen 2004), our findings are much more robust since we have included a more detailed spatiotemporal emission inventory and a much more refined simulation setup, allowing for an analysis of the short-term impact. Even though the correlation between observed and simulated NOx are poor, the modelled concentrations by the OML-Multi model and the observations at LQ-23 are stemming from the same distribution meaning that the simulated results are representative of the study area in terms of mean, annual, and peak values. Our findings align with previous studies across Europe indicating that the impact of cruise ship emissions is greatest on short time scales and at different heights above ground level.
In Copenhagen port, the influence of shipping emissions is very local, so far affecting a few residential and commercial neighbourhoods with only a few exceedings of the EU NO2 limit values. However, it is worth noting that the new WHO guidelines of 10 μg m−3and 40 μg m−3 for the NO2 annual mean and 24 h concentrations, respectively (WHO 2021) are exceeded, and not even the urban background concentration of Copenhagen complies. Using the danish integrated impact-pathway model system EVA (Economic Valuation of Air pollution) it was found that emissions from cruise ships in 2019 in the two biggest cities in Denmark (Copenhagen and Aarhus) resulted in 3 premature deaths and 2500 sick days with total health-related costs of 7.5 mill. €, where 1.67 mills. € of these were directly related to the emissions of NOx (Ellermann et al 2021). The short-term exposure events in 2018 in Copenhagen port will thus likewise result in health implications for the residents of the port. Further studies with reliable low-cost sensors could be used to assess the concentration exposure in greater detail to evaluate the implications of having a busy cruise ship port while at the same time expanding the city by converting the industrial part of the port to residential and commercial areas. To mitigate the health implications of the growing cruise ship industry port authorities should act by e.g., installing green shore power, and create or participate in already existing economic incentive programmes promoting sustainability in the ports.
Acknowledgments
The authors would like to thank the Danish Center of Environment and Energy, Aarhus University for partially providing funding for the completion of this work. The authors gratefully acknowledge Carsten Fuglsang, Arne Oxbøl and Ismo Koponen at FORCE technologies for sharing their measurements of NO, NO2 and NOx conducted at Langelinie quay (LQ-23) during the summer of 2018. Moreover, we would like to thank the two anonymous reviewers for their helpful and constructive comments.
Data availability statement
The data that support the findings of this study are available upon reasonable request from the authors.
Funding
The study on cruise ships and air pollution was funded by the Danish Ministry of Environment and the writing of the paper by DCE-Danish Centre for Environment and Energy, Aarhus University, Denmark, project number 34222.