

Abstract
We present and estimate a dynamic stochastic general equilibrium model for an eco-environmental damage compensation system (EDCS) with multi-stakeholder engagements. Then we explore the dynamic effect under different shocks such as household and government supervision, environmental damage compensation ratio, pollution emission threshold, and pollution control efforts. The household and government supervision show the positive effect of environmental regulation on conserving energy, abating emission, reducing damage compensation, and increasing economic output. The environmental damage compensation ratio can also contribute to energy conservation and emission reduction, but there are no significant regulation effects of pollutant emission and damage compensation. The pollutant emission threshold and the pollution control efforts have significant environmental regulation effects, but the latter does not significantly restrain high energy consumption. All the shocks mentioned above can effectively improve the green development level.
Export citation and abstract BibTeX RIS

Original content from this work may be used under the terms of the Creative Commons Attribution 4.0 licence. Any further distribution of this work must maintain attribution to the author(s) and the title of the work, journal citation and DOI.
1. Introduction
1.1. Background
In October 2020, the Office of Eco-environmental Commission in Shandong province, China, reported the implementation progress of environmental management reform, which involved 470 cases related to eco-environmental damage and determined the compensation amount of 1.619 billion yuan 1 ,2 ,3 . It has achieved full coverage of pilot reform for the first time in China. In addition, other provinces are also actively promoting and carrying out the pilot to accelerate the construction of regional ecological civilisation.
At present, China's economy and society development has gradually shifted from high-speed growth to high-quality development. The economic structure has been optimised, and industrialisation and urbanisation have significantly been improved. However, with a production structure dominated by heavy industry, improving the environment is still arduous, and eco-environmental protection has a long way to explore. Eco-environment protection is an activity to protect the natural resources, involving individuals, organizations and governments (Nguyen et al 2016). It emphasizes solving problems arising from the interaction between ecosystems and humans, including air pollution, water pollution, overuse of energy, loss of biodiversity, etc (Zeng et al 2016). Eco-environmental protection is a global issue, and each country should adopt corresponding policies to deal with it. For a long time, administrative measures taken by China have played an essential role in dealing with eco-environmental problems. For example, the pollutant discharge permit system, environmental monitoring system, and deadline control system have been adopted. However, these administrative measures only can impose limited fines and detentions on illegal enterprises. Temporary and compulsory measures lack the necessary restraint and exist the insufficiency of single governance. Although the current environmental public interest litigation and other judicial methods have made up for the above shortcomings, the litigation procedures are more complicated, severely restricting their enforcement effect. Therefore, to further improve the effectiveness of environmental regulation and make up for the shortcomings of compulsory administrative measures, the eco-environmental damage compensation system (EDCS) came into being. From the perspective of implementation purposes, it is a new type of environmental regulation measure aiming to make up for the lack of environmental laws. Its implementation will help the government break the dilemma of 'pollution caused by firms, suffered by the public, undesirable consequences bore by the government'. In 2016, the EDCS was first piloted in seven regions and achieved significant performance, including Jilin, Jiangsu, Chongqing, etc After that, it was implemented nationwide in January 2018. This system can not only make up for the shortcomings of the government's single governance, but more importantly, it can curb the illegal impulse of enterprises through economic means and then reduce the occurrence of environmental damage incidents.
Eco-environment is a kind of particular public goods, which requires to meet the needs of multiple subjects such as the public, enterprises and social organisations. Therefore, it also requires the positive actions and benign interaction of enterprises, society and government. In addition, it also needs the improvement of environmental protection consciousness and responsibility consciousness of the public and media to gradually form the circular governance model of independent emission reduction by firms, strict supervision by the government, and conscious supervision by the public and social media. From a theoretical perspective, the theory of ecological public goods and multiple co-governance systems provide a reasonable explanation and beneficial guidance for the development of EDCS. At the same time, the report of the 19th National Congress of the Communist Party of China also points out that multiple environmental governance systems should be built in which the government plays the leading role, enterprises play an essential role, and the public participates together. As a crucial measure to promote the construction of ecological civilisation, can the EDCS directly affect environmental punishment and have an indirect regulatory effect on pollution reduction and economic development ? Throughout the existing literature, the research of environmental damage compensation mainly focused on theoretical discussion (Gastineau and Taugourdeau 2014, Guan et al 2021), evaluation system construction (Chen et al 2021, Liu 2021), path improvement (Kangas and Ollikainen 2019, Cole et al 2021), etc Its economic and green development effects are rarely mentioned. Specifically, the literature reviews are shown in section 1.2.
1.2. Literature review
1.2.1. EDCS based on the theory of value
Eco-environment is a natural capital that pursues effective allocation like labour, capital, land, and other economic factors (Xin and Sun 2018, Xin 2019). The 'polluter pays principle' states that whoever is responsible for damage to the environment should bear the costs associated with it. (Taking Action, The United Nations Environmental Programme), which is consistent with the theory of ecological compensation (Gastineau et al 2021, Vaissière and Meinard 2021). The EDCS is oriented to investigate the liability for damage, strengthen the responsibility of the illegal subject, improve the illegal cost, which fully reflects the connotation of the system of severe punishment for consequences. As far as the system itself is concerned, EDCS is more represented in legal issues such as legal disputes between the claimant and the compensation subject, interest consultations, and liability attribution. At present, many scholars have studied such topics. Specifically, taking the oil spill as an example, Liu and Zhu (2014) made a detailed analysis of the legislation of EDCS and discussed how to improve the existing marine eco-environmental quality. However, the corresponding results are rarely mentioned in terms of the implementation effect and green governance effect. So, these issues need to be further explored. Based on the mentioned-above research gaps, we intend to carry out corresponding research on the implementation effect of EDCS.
1.2.2. Public goods and multi-stakeholder engagements system
Eco-environment is regarded as particular public goods. The Public Goods Theory of Marxism emphasizes that the essence of public goods lies in public welfare and its characteristics are non-competitive and non-exclusive (Oakland 1987). In addition, public goods are also products that satisfy the needs of production and life, so they have use value (Seo 2020). From the implementation principles of EDCS, damage to the eco-environment means damage to the value of public goods. So, the Public Goods Theory of Marxism provides reasonable explanation and beneficial guidance for the EDCS. Public goods have special properties such as public welfare and integrity, which determines that the governance of public goods cannot adopt a single model, and it needs to adopt a social multi-cooperative development mode. From the current research status at home and abroad, the concepts of collaborative governance, public governance, and multi-governance illustrate those mentioned-above multiple cooperative development models to varying degrees. For example, Ansell and Gash (2008) used meta-analysis methods to analyse collaborative governance in-depth, used proper cases to find the key variables that affect collaborative governance, and then elaborated their contingency model. Davies and White (2012) elaborated on the cooperative relationship between various stakeholders, including common goals and strategies, shared responsibility and resources. Besides, Tosun et al (2016) believed that co-governance is a dynamic interaction between public and private actors, and its specific forms are cooperation, competition and conflict. It is further discussed that the degree of collaboration and competition mainly depends on the existing regulatory arrangements and the consistency of different objectives.
1.2.3. Green development promoted by Multi-stakeholder engagements
As an essential concept in public management, multi-stakeholder engagement has accumulated a wealth of theoretical results and practical experience, providing a necessary reference for countries to improve their environmental governance level. Tracing back to previous literature, some scholars have analysed the multi-stakeholder engagement models, expounding the decision-making behaviour of the government, enterprises, and the public, constructing the logic of check and balance between stakeholders. Finally, the concrete practice path is given according to the practical problems. For example, Fu and Geng (2019) constructed a multi-stakeholder environmental governance system and analysed the innovative model of ecological civilisation's diversified collaborative governance, and provided new ideas for solving the conflicts of interests encountered in the process of green development. Rajesh (2020) took micro-enterprises as the research object, explored the sustainability of the supply chain by using the score of environment, society and governance, and then analysed the interest mechanism between various subjects.
In summary, multi-stakeholder engagements provide a realistic basis for accelerating the implementation of EDCS. On the one hand, the EDCS with multi-stakeholder engagements provides a coordination platform for multi-stakeholder. On the other hand, the EDCS with multi-stakeholder engagements attaches much significance to pre-prevention thought and preventive supervision. Therefore, this paper incorporates the EDCS into the multi-stakeholder engagements system and explores its operating mechanism and green development effect in line with the realistic requirements of promoting green development and promoting harmonious coexistence between man and nature.
1.3. Ideas and chapter arrangement
The main ideas of this paper are as follows. (i)We construct and estimate a dynamic stochastic general equilibrium (DSGE) model for the EDCS with multi-stakeholder engagements. (ii) We analyse the effects of different exogenous shocks on various stakeholders to explore the influence mechanism. (iii) We construct a measurement index of the green development level and expound on the governance effects of EDCS.
The remainder of the paper is organised as follows. Section 2.1 presents a DSGE model for the EDCS with multi-stakeholder engagements. First, we establish the utility function of the household, the profit function of the firm and the social welfare function of the government. Second, based on the principle of utility maximization or profit maximization, the first order optimal conditions of each subject are solved by Lagrange multiplier. Third, based on the general equilibrium framework, the market clearing model is constructed. At last, we use impulse response function to reflect the policy effects of EDCS. Section 2.2 implements the calibration and estimation of parameters. Section 3 and section 4 discuss the main results and make a sensitivity analysis. Section 5 concludes the paper.
2. Method
2.1. Model
Firstly, refer to the existing literature (Mao et al 2020), we construct a DSGE model for the EDCS with multi-stakeholder engagements, as shown in figure 1. Then, the DSGE model is used to analyse the internal mechanism among multi-stakeholders and simulate dynamic effects and the green development levels.
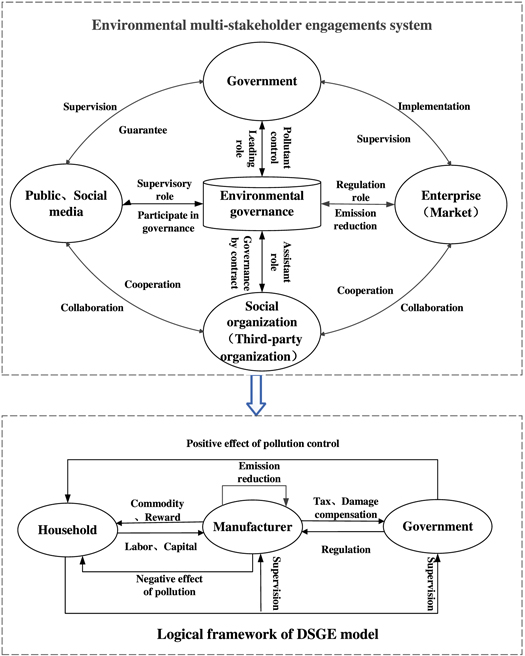
Figure 1. Analysis of DSGE's framework based on the multi-stakeholder engagements system.
Download figure:
Standard image High-resolution image2.1.1. Households
In the multi-stakeholder engagements system, households participate in the governance through damage supervision. Households' social and public influence will play an essential role in firms' emission reduction efforts and the government's environmental supervision. The transmission path of a household's participation can be summarised in two ways as follows. (i) supervise by households -- reduce emissions independently by firms -- the environment will be improved, (ii) supervise by households -- submit feedback to relevant departments -- carry out regulation measures by the government. Specifically, the transmission effect results are reflected in the household utility function through the variables of actual pollution level and government pollution control expenditure, as shown in equation (1). Referring to the existing literature (Chan 2020, Liu and He 2021), it is assumed that households are homogeneous in consumer preference, investment and saving, and they have intertemporal decision-making behaviour (Golosov et al
2014). Therefore, based on the consideration of labour supply, pollutant emission, and government's pollution control expenditure, the CRRA (Constant Relative Risk Aversion) utility function of representative households is established. The original formula of CRRA is  which is a standard analysis model based on Neoclassical economic. Therefore, refer to the existing literature (Argentiero et al
2018), we further improve the formula of CRRA and present it as follows:
which is a standard analysis model based on Neoclassical economic. Therefore, refer to the existing literature (Argentiero et al
2018), we further improve the formula of CRRA and present it as follows:

where  represents the conditional expectation operator based on period 0;
  represents the discount rate;
  represents household consumption;
  represents household labour supply;
  and
and  represent the relative risk aversion elasticity coefficients of consumption and labour, respectively;
  represents actual pollution emission The negative utility coefficient of the household;
  represents the positive utility coefficient of the government expenditure on pollution control to households.
Based on the comprehensive consideration of household consumption, investment, labour remuneration, and capital gains, the budget constraints of the household sector are expressed as follows:

where  represents the actual investment of the family, which mainly includes productive investment;
  represents unit labour compensation;
  represents capital;
  represents the rate of return on capital.
In addition, the capital accumulation equation of the household sector can be written as equation (3). By combining equations (2) and (3), the budget constraint equation of the household sector can be further written as the following equation (4):


On the premise of satisfying the maximisation of household utility, rational choices are made based on consumer preferences, capital accumulation equations and budget constraint balance relationships, and the optimal decisions for household behaviour are made. Assuming that the marginal utility of wealth  is the Lagrange multiplier, then construct the Lagrange function shown in equation (5) to obtain the optimal allocation condition of the household sector.

By solving the optimisation problem of the household sector, the following first-order conditions can be obtained:


In equation (6),  represents the marginal utility of household consumption, equation (7) is the optimal labour supply in the household sector, and equation (8) represents that the marginal utility of household consumption in the current period is equal to the discounted value of utility brought about by consumption in the next period.
2.1.2. Firms
The firm's goal is to maximise profit, and its profit per period is the difference between revenue and cost. When the price is normalised to 1, the firm's revenue equals its output. Firms carry out production activities under the conditions of technology, labour, and capital. Refer to the Cobb-Douglas function to set the firm's output function as follows:

where 

 and
and  represent the technical level, capital, labour supply, and resource input of the firm, respectively;
  and
and  are the output elasticity of capital and the output elasticity of labour, respectively;
  is regarded as an exogenous shock, which satisfies the first-order autoregressive process, namely:

where  represents the first-order autoregressive coefficient of the technical level,
  represents the steady-state value of the technical level, and
  satisfies
The EDCS usually punishes firms or individuals who cause environmental damage. To simplify the model, firms are mainly responsible for compensation, and the government's supervision objects are also firms. Generally, firms may cause environmental damage to rivers, lakes, soil, atmosphere and so on, which results in the deterioration of eco-environmental quality. Referring to the previous research (Annicchiarico and Di Dio 2015), the pollutant emission level is positively correlated with the firm's current output  so the pollution level can be expressed as
  and
and  represents the pollution proportion based on production.
Firms that cause environmental damage shall be liable for compensation, and the responsibility for restoring eco-environmental damage shall be actively fulfilled. In addition, the system stipulates that the obligee of compensation makes repairs by himself or a third party. The obligor of compensation shall bear the expenses for the investigation and evaluation. Suppose the eco-environment damage caused by the obligor of compensation cannot be repaired. In that case, the compensation fund shall be used as the government's non-tax revenue, which shall be turned over to the local treasury in total and included in the local budget management. Based on this, it is assumed that the EDCS is regarded as an exogenous environmental regulation shock. Some firms, who do not actively carry out environmental governance or fail to reach the emission standards, need to bear the corresponding compensation liability. Therefore, the shock of EDCS may force firms to conduct eco-environmental government to avoid damage compensation liability. In this paper, we assume that the firm's emission reduction efforts  the emission reduction amount
  and the final pollution emissions
  are negatively correlated, and the firm's compensation expenditure
  and compensation ratio
  are positively correlated. So, the pollutant emission amount
  can be expressed as equation (11), the emission reduction amount
  can be defined as equation (12), and the compensation expenditure
  can be expressed as equation (14).


where  represents the environmental supervision of the public and government departments. Suppose it is an exogenous shock and satisfies the first-order autoregressive process, as shown in equation (13).

where  represents the first-order autoregressive coefficient of environmental supervision;
  represents its steady-state value;
  satisfies

Under the EDCS, the damage compensation of the firm is related to the degree of pollution, as shown in equation (14). When the pollutant emission is higher than the threshold  the firm needs to pay compensation to the government. When the pollutant emission is lower than the threshold
  the firm will conduct regular independent emission reduction efforts to reach the qualified standard.
  is an environmental rule set by the government, regarded as an exogenous restraint shock to firms. If the actual pollution discharge is higher than the threshold, the firm shall compensate for the excess part. The local environmental protection department usually determines the compensation ratio
  jointly with a third-party assessment agency, which is regarded as an exogenous random variable. Specifically, the first-order autoregressive equations of
  and
and  are set as follows:


In addition, referring to the research of Annicchiarico and Di Dio 2015, it is assumed that the cost of pollutant control by firms satisfies the following conditions:

Where  and
and  are the technical parameters of pollutant control cost.
Therefore, the firm's profit function based on the principle of profit maximisation can be expressed as:

where  represents the output tax rate;
  represents the unit labour remuneration;
  represents the price of resource elements;
  is regarded as an exogenous shock, subject to the first-order autoregressive process shown in equation (19);
  represents its steady-state value, and
  satisfies

Based on the above conditions, the first-order conditions that firms need to meet to achieve optimal decision-making are as follows:


2.1.3. Government
To simplify the model, we assume that the government's income includes tax and eco-environmental damage compensation from firms, while the expenditure consists of the pollutant supervision and governance expenditure. The above two aspects constitute the balance of payments function, as shown in equation (24). In addition, based on the relevant theories of welfare economics, the social welfare function is defined as: under the condition of meeting the government's balance of expenditures, the utility of households and firms is considered optimal, as shown in equation (25).


Where  represents government tax revenue;
  represents the ratio of pollutant control expenditure to tax revenue, which reflects the government's pollution control efforts to some extent. It is also an exogenous shock that satisfies the first-order autoregressive process shown in equation (26),
  represents its steady-state value, and
  satisfies

Finally, the following Lagrange function shown in equation (27) is constructed based on equations (24) and (25). The first-order optimal condition of government pollution control expenditure is obtained, as shown in equation (28).


2.1.4. The level of green development
According to the previous analysis, EDCS is a new environmental regulation system in environmental law. It aims to improve the eco-environmental quality through punishment and force firms to independently reduce pollutant emissions, thereby enhancing the level of green development. Innovation, coordination, green, openness, and sharing in China constitute five development concepts that play an increasingly important role in economic and social development. Green development and the other four concepts are interdependent and synergistic, involving resource utilisation, production, living, environmental governance, and other aspects. According to Fang et al (2020) and Weng et al (2020), we integrate decision variables of the DSGE model into the green development system to form a measurement index system, which includes input, pollution emission, pollution control expenditure, household consumption, per capita income, labour force, and economic output. Specific measurements of indicators are shown in table 1.
Table 1. The composite indicator system of green development level.
| Composite indicator | First indicator | Second indicator | Measurements |
|---|---|---|---|
| Green development level(Q) | Resource input(S) | Energy consumption per unit of GDP | Energy consumption/GDP |
| Water consumption per unit of GDP | Water consumption/GDP | ||
| Electricity consumption per unit of GDP | Electricity consumption/GDP | ||
| Pollutant emission (CE) | Wastewater discharge per unit of GDP | Wastewater discharge/GDP | |
| Waste gas emissions per unit of GDP | SO2 emissions/GDP | ||
| Waste emissions per unit of GDP | Industrial waste discharge/GDP | ||
| Pollution control expenditure (G) | Wastewater treatment expenditure per unit of GDP | Wastewater treatment expenditure/GDP | |
| Waste gas treatment expenditure per unit of GDP | Waste gas treatment expenditure/GDP | ||
| Waste treatment expenditure per unit of GDP | Waste treatment expenditure/GDP | ||
| Resident consumption (C) | Per capita consumption expenditure | Consumption expenditure/total population | |
| Per capita income(W) | Per capita wage income | Total income of urban and rural residents/number of the labour force | |
| Labor(N) | Labour amounts | Urban and rural labour amounts | |
| Total output(Y) | GDP per capita | GDP/total population |
The green development level index is the key variable of this paper, which expands the traditional DSGE model and represents the green governance effect of EDCS. Therefore, based on the above indicator system of green development level, we construct a linear model as shown in equation (29). Among them,  represents green development level,
  represent the weight of each decision-making variable in turn.

2.1.5. Market clearing
Based on the general equilibrium theory, when stakeholders satisfy the optimal decision, the output market, labour market, and capital market will reach a common equilibrium, and the state of market clearance will be formed simultaneously.

2.1.6. Parameters calibration and estimation
In this paper, parameters are assigned in the following ways: First, static parameters need to be calibrated based on the previous literature. Second, dynamic parameters need to be calibrated using Bayesian estimation based on China's actual economic data. Third, use China's macroeconomic data to estimate the weight coefficient of the indicator system of green development level.
2.1.7. Calibration of static parameters
Static parameters include the subjective discount rate  the relative risk aversion elasticity of household consumption and labour supply
  and
and  the capital-output elasticity
  the labour output elasticity
  the capital depreciation rate
  the pollution emission coefficient per unit of output
  and the emission reduction cost parameters
  and
and  The specific parameter calibration values and references are shown in table 2.
Table 2. The results of static parameters calibration.
| Parameter | Meaning | Value | References |
|---|---|---|---|

| Discount coefficient | 0.95 | Refer to Punzi (2019) |

| Relative risk aversion coefficient of consumption | 0.8 | Refer to Li and Peng (2020) |

| Relative risk aversion coefficient of labour | 3 | Refer to Xiao et al (2018) |

| Capital depreciation rate | 0.11 | Refer to Chan (2019) |

| Capital elasticity coefficient | 0.6 | Refer to Pan et al (2020) |

| Labour elasticity coefficient | 0.3 | Refer to Pan et al (2020) |

| Pollutant emission coefficient per unit | 0.16 | Refer to Annicchiarico and Di Dio (2015) |

| Abatement cost parameters | 0.185 | Refer to Annicchiarico and Di Dio (2015) |

| Abatement cost parameters | 2.8 | Refer to Annicchiarico and Di Dio (2015) |
2.1.8. Estimation of dynamic parameters
In this section, we select output and consumption as external observation samples. The original data comes from the National Bureau of Statistics and China Economic Network database from 2000 to 2018. We use MATLAB to estimate dynamic parameters, including the negative utility coefficient of pollutant emission, the positive utility coefficient of government's expenditure in pollution control, the first-order autoregressive coefficients, and the random error terms of each exogenous shock. According to the estimation result of previous literature and the characteristics of policy shocks, we set the prior mean value of the first-order autoregressive coefficient as shown in table 3. We refer to the previous research (Smets and Wouters 2007, Khan and Tsoukalas 2009). In addition, this paper sets the first-order autoregressive parameters to obey the Beta distribution, and the random fluctuation term follows the Inv. Gamma distribution, the specific estimation results are shown in table 3, and the corresponding prior distribution and posterior distribution are shown in figure 2.
Table 3. Bayesian estimation results of dynamic parameters.
| Parameter | Parameter description | Prior mean | Prior distribution | Posterior mean | Confidence interval |
|---|---|---|---|---|---|

| Negative utility coefficient of pollutant emissions | 0.300 | Normal | 0.3006 | [0.2853,0.3165] |

| Positive utility coefficient of pollution control expenditure | 0.120 | Normal | 0.1231 | [0.1087,0.1388] |

| First-order autoregressive coefficient of technology | 0.350 | Beta | 0.3796 | [0.3462,0.4119] |

| First-order autoregressive coefficient of resource price | 0.300 | Beta | 0.2991 | [0.2665,0.3344] |

| First-order autoregressive coefficient of the firm's compensation ratio | 0.300 | Beta | 0.3027 | [0.2690,0.3356] |

| First-order autoregressive coefficient of household and government supervision | 0.300 | Beta | 0.2968 | [0.2573,0.3277] |

| First-order autoregressive coefficient of pollutant emission threshold | 0.300 | Beta | 0.3014 | [0.2730,0.3336] |

| The first-order autoregressive coefficient of government's pollution control efforts | 0.300 | Beta | 0.2993 | [0.2690,0.3383] |

| Random disturbance term of technology | 10 | Inv. Gamma | 9.7921 | [7.5364,12.1308] |

| Random perturbation term of resource price | 1 | Inv. Gamma | 0.7438 | [0.2937,1.3194] |

| Random disturbance term of firm's compensation ratio | 1 | Inv. Gamma | 0.9321 | [0.2947,1.6001] |

| Random disturbance term of household and government supervision | 1 | Inv. Gamma | 0.6772 | [0.2867,1.0976] |

| Random disturbance term of government's pollution control efforts | 24 | Inv. Gamma | 23.7556 | [21.1098,26.1274] |

| Random disturbance term of pollutant emission threshold | 1 | Inv. Gamma | 1.0522 | [0.2767,2.2944] |

Figure 2. Prior and posterior distribution diagram in Bayesian estimation.
Download figure:
Standard image High-resolution image2.1.9. Coefficient estimation of green development level
According to equation (29), the indicator system of the green development level includes seven variables: output, consumption, resource input, labour, pollution control expenditure, and pollutant emission. The data are from China Statistical Yearbook, China Environmental Statistical Yearbook, and China Energy Statistical Yearbook from 2000 to 2018. As some variables involve secondary indicators, we intend to use the standardisation method to carry out dimensionless indicators of each dimension and then use the entropy method to get the contribution weight for indicators of each dimension. Finally, use the linear weighted method to work out the overall green development level. Specifically, the estimation results of correlation coefficients are shown in table 4.
Table 4. The weight coefficient estimation results of green development level.
| Parameter |

|

|

|

|

|

|

|
|---|---|---|---|---|---|---|---|
| Weights | 0.1079 | 0.0709 | 0.0799 | 0.2276 | 0.2388 | 0.0545 | 0.2204 |
3. Results and discussions
In this section, the theoretical model is dynamically simulated using parameter calibration. Because the model involves multiple variables and exogenous shocks, a large number of simulation results are produced. To emphasise the focus of this paper, we only show the detailed analysis of four shocks of EDCS, and specific impulse response functions (IRFs) are as follows:
3.1. IRFs of household and government supervision
As mentioned above, the shock of household and government supervision represents the degree of environmental regulation. Given the positive regulatory shock, we find that it positively affects firms' energy-saving and emission-reduction behaviour. Meanwhile, IRFs of output and pollutant emission also reflect the promoting effect of environmental regulation on economic development.
Specifically, we analyse the dynamic mechanism as follows: (i) In terms of direct effects, the shock of household and government supervision will positively or negatively affect variables such as resource input, pollutant emission, and emission reduction efforts. Besides, household supervision pressure and the government may force firms to carry out green production activities. On the one hand, they may reduce pollutant emissions by improving technology or updating equipment to reach the purpose of avoiding punishment. On the other hand, advanced technology can improve the total factor productivity to obtain a higher output level. The specific changes are shown in figure 3. (ii) In terms of indirect effects, a firm's investment in advanced equipment will increase the capital stock, while technological innovation and scale effects may lead to a decrease in labour demand in some industries and change the distribution structure of factors. Finally, a higher level of output will increase workers' wages and stimulate household consumption demand. In general, household and government supervision can urge firms to reserve energy, reduce emissions, and promote the coordinated development of the economy and environment.
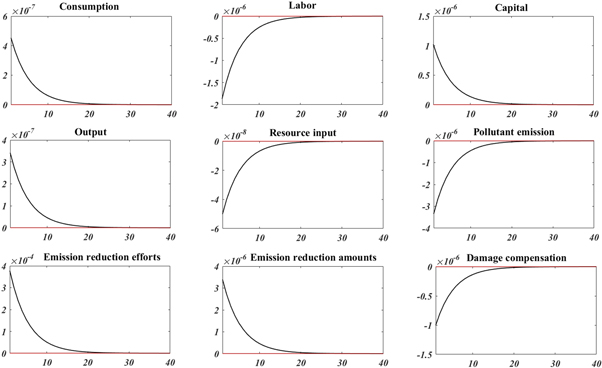
Figure 3. IRFs of household and government supervision.
Download figure:
Standard image High-resolution image3.2. IRFs of firm's compensation ratio
In section 3, we have briefly explained the firm's compensation ratio, which is usually determined jointly by the local environmental protection department with a third-party assessment agency. Firms whose pollutant emissions exceed the threshold shall be responsible for environmental damage. Given a positive compensation ratio shock of a unit, we find that firms play an important role in resource input, emission reduction efforts and total output, and so on. However, the change effect of pollutant emissions is not significant, and the corresponding damage compensation is still increasing. According to the above results, we make the following analysis: From the IRFs of partial variables, the shock of compensation ratio makes firms positively respond when facing environmental regulation. For example, increasing investment in technology can transform energy-intensive production patterns, promote energy conservation and emission reduction. Meanwhile, the scale effects of technological innovation can also promote economic growth, as shown in figure 4.
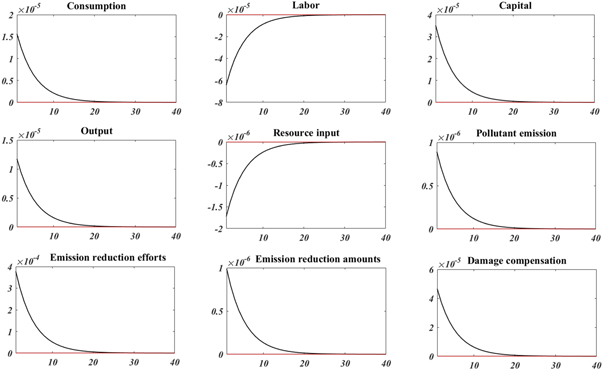
Figure 4. IRFs of firm's compensation ratio.
Download figure:
Standard image High-resolution imageHowever, the IRFs of pollutant emissions did not achieve the expected negative effect, and the corresponding damage compensation expenditure also increased gradually. Based on this, we make a possibility analysis of the results: On the one hand, there is a directly proportional relationship between output and pollutant emissions, but their changes are relative. For example, although the pollutant emission keeps rising with the short term's increase in output, the relative ratio may have decreased. On the other hand, based on the principle of profit maximisation, firms usually make a trade-off between compensation cost and output growth, which can easily lead to the speculative behaviour of paying penalties in exchange for higher output. As a result, the pollutant emissions level is still high. Therefore, the government should comprehensively consider various factors and set a reasonable compensation ratio to achieve the positive effects of environmental regulation. Finally, the indirect effect analysis of consumption and labour is similar to household and government supervision shock.
3.3. IRFs of pollutant emission threshold
Based on the model set, the firm's compensation is jointly determined by pollutant emission amounts and threshold, and the firm whose pollutant emission exceeds the threshold will be punished. Therefore, the IRFs of pollutant emission threshold also represent a kind of environmental regulation effects. As shown in figure 5, when the government sets the pollutant emission threshold, the firms may carry out corresponding emission reduction activities to prevent the pollutant emission from exceeding the standard and change their energy-intensive production mode to avoid punishment. In addition, the shock of pollutant emission threshold will also have an indirect impact on output, consumption, capital, and other macro variables, showing the positive effect of environmental regulation. Its analysis is similar to the above so that we won't repeat them.
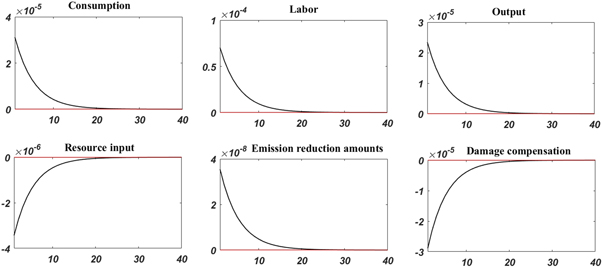
Figure 5. IRFs of pollutant emission threshold.
Download figure:
Standard image High-resolution image3.4. IRFs of government's pollution control efforts
The EDCS was proposed based on the background of multiple environmental co-governance. According to the implementation effects, households, firms, and government participate in environmental governance differently. In this section, we briefly analyse the shock of the government's pollution control efforts. From the perspective of direct effects, given a positive shock of a unit, the government's pollution control expenditure will increase significantly. Based on the previous model setting, we can see that government pollution control expenditure is used to control pollutants and supervise firms' production activities. Therefore, the shock will positively affect emission reduction, as shown in figure 6.

Figure 6. IRFs of government's pollution control efforts.
Download figure:
Standard image High-resolution imageTo some extent, the intensity of pollution control represents the government's preference for environmental quality. It means that the government needs to use more tax revenues for governance, resulting in trade-offs between environmental quality and economic growth. Therefore, under the shock of the government's pollution control efforts, factor input and economic output are uncertain, promoting or inhibiting. For example, this shock can increase economic production while promoting emission reduction, but the effect of restraining firms' high energy consumption is not significant, and the reasons for this result need to be further explored. Finally, increasing the government's pollution control efforts may restrain consumption demand to some extent, contrary to the effects of the mentioned-above shocks. Based on relevant literature, we make the following reasonable explanation: (i) the expenditure of pollution control is a part of fiscal expenditure. Its increase may reduce public social spending and transfer payment, which will have a specific inhibitory effect on household income and consumer demand. (ii) Referring to Stern (2000), we believe that increasing the government's pollution control efforts may improve the household's environmental protection awareness and promote the transformation of consumer demand to investment demand.
3.5. Analysis of green development level
As can be seen from figure 7, four shocks can effectively improve the level of green development. Specifically, we analyse the influence mechanism of green development level as follows: (i) For firms, the implementation of EDCS will directly affect their emission reduction efforts and pollutant emission level. Meanwhile, the forcing effect of environmental regulation will indirectly affect macro variables such as output, resource input, capital, etc In other words, firms may promote the coordinated development of the economy and environment through green production and ultimately boost the improvement of green development level; (ii) Household and government supervision will prompt firms to pay more attention to their emission reduction. In this way, it can easily break through the previous single governance model and gradually resolve the dilemma of 'pollution caused by firms, suffered by the public, undesirable consequences bore by the government'. Besides, the government sets pollutant emission standards to punish firms who exceed the standards, forcing them to carry out energy conservation and emission reduction to promote green production.
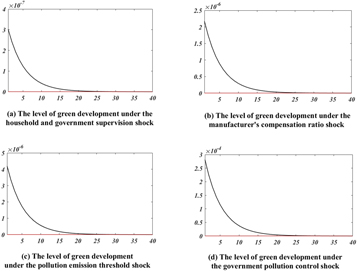
Figure 7. IRFs of green development level under various exogenous shocks.
Download figure:
Standard image High-resolution imageIn summary, regardless of the perspective of a single variable or composite green development level, EDCS has achieved significant environmental regulation effects. The policy was piloted in seven provinces in 2016 and implemented nationwide in 2018, which only experienced three years. So, there are some shortcomings when using actual data to estimate the parameters, which leads to the indistinctive results of individual variables. However, from the current implementation process of all provinces in China, the EDCS has achieved noticeable governance results in pollution control and restoration, damage compensation, environmental regulation, and other aspects, which also verifies the effectiveness of dynamic simulation in this paper.
4. Sensitivity analysis
Due to the limited space of this article, we only conduct sensitivity analysis under household and government supervision shock and firm's compensation ratio shock. Specifically, we analyse the dynamic change results of related variables when the exogenous shock fluctuates by 25%. As shown in figures 8 and 9, further strengthening household and government supervision or increasing the firm's compensation ratio will result in varying changes in single or composite indicators. Similarly, weakening or reducing the exogenous shock will have the opposite trend, showing that the model has passed the sensitivity test.

Figure 8. The sensitivity analysis of household and government supervision.
Download figure:
Standard image High-resolution image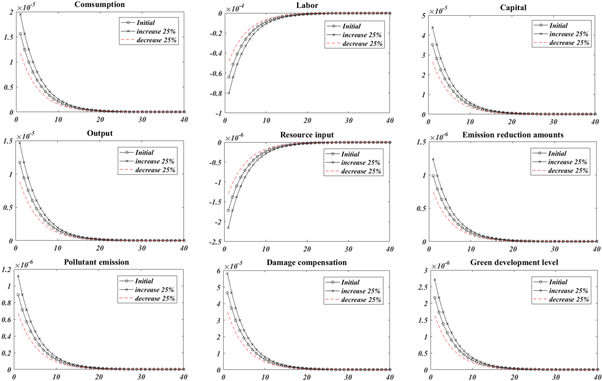
Figure 9. The sensitivity analysis of manufacturer's compensation ratio.
Download figure:
Standard image High-resolution image
5. Conclusions and recommendations
In the context of multi-stakeholder engagements, we explored the interest consensus mechanism in implementing the EDCS and then constructed a DSGE framework to test the dynamic effects and green development level. Based on the results, we can draw the following conclusions:
First, firms tend to pay more attention to their emission reduction behaviours under household and government supervision shocks. On the one hand, firms can reduce resource dependence and pollutant emission by increasing environmental protection investment to avoid punishment. On the other hand, the progress of environmental protection technology can bring a higher output level and then have an indirect effect on consumption and labour.
Second, the damage compensation ratio set by the government has increased economic output while promoting energy conservation and emission reduction by firms. However, due to the large output base, the inhibitory effect of actual pollution emissions is not significant.
Third, both the pollutant emission threshold and the government's pollution control efforts under the EDCS have significant environmental regulation effects, but the latter is not significant in restraining high energy consumption. In summary, four kinds of regulation methods under the EDCS have shown the positive effects of environmental regulation and green development transformation.
Based on the conclusions, we propose the following suggestions. First, advocate the environmental protection concept of multi-stakeholder engagement, and gradually form a circular model of 'reduce emissions independently by firms, regulate strictly by government, and supervise consciously by the public and social media'. On the one hand, it can better regulate the pollutant emission behaviour of firms. On the other hand, it helps alleviate the dilemma of 'pollution caused by firms, suffered by the public, undesirable consequences bore by the government'. Second, relevant institutions should set a reasonable pollution emission threshold and compensation ratio to prevent enterprises exceeding the emission limit. In addition, the government should correctly weigh the relative changes between economic output and actual pollutant emission to prevent speculative behaviour of firms. Third, strictly control the damage compensation work of enterprises that exceed the emission standards, reasonably include compensation income into pollution control expenditures, and strive to achieve environmental fairness and justice.
In general, this paper evaluates the multiple co-governance effect of EDCS from the perspective of DSGE, and obtains some meaningful conclusions. However, there are still some limitations in this paper, which are detailed as follows: (1) Considering the availability of data, we only select limited indicators for parameter calibration and Bayesian estimation, which may affect the accuracy of estimation results; (2) In fact, the indicator system of green development level needs to be constructed from multiple dimensions, involving complex sub-indicators. However, in order to match the key variables of DSGE model, we only select the limited indicators to represent the level of green development, which may affect the real policy effect. In the future, we will collect more comprehensive indicators and data to solve these problems.
Based on the above limitations, we intend to use empirical methods to further study the policy effects of EDCS in the future. From the perspective of policy evaluation methods, quasi-natural experimental methods are playing an increasingly important role in empirical fields, such as Synthetic Control Method (SCM). SCM is a new policy evaluation method proposed by Abadie and Gardeazabal (2003), its basic idea is to take the pilot area as the treatment group, and constructs a 'counterfactual' synthetic control unit for each pilot area through weighted average, and simulates the 'counterfactual' results. Then, we can compare the difference between the treatment group and its 'counterfactual' synthetic control group after policy implementation, that is, the policy effects. So, refer to the 'counterfactual' framework, we can try to use SCM to evaluate the policy effects of EDCS in seven pilot provinces in China.
Acknowledgments
The authors would like to sincerely thank all the anonymous referees for their insightful comments. In addition, we acknowledge that the work is partly supported by the National Office of Philosophy and Social Sciences of China (No. 21BJY206).
Data availability statement
All data that support the findings of this study are included within the article (and any supplementary files).
Declarations
Ethical approval
Not applicable
Consent to participate
Not applicable
Conflict of interest
The authors declare no competing interests
Footnotes
- 1
- 2
- 3
Full text of Xi Jinping's report at 19th CPC National Congress - China - Chinadaily.com.cn http://www.chinadaily.com.cn/china/19thcpcnationalcongress/2017-11/04/content_34115212.htm.