Abstract
The first observation of Intermediate Coupling effects in the occupied 5f states has been made using x-ray Emission Spectroscopy (XES). In the past, the impact of Intermediate Coupling of the 5f states in actinides has long been observed and quantified, using x-ray Absorption Spectroscopy (XAS) to probe the unoccupied 5f states, providing great insight into the enigma of 5f electronic structure. However, no measure of its effects in the occupied states had been reported before this. Moreover, because the 5f occupied states in UF4 are almost completely of 5f5/2 character, the observed effect in XES is twice that in XAS for UF4.

Original content from this work may be used under the terms of the Creative Commons Attribution 4.0 licence. Any further distribution of this work must maintain attribution to the author(s) and the title of the work, journal citation and DOI.
1. Introduction
Actinide 5f electronic structure remains a conundrum, despite both massive effort and significant recent progress. Earlier, based upon atomic volumes, it was believed that the Actinide Series was a 6d filling series [1]. Subsequently it was shown that the Actinide filling was 5f, not 6d [2]. Following these foundational developments, it was demonstrated that Russell-Saunders coupling fails in Pu [3] and that Intermediate Angular Momentum Coupling [4] can be used to explain the large changes in Branching Ratios observed in going across the light actinide series. (Intermediate Angular Momentum coupling is an angular momentum coupling scheme which lies between the two simple limits of Russell-Saunders and jj-coupling [3, 4].) These x-ray Absorption Spectroscopy (XAS) measurements illustrated that total angular momentum coupling in the 5f states is a crucial piece of the puzzle and that Intermediate Coupling is the correct scheme. In parallel with the XAS investigations, another important piece of the puzzle was found. For several years, many theoretical approaches to the calculation of 5f electronic structure overestimated the degree of 5f delocalization: only by applying the artificial construct of 5f magnetic order to Density Functional Theory (DFT) was it possible to get agreement between the computationally obtained interatomic distances and the experimentally determined results for all six of the solid phases of Pu [5]. Shortly thereafter, it was demonstrated that Dynamical Mean Field Theory (DMFT) electron correlation could be used to model the 5f electronic structure and obtain agreement with experiment, without the invocation of long range magnetic order [6]. The mixed configuration approach put forward in the DMFT picture was supported by Resonant x-ray Emission Spectroscopy results [7]. Following this, neutron spectroscopy provided further experimental evidence in support of the DMFT model [8], but questions remain regarding the exact nature of the 5f electron correlation and the populations projected by the mixed configuration modelling [9, 10].
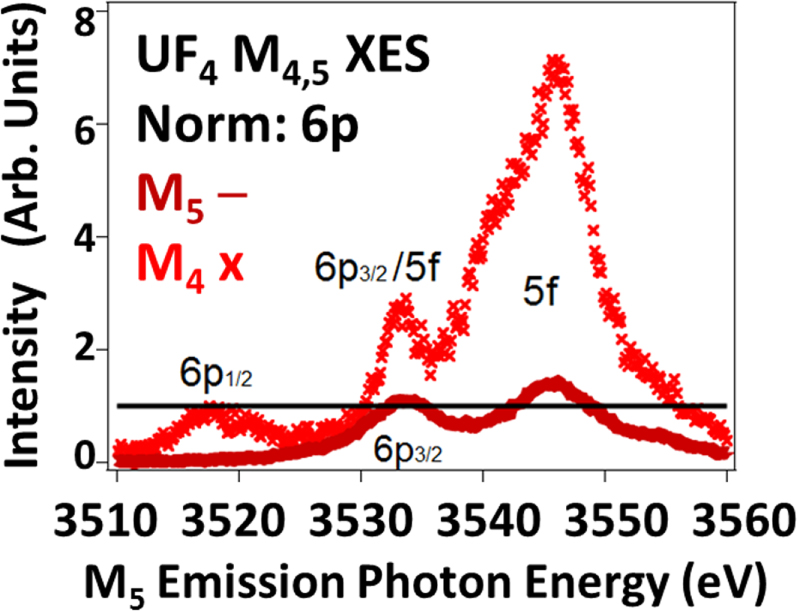
Thus, the impact of Intermediate Coupling has been successfully monitored using XAS as a probe of the U5f Unoccupied Density of States (UDOS) [3, 4, 11]. These effects manifest themselves as a strong variation of the Branching Ratios (BR) as a function of atomic number and 5f occupation, driven by electric dipole selection rules. (BR = Id5/2/(Id5/2 + Id3/2) = 1/(1 + Id3/2/Id5/2)) Here, for the first time, the corresponding effect is reported for the 5f Occupied Density of States (ODOS), using U M4,5 valence x-ray Emission Spectroscopy, as shown in figure 1. In fact, because of the high purity of the 5f ODOS (predominantly 5f5/2) the M4:M5 intensity ratio, i.e. Id3/2/Id5/2, is very large, on the scale of a factor of 5. This ratio is over twice the value of the N5:N4 peak ratio (∼2) that underlies the reported XAS Branching Ratio of UF4 of 0.68 [11, 12]. Below, the analysis process will be discussed, including the comparison to FEFF calculations [13–16], normalization via the 6p XES features and peak fitting for the extraction of intensities. FEFF is a data analysis program used in x-ray absorption spectroscopy and related techniques, including self-consistent real space multiple-scattering code for simultaneous calculations of x-ray-absorption spectra and electronic structure, particularly for EXAFS, as will be discussed below.
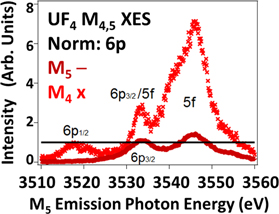
Figure 1. Shown here are the M4 (3d3/2 hole) and M5 (3d5/2 hole) XES spectra of UF4. The spectra have been normalized to the M4 6p1/2 (p1/2 → d3/2, Δj = 1) and M5 6p3/2 (p3/2 →d5/2, Δj = 1) peaks. Note the very large enhancement of the 5f peak in the M4 spectrum relative to that of the M5 spectrum. Red X = M4. Dark red line = M5. Black line = unity (1) for 6p normalization. The M4 spectrum has been shifted -181 eV to align the peaks on the M5 energy scale. 6p1/2 :6p3/2 intensity ratio = 0.8, following the electric dipole cross sections. See text for details.
Download figure:
Standard image High-resolution image2. Experimental
The experiments were performed on Beamline 6–2a at the Stanford Synchrotron Radiation Lightsource, using a Si(111) monochromator and a high-resolution Johansson-type spectrometer [17, 18] operating in the tender x-ray regime (1.5–4.5 keV). The total energy resolution of this XES experiment is ∼1 eV, but the spectral widths are dominated by the lifetime broadening (several eV) of the 3d core holes. The excitation photon energies for the UO2 M5, UF4 M5 and UF4 M4 were 3640 eV, 3650 eV and 3820 eV, respectively. Each of these excitation energies was chosen to be well above threshold for the corresponding transition. The samples used were the same as those used in earlier RXES, XAS and HERFD studies [11, 18]. Oxidation and sample corruption can be a problem with uranium samples, but that was not an issue here, in part because both samples were already oxidized by either oxygen or fluorine. U M4,5 Extended x-ray Absorption Fine Structure (EXAFS) measurements beyond the main (whiteline) absorption features were used as a method to monitor the oxidation condition and sample composition. Although similar, the EXAFS of these two compounds with isoelectronic U 5f2 sites, UF4 and UO2, are easily differentiated, consistent with earlier studies [11, 18]. The x-ray Photoelectron Spectroscopy data used for comparison came from an earlier study of a very pure sample, as described elsewhere [19, 20].
3. Results and discussion
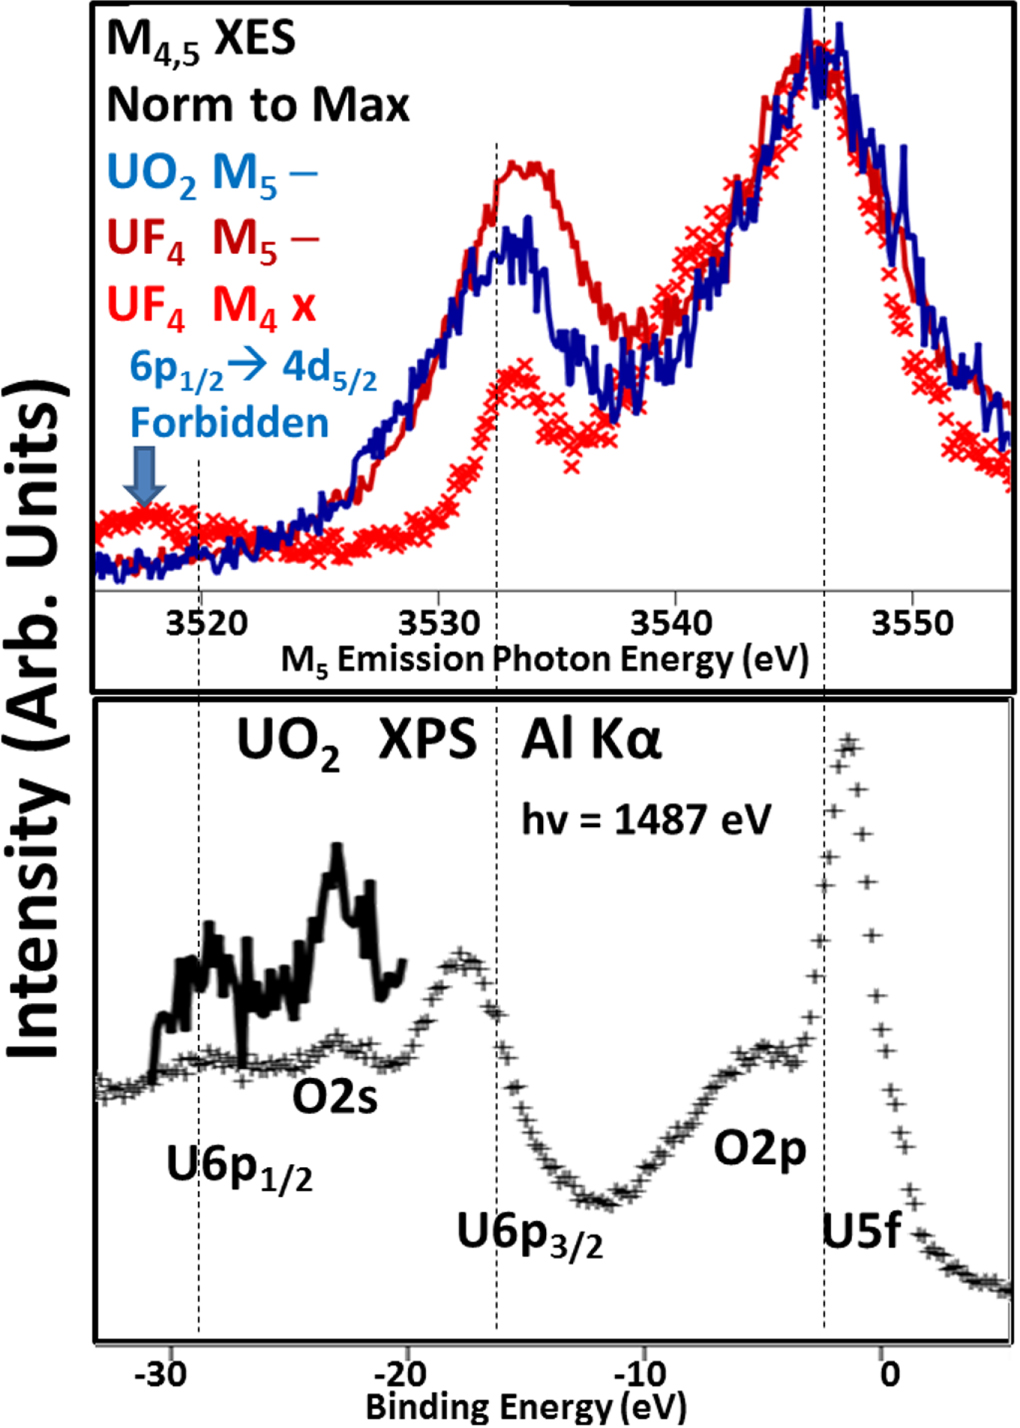
As can be seen in figure 2, the three main XES features correspond to U5f, U6p3/2 and U 6p1/2 transitions. Because the three processes involve different core hole states (XPS-none, M4 3d3/2 and M5 3d5/2), there will be some small differences in terms of relative peak positioning due to factors such as shielding. Nevertheless, it is clear that the largest feature is the U5f with smaller U6p3/2 and U 6p1/2 peaks. As expected for U 5f2 isoelectronic materials, the M5 XES of UO2 and UF4 are very similar, bordering on being identical. It is of interest that there is no M5 6p1/2 peak, consistent with the electric dipole selection rule that forbids a ½ → 5/2 transition. Selection rules and cross sections will be discussed further below.
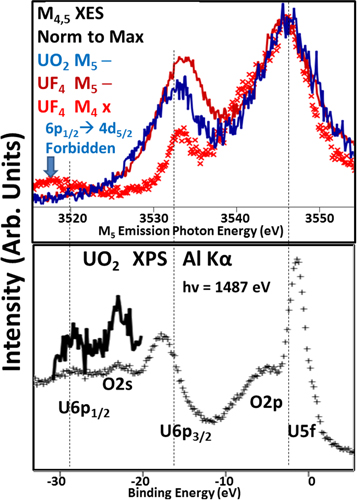
Figure 2. Comparison of XES and XPS. Upper Panel: The M4,5 XES is shown here, with normalization to the largest feature, the U 5f peak. Blue Line: UO2 M5; Red Line: UF4 M5; Red X: UF4 M4, shifted -181 eV to be on the same energy scale as the M5 spectra. Lower panel: UO2 XPS using AlKα (hv = 1487 eV) as the excitation. Black +: regular spectrum. Black Line: Blowup of the U6p1/2 and O2s region. XPS is not element selective, so O2p and O2s features are also present. The O2p and U5f will have significant intermixing [21]. Similar XPS spectra can be found for UF4 [22, 23.].
Download figure:
Standard image High-resolution imageBecause of the greater energies involved with x-ray transitions and the variation of which core hole is the underlying cause of the subsequent x-ray emission, the simplistic approaches used in N4,5 XAS Branching Ratio analyses need to be supplemented by spectral simulations that include more sophisticated modelling. One approach is the utilization of FEFF [13–16], a powerful simulator built upon a Green’s Function platform. FEFF is a data analysis program used in x-ray absorption spectroscopy and related techniques, including self-consistent real space multiple-scattering code for simultaneous calculations of x-ray-absorption spectra and electronic structure, particularly for EXAFS. Here, the UF4 solid will be modelled with a UF4 molecule, with tetrahedral symmetry (like methane, CH4) and utilizing interatomic U-F distances extracted from an EXAFS analysis of the bulk UF4 [24]. This model is particularly over-simple: it puts the U in an environment surrounded by Fluorines, but the symmetry is wrong. Bulk UF4 is not tetrahedral, but instead monoclinic with two distinct U sites. Nevertheless, significant insight can be gained from the comparison of the simulation and the experiment. The results of the calculation can be seen in figures 3 and 4.
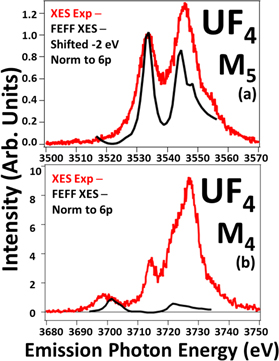
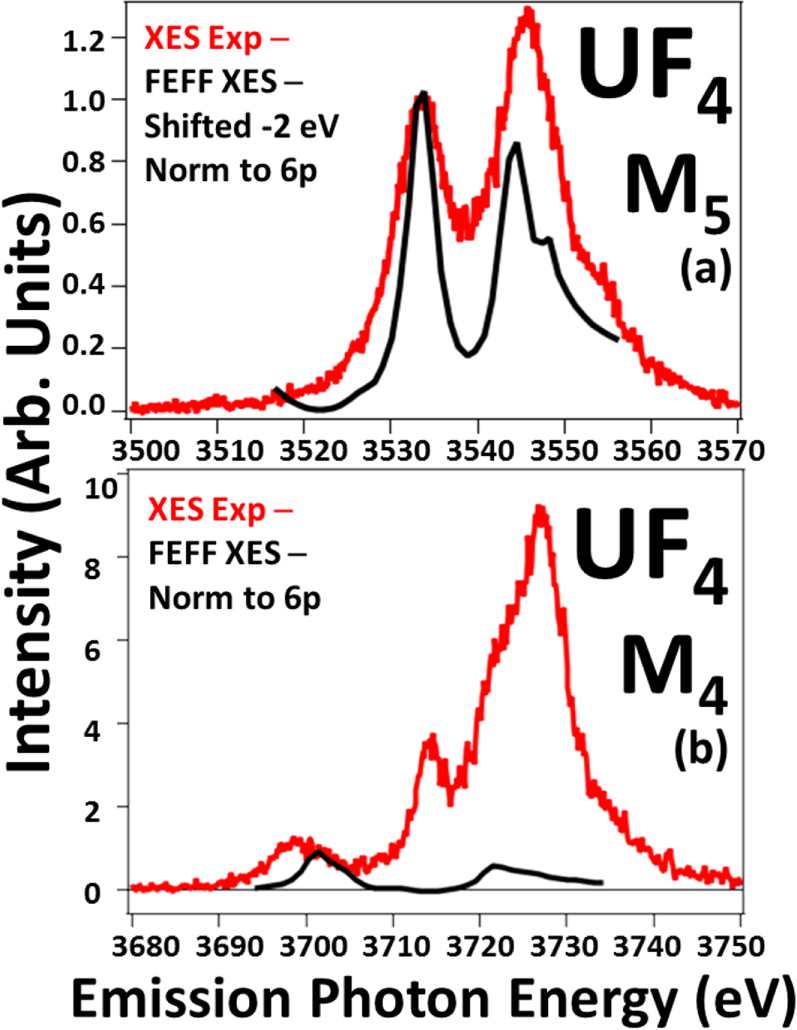
Figure 3. The comparison of the UF4 M4,5 XES spectra with the results of the FEFF simulation are shown here. The spectra have been normalized to unity at the 6p peaks as shown. Red: XES experiment. Black: FEFF XES. In Panel (a), the FEFF spectrum has been shifted—2 eV to align the 6p peaks. See text for details. The absence of multiplet structures in FEFF may contribute to the narrowness of the FEFF peaks.
Download figure:
Standard image High-resolution image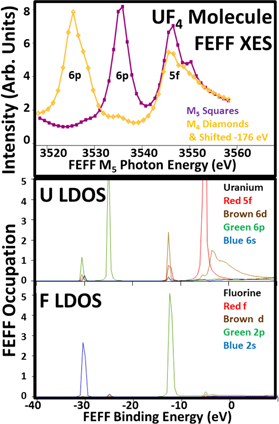
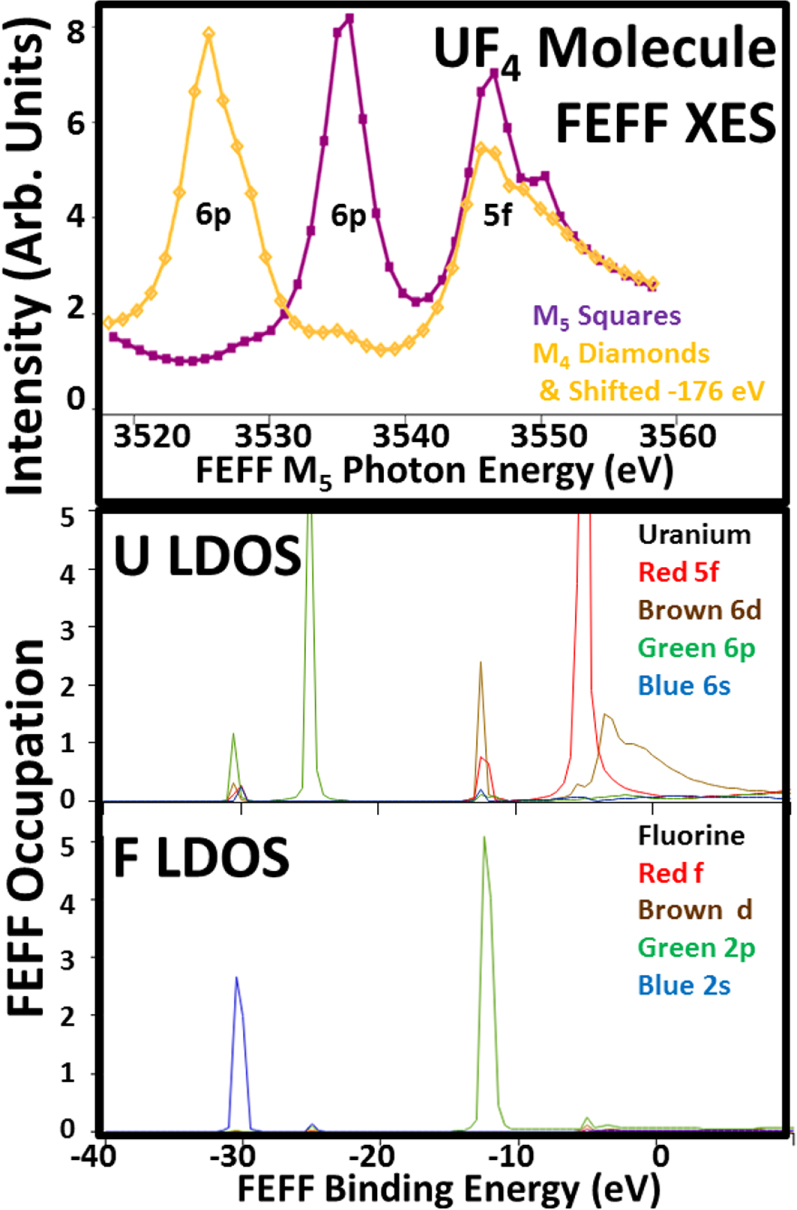
Figure 4. Shown here are the FEFF M4,5 XES spectra and the FEFF orbital angular momentum specific density of states (LDOS) for U and F from a UF4 Molecule model. The FEFF XES were not scaled: the magnitudes were taken directly from the FEFF simulation. The M4 FEFF spectrum has been shifted -176 eV, to put it in the same energy scale as the M5 FEFF spectrum. Key is as follows. M5 XES Purple/Squares; M4 Orange/Diamonds & Shifted -176 eV. Uranium: Red 5f; Brown 6d; Green 6p; Blue 6s. Fluorine LDOS: Red f; Brown d, Green 2p; Blue 2s. Fermi Energy is -8.2eV. For these calculations, FEFF was configured as follows: SCF-on but 5f states frozen, Exchange/Hedin Lundquist-off, Corehole-on but No, SO2-off, r(U-F) = 1.3 angstroms, tetrahedral symmetry (methane-like). See [13, 16] and references therein for definitions.
Download figure:
Standard image High-resolution imageDespite the simplicity of the model, there is a remarkable level of agreement found in the case of the M5 XES, shown in Panel (a) of figure 3. Although the simulated peaks are somewhat narrower than their experimental counterparts and the peak ratio slightly different, there is a reproduction of the salient features of the experimental spectrum, including the high energy shoulder on the U5f peak. (It should be noted that FEFF’s simplicity includes the neglect of the physics that drives the coupling of electrons to form multiplets with different energies. The absence of multiplet structures in FEFF may contribute to the narrowness of the FEFF peaks in this energy regime. Examples of multiplet structures include the prepeaks in the 5d spectra in [3, 19] and further discussion can be found in the references therein.) However, for the M4 spectra (Panel(b), figure 3), the agreement is not as good. In fact, there is a very serious discrepancy between the experimental and theoretical U 5f intensities. The reasons for this can be found in figure 4.
Consistent with many early calculations of actinide 5f structure, the Green’s Function approach used in FEFF has a tendency to over-mix the states. ([25] contains a detailed discussion of the improvement in modelling 5f structure that is achieved by limiting over-mixing). This can be seen in the loss of the 6p3/2-6p1/2 differentiation and the coalescence of the 6p into a single main peak (Binding Energy, BE, about −25 eV) with only a small amount of satellite density aligned with the F 2 s (BE about—30 eV). The single main peak and the satellite produce a large, single peak in both the M4 and M5 spectra, each of which has essentially the same intensity for M4 and M5 . Because FEFF uses relativistic cross sections (and selection rules), the equal intensity confirms complete 6p mixing. A similar argument applies to the occupied 5f state (BE ∼ −12 eV). The intensity of the U5f peak is again about the same in both the M4 and M5 spectra. (The unoccupied U5f states at BE ∼ −5 eV do not contribute. On this BE scale, the Fermi Energy is somewhere around ∼−8eV.) This means that, for this FEFF model, there is no j specific filling of the U 5f states, which is inconsistent with the known N4,5 XAS BR results for the actinides. From those earlier studies, it is known that the n = 2, U5f electrons in both UO2 and UF4 should be 98% 5f5/2 [25]. (n = number of 5f electrons.) This mixture of the U5f states destroys the intensity variations that underlie both the previously reported N4,5 XAS BR results and the new results reported here. In order to quantify the correct peak ratios for the XES observations, it will be necessary to consider the electric dipole transitions that dominate this spectroscopy.
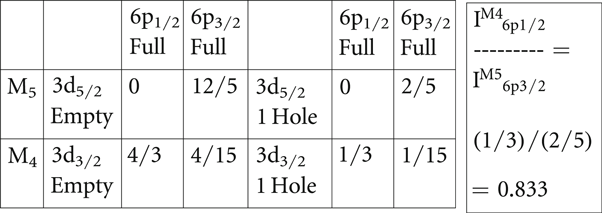
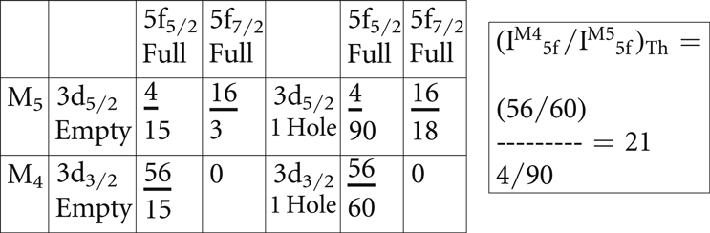
Shown in tables 1 and 2 are the single-electron, relative angular momentum cross section elements for the 6p and 5f states, using the electric dipole approximation and based upon a 3j symbol approach [26]. (The 3j-term symbol approach is a shorthand method for calculating the magnitude of the integrals of three spherical harmonic functions, as described in detail in [26]). The left side of each table contains the elements for transitions between completely full and completely empty manifolds, while the right side is normalized to a single core hole. In table 2, the zero cross section for the 3d3/2 to 5f7/2 is the underlying driver for the variation of the N4,5 XAS BR with atomic number and occupation. Similarly, there is a forbidden transition for the 6p1/2 to the 3d5/2. This forbiddenness can be seen in figures 1 and 2, where the 6p1/2 peak is absent in the UF4 M5 spectrum. Based upon the cross sections in table 1, one would argue that the best 6p peaks for normalization would correspond to Δj = 1: 6p3/2 → 3d5/2 and 6p1/2 → 3d3/2. These two transitions have larger cross sections than the Δj = 0: 6p3/2 → 3d3/2 case and thus should be less prone to complications. This contention will be borne out in the peak fitting analyses below.
Table 1. The 6p electric dipole cross sections are shown here. See text for details. Note: the 6p cross section total = 4/3 + 4/15 + 12/5 = 60/15 = 4; so the 6p cross section per 3d hole = 4/10 = 2/5. To the left are the calculations if the 3d states are completely empty. To the right are the cross sections per 3d hole.
|
Table 2. The 5f Electric dipole cross sections are shown here. See text for details. Note that: 5f cross section total = 4/15 + 56/15 + 16/3 = 140/15 = 28/3; 5f cross section per 3d hole = (28/3)/10 = 14/15. If the radial matrix elements and other factors were the same, then Rfp = (14/15)/(2/5) = 7/3, but the rad matrix elements etc are not the same. To the left are the calculations if the 3d states are completely empty. To the right are the cross sections per 3d hole.
|
From the electric dipole cross sections, it is possible to predict what the 6p and 5f ratios should be theoretically. These ratios are shown in the right-most boxes in each table. However, a reality of experimental work is that absolute calibrations are difficult, if not impossible. In order to make a comparison of the experimentally determined U5f peak ratio from the extant spectra, it will be necessary to calculate a ratio of ratios, shown below, and then apply the quantum mechanically predicted 6p ratio. The applicability of the prediction of the ratio from table 1 is supported strongly by the absence of the M4 6p1/2 peak. If something were wrong with the approach, e.g the electric dipole approximation failed or there was significant mixing of the pure 6p3/2 and 6p1/2 states, then the forbiddenness of the M4 6p1/2 transition would be broken and a peak would appear there.
The ratio of ratios approach is as follows.
 where
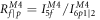 and


 with rearrangement
It is possible to measure  and
 from the spectra in figure 1 and thus calculate RR directly from the experiment. Once RR is available, the 6p ratio in table 1 can then be used to determine an experimental value for
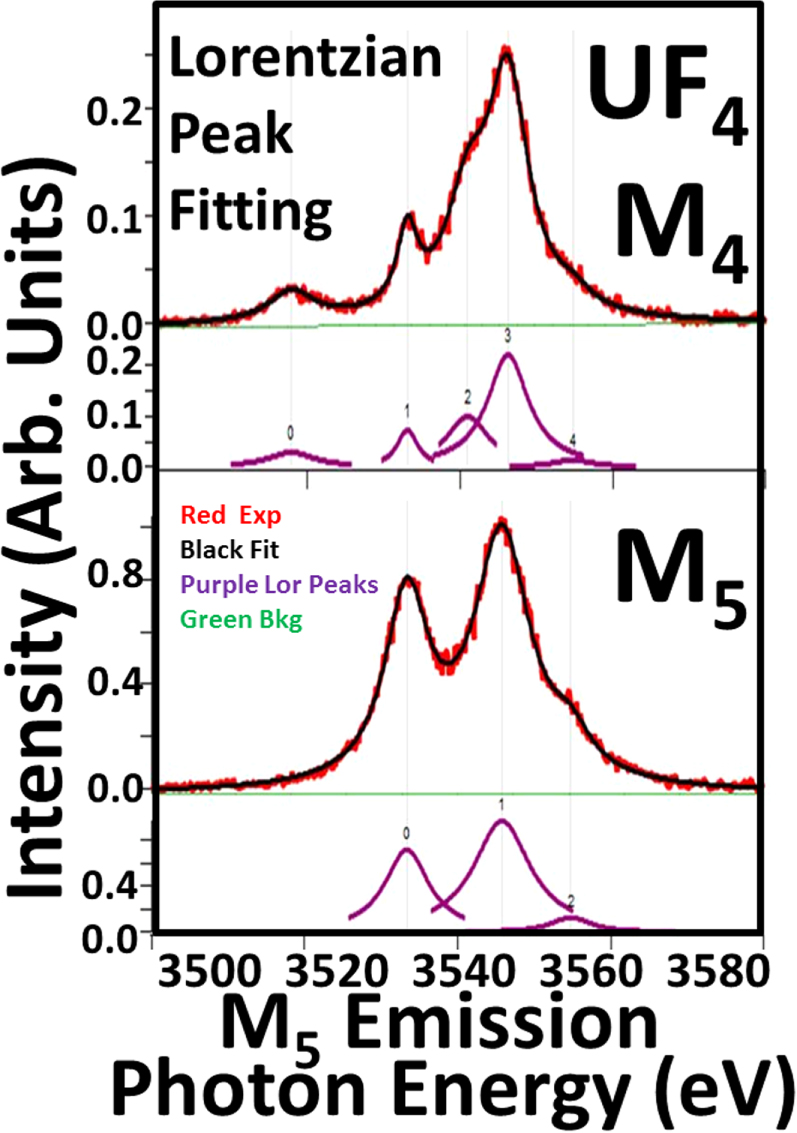
 EXP, which can then be compared to the 5f ratio prediction in table 2. The peak fittings for the M4 and M5 spectra are shown in figure 5, producing the results below.
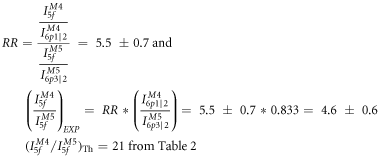
The reconciliation of these values is discussed below.
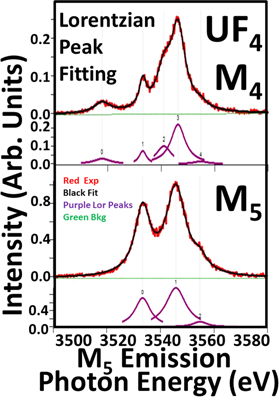
Figure 5. Peak fittings of the UF4 M4 and M5 spectra. Here, Lorentzian line-shapes were used, but a full parallel analysis with Gaussian line-shapes was also pursued, with similar results. The M4 6p3/2 (Peak 1) is too strong to be pure p3/2 without mixing. However, mixing p3/2 and p1/2 to get the required intensity for correct p3/2:p1/2 ratio in table 1 would require significant mixing. The result of this mixing would be that M5 6p1/2 would no longer be zero or small: it would be easily observable. Similar arguments should also apply to quadrupole transitions. Thus it appears likely that the M4 6p3/2 feature (Peak 1) probably has 5f contributions, similar to other 5f structure in the M4 spectrum. See table 3 for a summary of the results.
Download figure:
Standard image High-resolution imageTable 3. Fit results from figure 5.
| Peak0 area | Peak1 area | Peak2 area | Peak3 area | Peak4 area | |
|---|---|---|---|---|---|
| M4 | 0.33 ± 0.02 | 0.37 ± 0.01 | 1.05 ± 0.07 | 2.27 ± 0.08 | 0.13 ± 0.03 |
| M5 | 7.84 ± 0.08 | 13.6 ± 0.01 | 1.3 ± 0.1 |
The theoretical value, (IM45f/IM55f)Th, from table 2 is 21. However, this large value unrealistically assumes perfect electric dipole selection rules for a spherically symmetric system and 100% pure U5f5/2 electrons. None of these assumptions apply to the U5f electrons in UO2 and UF4. (1) The system is not spherically symmetric. In an earlier publication [18], it was shown how these systems have a small but real non-spherically symmetric crystal field splitting in the 5f states. However, it should be noted that the 6p states, bound by tens of eV, should be inside the 5f states and experience a more spherically symmetric potential. (2) The electric dipole selection rules may be weakening for the 5f states. Generally, the expansion terms in the spectroscopic perturbation Hamiltonian scale [27] as (ikr)x, where k = 2π/λ = E/(hc/2π) = 2πE/hc = 2πE/12400 eV-Angstroms. For this situation, k ∼ 2 Å-1 and r ∼ 2 Å, so kr ∼ 3 to 4. In the usual situation, where higher order terms are suppressed, kr < 1. So higher order effects, such as the electric quadrupole transitions, may be coming into play. Again, the impact on the 6p’s will be lessened since they should be smaller and inside the 5f states. (3) The states will not be pure 5f5/2. In Intermediate Coupling, there will be 5f7/2 character mixed in with the 5f5/2. All of these mitigating factors suggest that the U5f ratio should decrease from the theoretical value of 21. (For examples of the mixing of 5f5/2-5f7/2 character and a more detailed description, please see [3, 4, 18, 25]).
At this point, it is useful to consider more carefully the issue of the relative sizes and external interactions of the U6p and U5f states. If one begins with an atomic viewpoint and considers the expectation values of the orbital radii, one could argue that the 6p is larger than the 5f. For example, in the classic paper by Desclaux [28], the properties of the relativistic orbitals of all the atoms in the periodic table are given. There are expectation values of powers of r for each orbital and the 〈r〉 is a measure of the orbital size. For neutral U, the 6p 〈r〉 are 0.88 and 1.00 Å for j = 1/2 and 3/2 respectively while the 5f 〈r〉 are 0.75 and 0.77 for 5/2 and 7/2 respectively. This would indicate that the U 5f is more compact than the 6p. However, an atomic viewpoint misses the interactions of the outermost or valence orbitals with the neighboring atoms in the solid. One way to address the impact of nearest and next nearest neighbors is to build up a material from an atom to a cluster then the bulk. This has been done computationally for Pu by Ryzhkov and coworkers [29, 30]. As the material is grown computationally from the atom, to the dimer, to progressively larger clusters, remarkable changes occur in the valence electronic structure, consistent with prior experimental measurements. For example, the 5f occupation goes from 6 to near 5 and the 6d from 0 to above 2. (State occupations for the crystal clusters and isolated particles were obtained by Mulliken population analysis, giving rise to the possibility of fractional occupations in Pu. See [29, 30] for further detail. Here, our simple model for U 5f occupation is limited to integer populations for now). Thus, the electronic configuration has changed dramatically. Moreover, the hybridization between the 5f states and the 6d states is arguably the key event in 5f bonding, extending the reach of the 5f states well beyond what might be expected from atomic 5f expectation values. The impact of delocalization can be seen in bandmapping studies, such as that done by Opeil et al using a U(001) single crystal, where the occupied 5f states near the Fermi Level exhibit dispersion with the wavevector value of the state [31]. Additionally, it is well understood that the N4,5 XAS Branching ratio value of metallic U is caused by 5f delocalization [4, 25]. Finally, returning to cluster theory, Teterin and coworkers [21, 22] describe UF4 and UO2 as having an inner and outer valence, with the 6p in the inner valence and the 5f in the outer valence. It seems clear that, in the solid, the 5f states are far more extended than the 6p and that non-spherical interactions are much more likely for the 5f states than the 6p states.
Empirically, one way to estimate the degree of mixing is to add in contributions from possible 5f7/2 derived transitions, within the spherically symmetric, electric dipole model, to better match the with the experimental value of 4.6 ± 0.6. The result of that procedure suggests that a mixture with (85 ± 2)% 5f5/2 and (15 ± 2)% 5f7/2. This is more mixing than the result of Intermediate Coupling Model, suggesting that the non-spherical and higher order terms are coming into play.
Before going on to the summary, it should be noted that the scaling factors for the 6p states in figure 1 come directly from table 1 : I (M4-6p1/2)/I M5-p63/2) = (1/3)/(2/5) = 0.833.
4. Summary and conclusions
For the first time, the effect of Intermediate Coupling is reported for the 5f Occupied Density of States (ODOS), using x-ray Emission Spectroscopy. In fact, because of the high purity of the 5f ODOS (predominantly 5f5/2) the M4:M5 intensity ratio, i.e. Id3/2/Id5/2, is very large, on the scale of a factor of 5. This over twice the value of the N5:N4 peak ratio (∼2) that underlies the reported XAS Branching Ratio of UF4 of 0.68 [11, 12]. The value of 21 predicted for a pure 5f5/2 occupancy, with a purely spherical symmetric potential and perfect electric dipole transitions, is shown to be unrealistic and the value of 5 is consistent with a more realistic appraisal of the systems under consideration.
Acknowledgments
The authors wish to thank Corwin Booth of LBNL and Eric Bauer of LANL for their help with this work and the manuscript. LLNL is operated by Lawrence Livermore National Security, LLC, for the U S Department of Energy, National Nuclear Security Administration, under Contract DE-AC52-07NA27344. RXES data were collected at the Stanford Synchrotron Radiation Light-source, a national user facility operated by Stanford University on behalf of the DOE, OBES. Part of the instrument used for this study was supported by U S Department of Energy, Office of Energy Efficiency & Renewable Energy, Solar Energy Technology Office BRIDGE Program. This research used resources of the National Energy Research Scientific Computing Center, a DOE Office of Science User Facility supported by the Office of Science of the U S Department of Energy under Contract No. DE-AC02-05CH11231.