

Abstract
The effect of laser irradiation in the energy range from 20 mW to 200 mW was investigated in 109 nm thick Fe51Rh49 film deposited on an MgO (100) substrate. The initial, A1 structure with fully paramagnetic magnetic ordering was achieved after irradiating the samples with 120 keV Ne+ ions with a fluence of 1 × 10¹⁶ ion cm−2, as it was confirmed by conversion-electron Mössbauer spectroscopy. At higher powers physical damage of the layer was observed, while in the lowest power case, magnetic force microscopy revealed a well-defined magnetic structure reflecting the laser irradiation pattern. The presented results have the potential to be employed for laser ablation or allows the fabrication of arbitrary ferromagnetic pattern within a homogeneous paramagnetic FeRh thin films.
Export citation and abstract BibTeX RIS

Original content from this work may be used under the terms of the Creative Commons Attribution 4.0 licence. Any further distribution of this work must maintain attribution to the author(s) and the title of the work, journal citation and DOI.
1. Introduction
Recently, FeRh thin films have attracted extensive attention, due to the diversity of their possible applications [1–4]. Their near room temperature metamagnetic transition from antiferromagnetic (AF) to ferromagnetic (FM) order [5–11] and the interoperability between FM and paramagnetic (PM) states provide an excellent base for energy-saving spintronic devices [12–15]. Moreover, the outstanding caloric parameters and non-toxic biocompatibility of FeRh give novel alternatives for developing gas-free domestic magnetic refrigerators, or new medical applications [16–19].
One of the main challenges to turn a promising material into a nanodevice is the local implementation of the desired physical parameters. Among several techniques, the most common procedures use either a mask which determines the regions of the modifiable areas [12, 20, 21] or use a well-focused beam that directly damage or alters the material properties in the irradiated section [22–26].
Several impressing works came to light lately related to the creation of magnetic nanosturctures in FeRh [12, 27–29]. With focused He+ irradiation, the alternation of the local metamagnetic temperature of the B2 phase was demonstrated [14], by using laser ablation nanoparticles were synthetized in liquids[15], with Ne irradiation through a spherical nanomask FM nanodomains were induced in PM matrix [12] and AF/FM transition temperature was tuned by nanoindentation [30].
In recent work, we investigated the possibility of local heating and hence, directly writing magnetism in an entirely A1-structured PM FeRh film by means of laser irradiation. The change in the magnetic structure was confirmed by magnetic force microscopy.
2. Experimental
[natFe51Rh49(63 Å)/57Fe51Rh49(46 Å)]10 isotope-periodic multilayer was prepared on MgO (001) substrate by molecular beam epitaxy (MBE) technique. The substrate was held at 200 °C during the deposition process. The isotope periodicity of the film plays no role in this series of experiments; from the magnetic point of view the multilayer can be treated as a homogeneous 109 nm thick Fe51Rh49 thin film. The details of sample growth have been described in detail in a previous paper [3]. In order to achieve a full PM phase before laser irradiation, the as deposited sample was irradiated with 120 keV Ne+ ions of the fluence of 1×10¹⁶ ion cm−2 and a current density 750 nA cm−2 using the 450 kV heavy-ion implanter at Wigner Research Centre for Physics. The lateral sweeping homogeneity of irradiation was provided by the bidirectional scanning of the 1 mm wide ion beam across the sample surface.
The fully PM state after irradiation was confirmed by room temperature conversion electron Mössbauer spectroscopy (CEMS). The measurement was carried out at the Wigner Research Centre for Physics using a WissEl/DMSPCA Mössbauer spectrometer working in sinusoidal drive mode. Custom-built, gas-flow single-wire proportional counter was used with 1 mm distance between sample and anode wire, operating with a 96 V/V% He and 4 V/V% CH4 gas mixture. The spectra were taken using a room-temperature 57Co(Rh) source. Values of the isomer shift are given with respect to α-Fe at room temperature. The spectrum was evaluated using the MossWinn 4 code [31].
The XRD pattern was acquired utilizing a Bruker® D8 Discover diffractometer, employing Cu Kα radiation (λ = 1.542 Å). To optimize beam parallelism and minimize divergence, 0.6 mm slits were employed at both the source and detector ends. Additionally, a Soller slit rotated at a 90-degree angle was positioned between the sample and the detector-side slit to further enhance beam control. Furthermore, a secondary monochromator was implemented on the detector side to enhance the signal-to-noise ratio of the obtained results.
The magnetic state of the sample was investigated by room-temperature magnetic force microscopy (MFM) measurements. A commercial SPM (scanning probe microscopy) apparatus (Dimension Icon, Bruker Inc.) equipped with a standard CoCr coated tip (MESP, Bruker Inc.) was used. MFM is a secondary imaging mode derived from tapping mode that maps the magnetic force gradient above the sample surface while simultaneously obtaining topographical data. The system alternates scan lines at the sample surface and at a designated lift height above the sample surface, to separately measure topography and magnetic force, respectively. The surface topography from the initial scan is added to the lift height and the magnetic interactions are detected during this second pass.
The laser irradiation was performed by using a pulsed laser beam. The tunable output of a Coherent Chameleon Discovery laser with a wavelength of λ = 730 nm and 80 MHz repetition rate was used; the pulses were stretched to approx. 3 ps. The beam was scanned using a pair of galvo mirrors across the two lateral dimension of the sample (100 μm × 100 μm) in a two-photon microscope (Femtonics FemtoSmart) and focused on the sample to a spot diameter of 1.35 μm. The laser power, the illumination time of the area (dwell time) and the distance between the pixels were varied. The parameters for the laser irradiation are shown in table 1.
Table 1. Laser irradiation parameters of the different samples.
| Sample notation | Laser power (mW) | Dwell time (μs/pixel) | Step size (μm/pixel) | Total fluence (J cm−2) |
|---|---|---|---|---|
| S1 | 200 | 1.16 | 0.2 | 16.2 |
| S2 | 100 | 1.16 | 1 | 8.1 |
| S3 | 60 | 1.16 | 1 | 4.8 |
| S4 | 20 | 5.8 | 1.52 | 8.1 |
3. Theoretical background
The heating of a metal with a laser is a complex process, which can be split into several phases. The phases are defined by characteristic times. The characteristic time of heat diffusion in a distance of L is  where K is the heat conduction coefficient, C is the volume specific heat capacity, and DQ
is the thermal diffusion coefficient leading to the specific heat capacity of FeRh c = 353–360 J kg−1 K−1 [32, 33], from which the volume specific heat capacity C of about 3.45–3.5 J cm−3 K−1 is obtained. According to Qiao et al [32], K is 50 W m−1 K−1 corresponding to DQ
≈ 1.4×10⁻⁵ m2 s−1. A slightly different value of DQ
= 2 × 10⁻⁵ m2 s−1 was found by Bergman et al [34]. The FeRh layer investigated in the present study has a thickness h = 110 nm, and thus the characteristic time τh ≈ 0.6–0.9 ns. As the thermal diffusion coefficient of MgO is 1.35–1.81 × 10⁻⁵ m2 s-1, concerning the heat conduction, the FeRh layer and the substrate can be regarded as the same material. Thus, after about 1 ns, heating of the substrate will be started and most of the heat will be absorbed there.
where K is the heat conduction coefficient, C is the volume specific heat capacity, and DQ
is the thermal diffusion coefficient leading to the specific heat capacity of FeRh c = 353–360 J kg−1 K−1 [32, 33], from which the volume specific heat capacity C of about 3.45–3.5 J cm−3 K−1 is obtained. According to Qiao et al [32], K is 50 W m−1 K−1 corresponding to DQ
≈ 1.4×10⁻⁵ m2 s−1. A slightly different value of DQ
= 2 × 10⁻⁵ m2 s−1 was found by Bergman et al [34]. The FeRh layer investigated in the present study has a thickness h = 110 nm, and thus the characteristic time τh ≈ 0.6–0.9 ns. As the thermal diffusion coefficient of MgO is 1.35–1.81 × 10⁻⁵ m2 s-1, concerning the heat conduction, the FeRh layer and the substrate can be regarded as the same material. Thus, after about 1 ns, heating of the substrate will be started and most of the heat will be absorbed there.
As established by Sparks [35], for exposure times Δt shorter than τδ
, (τδ, the characteristic time corresponding to the skin depth δ=2/α where α is the absorption coefficient), the temperature increase of the surface is  where I and A are the laser intensity and the absorptance, respectively. The laser affects the material lying deeper than the skin depth essentially only indirectly by heat conduction. The laser fluence Φ = I Δt needed to increase the temperature by ΔT is
In table 2, some optical constants are given for the wavelength of 730 nm calculated from the complex dielectric constants published by Saidl et al [36] for the AF and FM states of FeRh. As shown by Khan et al for the PM state these are different, but of the same order of magnitude [37]. The complex refractive index of the FeRh samples of the present study was measured applying a Woollam M-2000DI rotating compensator-ellipsometer, are also shown in table 2. As the skin depths were less than the thickness of the FeRh layer (110 nm), i.e. the transmission was negligible, so that the absorptance may be approximated as A ≈ 1–R where R is the reflectance (assuming perpendicular incidence). The values of  calculated from these quantities are included in table 2, as well, giving a possibility to estimate the necessary temperature increase. These values are appropriate only for a rough estimation in case of short exposure times Δt < τδ
. From the previous considerations for τh follows, that this will be less than 1 ns.
calculated from these quantities are included in table 2, as well, giving a possibility to estimate the necessary temperature increase. These values are appropriate only for a rough estimation in case of short exposure times Δt < τδ
. From the previous considerations for τh follows, that this will be less than 1 ns.
Table 2. Refractive index n (calculated from complex dielectric constants of [32] or ellipsometrically measured), absorption coefficient α, skin depth δ, reflectance R, absorptance A of FeRh at 730 nm in antiferromagnetic (AF), ferromagnetic (FM) and (ellipsometrically measured) paramagnetic (PM) state, as well as the calculated constants used for estimation of the laser-induced temperature change.
| n | α (nm−1) | δ (nm) | R | A |
 (K cm2 J−1) (K cm2 J−1) |
 (K cm2 J−1s0.5) (K cm2 J−1s0.5) | |
|---|---|---|---|---|---|---|---|
| AF | 5 + 5.8i [32] | 0.99 | 20 | 0.71 | 0.29 | 4.1 104 | 0.25 |
| FM | 4.7 + 2.7i [32] | 0.047 | 43 | 0.52 | 0.48 | 3.2 104 | 0.41 |
| PM | 2.4 + 4.55i [measured] | 0.078 | 26 | 0.70 | 0.30 | 3.3 103 | 0.26 |
For the region τδ
< Δt < τS
, where S corresponds to the thickness of the whole sample (with exposure times of the order of μs one remains in this region), the temperature increase is  =
=  [36]. Thus in this region the temperature change depends not only on the fluence, but also on the exposure time, as well. Substituting the fluences and exposure times available in table 1 into this formula, the laser-induced temperature change can be calculated.
4. Results and discussion
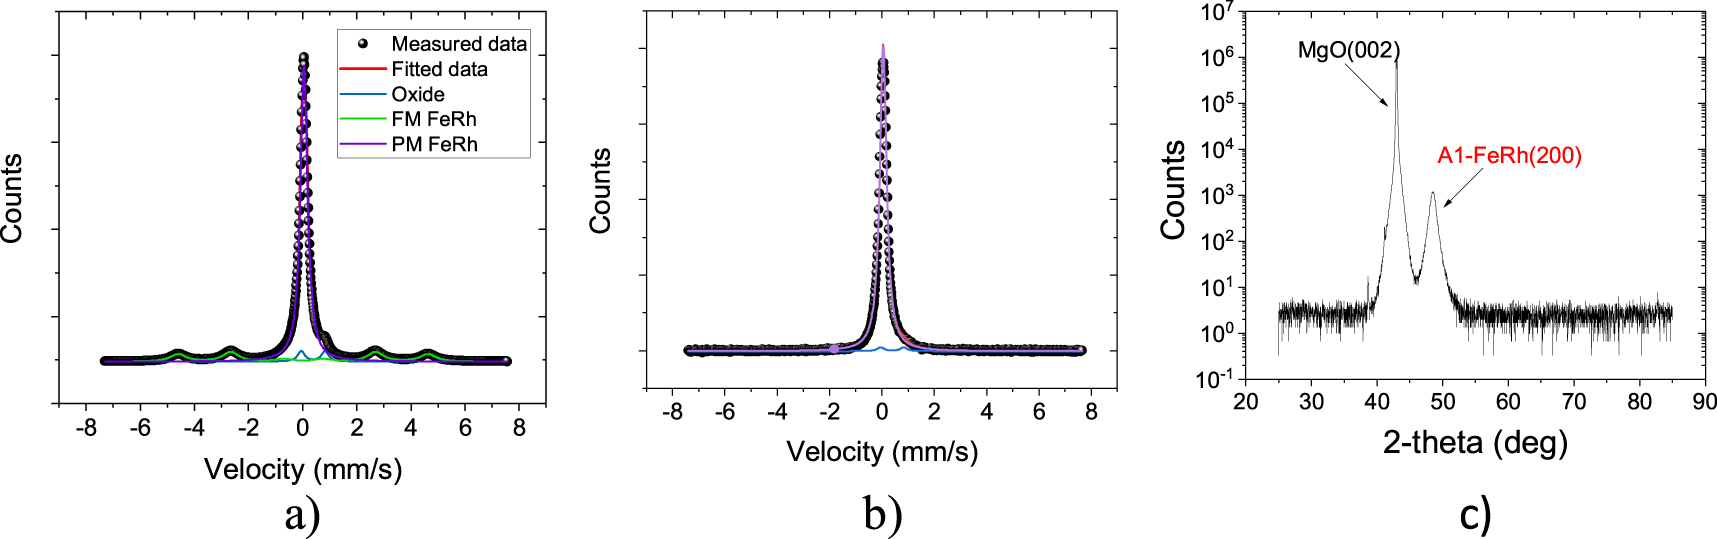
At room temperature, the equilibrium phase of Fe51Rh49 exhibits the α' B2 FeRh structure with FM ordering. However, when sample was grown at relatively low temperatures (in our case 200 °C), a predominantly metastable PM phase with low amount of FM component is present [3]. In order to observe clear effect of the laser irradiation, it is very important to perform the experiment on a fully PM sample, therefore all FM component was removed by 120 keV Ne+ irradiation [3], a fact confirmed by CEMS as shown in figure 1. At this particular energy, the vast majority of Ne+ ions traverse the layer and come to a halt within the substrate at a range of 1369 Å.
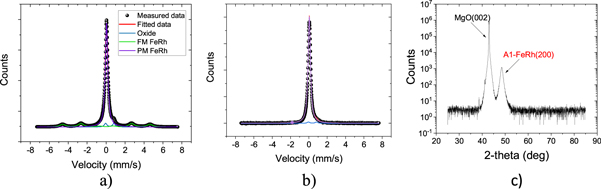
Figure 1. Conversion electron Mössbauer spectroscopy spectrum on the as-deposited (a), the 120 keV, 1×10¹⁶ ion cm−2 Ne+ irradiated (b) Fe51Rh49 sample and (c) the x-ray diffraction pattern of the as-deposited sample.
Download figure:
Standard image High-resolution imageIn the CEMS spectrum of the as-deposited sample, the main paramagnetic component with isomer shift (δ) = (0.049 ± 0.001) mm s−1 contributes 73.74% to the spectrum and corresponds to the FeRh with A1 structure. The second component with a 21.09% contribution and hyperfine magnetic field HF = (28.70 ± 0.02) T and δ = (0.015 ± 0.002) mm s−1 corresponds to FeRh with B2 structure. Finally, a doublet corresponding to an oxide layer on the top of the sample with 5.17% contribution with δ = (0.388 ± 0.003) mm s−1 and quadrupole splitting (Δ) = (0.879 ± 0.006) mm s−1 can be observed. After 1×10¹⁶ ion cm−2 120 keV Ne+ irradiation, the ferromagnetic component vanished and only the paramagnetic component with 97.53% and oxide with 2.47% remained in the sample. All uncertainties are given with 95% confidence interval. In contrast to the CEMS findings, only the A1 structure could be discerned in the as-deposited XRD pattern. This disparity can be attributed to the varying sensitivities of the two techniques. CEMS, being sensitive to atomic environments, can detect the presence of the B2 phase crystals even if they are minuscule. On the other hand, XRD necessitates a certain size of periodic structures to be observable. Hence, if the B2 phase crystals are very small, may manifest in the CEMS spectrum while remaining concealed in the XRD pattern.
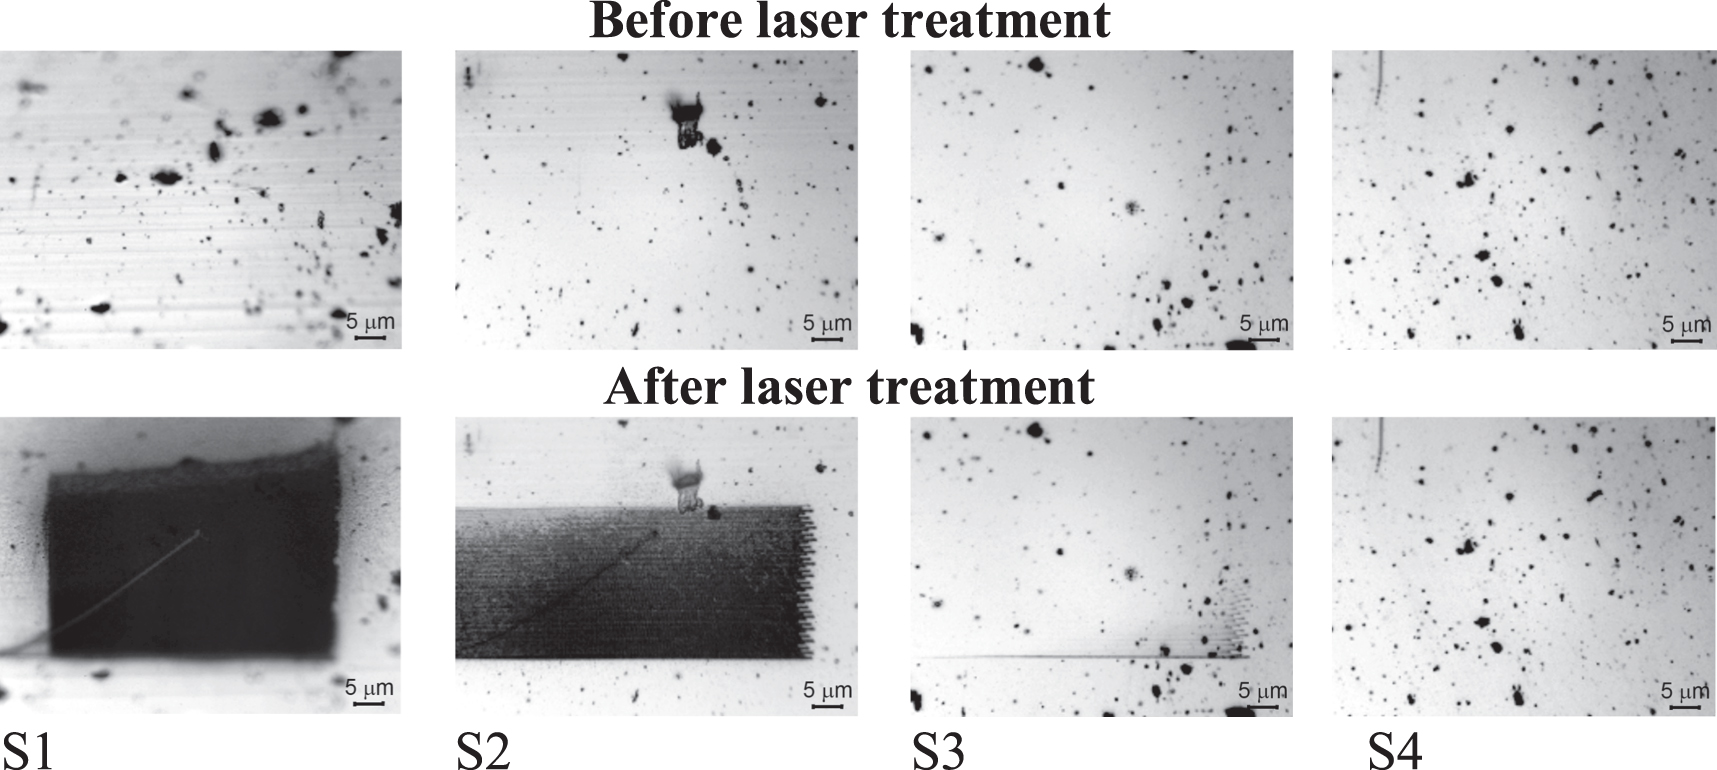
In the series of laser irradiations we systematically varied the laser power, dwell time, and distance between adjacent illuminated spots to capture a broad range of irradiation effects. Before and after each laser irradiation, optical microscopy images were recorded from the influenced surface, which are shown in figure 2.
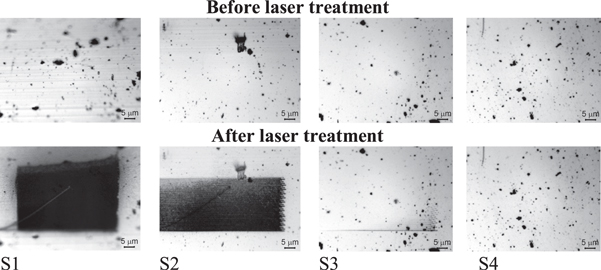
Figure 2. Optical microscopy images taken before and after laser treatment with different irradiation parameters.
Download figure:
Standard image High-resolution imageIn the first experiment (S1), a laser power of 200 mW was used. A lateral 2D scan was performed using a galvo scanner, with a dwell time of 1.16 μs and a step size of 0.2 μm. As the step size was smaller than the focal spot diameter, the consecutively illuminated areas overlapped. It is possible to calculate approximate values of the temperature increase induced by the laser irradiation, as listed in table 3. Although in the calculation the temperature dependence of the material coefficients and the overlap of the consecutive laser areas were not taken into account, these data can be used for qualitative interpretation of the experimental results. Based on these calculations, the PM state A1-FeRh film should heat up to approximately 3900 K (as shown in table 3). It is worth noting that A1-structured FeRh turns to the B2 phase after low-temperature annealing [3]. Therefore, at the very beginning of the illumination, the film presumably turns to the B2 FM phase, where the heat absorption is more intense, increasing the temperature above 6000 K (as shown in table 3). At such temperatures, the film evaporates, which was confirmed by the optical microscopy image (figure 2 S1), indicating that the applied laser fluence was sufficient to cause ablation of the FeRh film. The blurred boundaries, which are not parallel to the pattern edges, are the consequence of the beam diameter increase (interaction volume) when deviating from the beam focus. Defocusing happens when, from whatever reason, the focal spot is not at the ideal surface. In this case, the laser energy becomes distributed over a larger area, resulting in a decrease in energy density to a level that may not be capable of inducing the PM-FM transition (or ablation at higher energy densities). Due to technical reasons, the perfect perpendicularity of the sample with respect to the microscope axis was not possible to establish prior to laser irradiation, which in itself could be a cause for the observed, distorted irradiation pattern. In addition, the microscope used (Femtonics FemtoSmart Galvo) employs galvanometric scanning mirrors without compensation optics (F-theta lens, descanning or dynamic focus correction), therefore the focus surface is curved, not flat. Across a field of 100 μm, the curvature already contributes to the deviation from a uniform tight focusing condition across the flat sample.
Table 3. Estimated temperature increase (K) of antiferromagnetic (AF), ferromagnetic (FM) and paramagnetic (PM) phases for the different experiments.
| S1 | S2 | S3 | S4 | |
|---|---|---|---|---|
| AF | 3760 | 1880 | 1114 | 841 |
| FM | 6167 | 3083 | 1827 | 1379 |
| PM | 3910 | 1955 | 1159 | 875 |
In the subsequent experiment (S2), the laser power was reduced to 100 mW while maintaining the previous dwell time while using step size 1 μm (as shown in figure 2 S2). The irradiation effect was found similar, even so that the calculations indicated that the sample heated up markedly less, approximately 1950 K in the PM phase and 3100 K in the FM phase. Additionally a 'pixelated' pattern could be observed on the film surface, indicating that the laser pulses evaporated material from the film far enough from each other to be distinguished.
When the laser power was set to 60 mW, the microscopy image revealed only a minor, but still observable sputter effect (figure 2 S3). The calculation shows that in the PM phase the irradiated surface heats up only ∼1160 K, which would not explain the physical damage in the film. However, if the sample undergoes A1 PM—B2 PM phase transition (As we assumed earlier) the temperature can raise to ∼1800 K which is close to the melting point of this alloy (~1915 K [38]). In previous cases (S1, S2) the ablation could be easily explained by the vaporization of the material but, in this case (S3), the transferred energy does not support this mechanism. Instead, it is more likely that the sudden expansion of the illuminated area generates significant strain, which could cause the film to locally peel off.
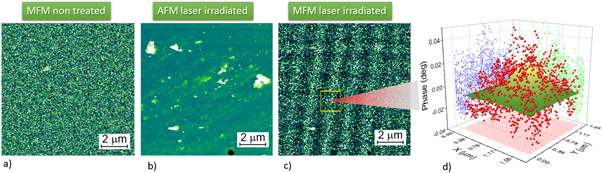
In the last experiment, 20 mW laser power with 5.8 μs illumination time and 1.52 μm step size was used. Both the optical microscopy (figure 2 S4) and SPM tomography images (figure 3(b)) justified that no physical damage occurred on the sample. In figures 3(a)and (c), the phase shift (representing the shift in the resonant frequency) is displayed for each position on the analyzed surface before and after the laser irradiation, respectively. As expected from a fully PM A1 FeRh phase, (before the laser irradiation) the MFM image showed no evidence of any magnetization in the sample. However, after the laser treatment, a 2D magnetic pattern reflecting the illuminated regions could be observed. In figure 3(d), the phase values are presented for a selected magnetic domain. The Gaussian fit describes the magnetic signal dispersion within the magnetic domain at the given position, reflecting the intensity distribution of the laser power within the illuminated spot.
Figure 3. (a) MFM image of the sample before laser irradiation, (b) SPM tomography, (c) MFM image of the 20 mW laser illuminated sample and (d) Gaussian fit of the phase values of an arbitrary laser-induced magnetic spot.
Download figure:
Standard image High-resolution image
The distance between the nearest magnetic maxima was found to be 1.5 μm in agreement with the pixel distance of laser irradiation. By fitting the MFM phase values with a 2D Gaussian distribution, w1 = 0.31 ± 0.02 μm and w2 = 0.32 ± 0.02 μm for the width parameters were obtained, indicating an essentially symmetric domain structure.
As previously demonstrated in [3], a 30 min annealing at 473 K is sufficient to induce the PM A1 to FM B2 transition. In this case, when using 20 mW laser pulses, the local temperature increased by 875 K, and a 5.8 μs exposure was sufficient to develop FM ordering under the illuminated area.
Laser beam has already proven to be an effective tool for the fabrication of FeRh nanostructures. Nadarajah and colleagues successfully utilized laser ablation to create near-to-equiatomic γ-FeRh solid-solution nanoparticles [15]. Additionally, Shabbir and coworkers [39] have recently demonstrated that laser sintering can be employed to achieve FeRh nanoparticles with multicaloric properties. We believe that our findings can contribute to the advancement of laser-assisted manipulation of FeRh, paving the way for the development of modern devices.
5. Conclusion
109 nm thick Fe51Rh49 thin film was deposited on MgO(100) substrate by using MBE technique. In order to eliminate even the smallest fraction of FM component from the sample, 1×10¹⁶ ion cm−2 Ne+ irradiation at 120 keV was carried out and confirmed the result through CEMS analysis.
Laser irradiation in a raster pattern was performed on the samples at the wavelength of 730 nm and spot size of 1.35 μm. The laser power as well as the dwell time and step size were varied to investigate the effect in localized PM A1 → FM B2 magnetic transition in the FeRh film. An approximate temperature increase was calculated for each parameter set in order to explain the results. In the first three experiments, the laser power was decreased from 200 mW down to 60 mW which resulted in film damage (ablation), which can be informative for related research. When 20 mW laser power was applied, no surface damage could be observed either by optical or atomic force microscopy. Nevertheless, magnetic force microscopy images revealed a magnetic pattern corresponding to the step size of laser irradiation, which proves that it is possible to locally induce magnetic transformation with this technique.
Based on these results, a tailored magnetic pattern can be implemented in FeRh film, which can be a great step to design modern nano-devices in the field of spintronics or information technology.
Acknowledgments
The authors express their gratitude to Edit Szilágyi for the Rutherford Backscattering Spectrometry calibration for the MBE equipment and to the K131515 OTKA Hungarian grant for the financial support.
Data availability statement
All data that support the findings of this study are included within the article.