
Abstract
Simple substrates for surface enhanced Raman spectroscopy (SERS), producible in a cost-efficient way, are of growing interest both for scientific and for environmental applications. In this study, we demonstrate the use of three types of bio-based tannin-furanic rigid foams as precursor materials for SERS substrates. Coated with a silver layer, these substrates allowed the detection of several well-known analytes in the mM regime by Raman spectroscopy. Specific optimization of the standard tannin-furanic foam morphology by tuning the chemical synthesis led to a smaller and more homogeneously distributed pore structure, supplying more active hot spot areas. Thus, we obtained a significant increase and a lower relative standard deviation (RSD) of the SERS signal recorded over the mapped SERS substrate area, for several analytes, in particular for Malachite Green dye. This work represents a feasibility study opening several potential applications of this biopolymers in fields such as the detection of water pollutants, virtually combining filtration and SERS capabilities driven by a controlled porosity.
Export citation and abstract BibTeX RIS

Original content from this work may be used under the terms of the Creative Commons Attribution 4.0 licence. Any further distribution of this work must maintain attribution to the author(s) and the title of the work, journal citation and DOI.
1. Introduction
Totally natural rigid foams derived from byproducts of wood industries, like tannin-based rigid foams, are innovative materials made of inexpensive organic ingredients, produced via an acid catalyzed polycondensation reaction between furfuryl alcohol and condensed flavonoids (e.g. Mimosa tannin) [1, 2].
These inexpensive products have been proposed for the insulation of green building due to their excellent thermal properties and their good fire resistance [3, 4]. Despite the main studies were focused on this suggestive commercial application, these polymers were also proposed as pollutant absorber for metals, surfactants, dyes and ammonia because of their capacity to establish stable secondary bonds with these substances [5–7].
Biological and chemical contamination of groundwater and wastewater is a widespread problem with the current need of mostly complex (wet chemistry) analytics to identify the source of contamination [8]. A material acting as both adsorbent and sensor for detecting low concentrated pollutants in a fast and easy way would be a huge benefit. Surface-enhanced Raman scattering (SERS), as a non-destructive and rapid method able to detect substances even down to trace analysis level without requiring biomarkers or long incubation times that are usually needed for fluorescence spectroscopy or microbiological investigations, is a suitable spectroscopic technique for this challenge [9–11]. Noteworthy, the use of a confocal Raman setup allows collecting the scattered radiation from a sample even through glass or other optically transparent materials [12].
Usually the control of size distribution, shape, composition and distance of the metal nanoparticles on a surface is necessary in order to obtain localized surface plasmons (LSP) under irradiation of a certain wavelength, and to get sufficient electromagnetic enhancement contributing to the SERS signal. All these parameters have a relevant impact on the electromagnetic enhancement because they strongly influence the formation of hotspots. Within these hotspots, the magnitude of the electric fields resulting from LSP resonances of the metal nanoparticles are coupled and enhanced by several orders of magnitude compared to the incident electric field, leading to strongly increased Raman signals with respect to conventional Raman scattering [11, 13–16]. Therefore, creating applicable and reliable plasmonic devices and SERS substrates usable for specific applications is in focus of intense research since many years [10, 11, 17, 18]. The formation of well-defined metal nanoparticles often needs complex or expensive processes, with some exceptions like e.g. Chamuah et al [19] showed with their work about SERS on paper.
In this work, we propose an innovative approach for the fabrication of suitable SERS substrates, being a first feasibility study for the application of tannin-furanic foams as smart materials for SERS substrates. It may be regarded as a starting point for the more advanced use of tannin-furanic foams in wastewater treatment [6, 20, 21], including further steps in the direction of future applications for wastewater and environmental diagnosis. The surface morphology of selected tannin-furanic foams [1, 4, 22] was functionalized with a thin layer of silver by DC Magnetron sputtering to enable LSP resonances. In comparison to Chaney et al (2005) and Yang et al (2021) [23, 24], who created a nanostructure by the sputtering process, we used the originally present surface morphology of the tannin-furanic foams and covered the surface with a continuous Ag layer. The SERS capabilities of the produced structures were tested by exploiting Raman mappings of different analytes (4-MBA, Adenine, BPE, Crystal Violet, Malachite Green, R6G and Ribolflavin), varying in size, Raman scattering cross-section and adsorption sites on plasmonic surfaces. All analytes had a concentration of 1 mM, in comparison to μM and nM on well-defined SERS substrates [10, 11, 25]. The SERS measurements were performed with 532 nm laser excitation wavelength. As a matter of fact, to take into account the influence on the resulting SERS signal of the uncontrolled and naturally grown surface structure of tannin-based bio-foams, a few hundred Raman spectra were collected over a specified surface area by Raman mapping, and an arithmetic mean Raman spectrum with the relative standard deviation (RSD) was calculated afterwards. The SERS measurements showed that the enhancement of the Raman signal strongly depends on the local position on the substrate. While some regions showed a strong enhancement in the Raman signal, other regions showed no signal enhancement. From this, we conclude that, due to the chaotic surface morphology of the standard tannin foams, Ag nanostructures with the proper dimensions to generate LSP resonances only are formed in some localized areas of the substrate. To improve the enhancement and homogeneity of the SERS signal, we performed a systematic study of differently synthesized tannin-furanic foams with different surface morphology and pore sizes. By calculating a statistical mean Raman spectrum over all measured spectra collected in the area of the substrate during the Raman mapping, we can state a qualitative result of the analyte detectability on the functionalized tannin-furanic foams used as SERS substrate.
Within our work, we did not focus on the calculation of the SERS Enhancement Factor (EF), contrary to several other studies such as [23, 24]. This is because our substrate, due to its morphology and structure, is intended to serve as a SERS sensing filter material, the growth of a self-assembled analyte monolayer, which is the basis for most reported EF calculations, being therefore questionable. The fact that our surface cannot be reliably estimated due to its chaotic morphology, together with the findings by Guicheteau et al (2017) and Cheng et al (2021) [26, 27], led us not to evaluate and report unreliable EFs for this first study on tannin-furanic foam as SERS sensing filter material.
2. Materials and method
2.1. Materials
For the production of the tannin-furanic foams Industrial Tannin Extract Weibull AQ, provided by the company Tanac (Montenegro, RS, Brazil), and furfuryl alcohol from Transfurans Chemicals (Geel, Belgium), were the basis for every formulation. Diethylether and sulfuric acid were purchased from Roth (Karlsruhe, Germany), glyoxal and the surfactants polysorbate 80 and poloxamer 407 were purchased from VWR (Darmstadt, Germany). All analyte chemicals (4-Mercaptobenzoic acid (4-MBA), Adenine, 1,2-Di-(4-pyridyl)-ethylen (BPE), Crystal Violet, Malachite Green, Rhodamine 6G (R6G), Riboflavin (Vitamin B12), 1,4-Benzenedithiol (1,4-BDT)) were purchased from Merck and used as-received. Solutions of 1 mM concentrations have been prepared with best suitable solvents (table 1) as reported in literature [28–34].
Table 1. Analytes (analytical standards from sigma aldrich) and solvents for preparation of 1 mM SERS test solutions.
| Analyte | Mw g−1 mol−1 | Chemical formula | Cas-no. | Solvent |
|---|---|---|---|---|
| 4-Mercaptobenzoic acid (4-MBA) | 154,19 | HSC6H4CO2H | 1074–36–8 | 2-Propanol [30] |
| Adenine | 135,13 | C5H5N5 | 73–24–5 | 70:30 (EtOH:H2O) [28] |
| 1,2-Di-(4-pyridyl)-ethylen (BPE) | 182,22 | C12H10N2 | 13362–78–2 | EtOH [31] |
| Crystal Violet | 407,99 | C25H30ClN3 | 548–62–9 | EtOH [33] |
| Malachite Green | 364,91 | C23H25ClN2 | 569–64–2 | EtOH [32] |
| Rhodamine 6G | 479,01 | C28H31N2O3Cl | 989–38–8 | EtOH [34] |
| Riboflavin (B2) | 376,36 | C17H20N4O6 | 83–88–5 | 0.1 M NaOH [29] |
2.2. Differently synthesized tannin-furanic foams
2.2.1. Preparation of standard tannin-furanic foam [4]
To prepare standard tannin-furanic foam, 3.2 g H2O, 9.8 g furfuryl alcohol and 2.1 g diethylether were weighed in and stirred for 20 s. Then, 15.9 g tannin were added, and the solution was mixed thoroughly for another 60 s. In a final step, 6.9 g of 32% H2SO4 were added and the mixture was stirred rapidly for 30 s to homogenise the solution. The blend was then poured into a Teflon-coated mould of dimension 100 × 100 × 25 mm3 and placed in a preheated laboratory hot press at 100 °C for 10 min. After this curing period, the foam was stored for 1 week at 20 °C and 65% relative humidity before further use.
2.2.2. Preparation of glyoxal tannin-furanic foam [4]
To prepare glyoxal tannin-furanic foam, the recipe of standard tannin-furanic foam was slightly changed by replacing water with glyoxal and adapting stirring times. Therefore, 3.2 g glyoxal, 9.8 g furfuryl alcohol and 2.1 g diethylether were weighed in and stirred for 20 s. Then, 15.9 g tannin were added, and the solution was mixed thoroughly for another 30 s. In a final step, 6.9 g of 32% H2SO4 were added and the mixture was stirred rapidly for 20 s to homogenise the solution. The blend was then poured into a Teflon-coated mould of dimension 100 × 100 × 25 mm3, placed in a laboratory hot press and cured at 40 °C for 10 min. After this curing period, the foam was stored for 1 week at 20 °C and 65% relative humidity before further use.
2.2.3. Preparation of TWEEN Pluronic tannin-furanic foam [35]
For the preparation of TWEEN-Pluronic tannin-furanic foams 6.5 g polysorbate 80 and 2.6 g poloxamer 4077 were dissolved in a mixture of 25 g furfuryl alcohol and 24 g water. This mixture was than homogenised with 40 g mimosa tannin for 5 min at a speed of 150 rpm using an overhead stirrer. Afterwards 16 g of 16% H2SO4 were added and stirring was increased to 1500 rpm for about 15–20 min, obtaining a light brown foam during this process. The blend was then transferred into a Teflon coated mould (100 × 100 × 30 mm3) and placed in a convection oven at 90 °C for 30 min to allow an initial curing. Afterwards, the foam was removed from the mould and the skin was peeled off. A final curing for 24 h at 90 °C and conditioning for 1 week at 20 °C and 65% relative humidity was applied before cutting the foams to size for further use.
2.3. Foam cell dimensions and porosity
For the characterization of the foams we decided to measure the macropores instead of the micropores, since N2-sorption measurements of different samples showed unclear results and is in general not the preferred method for determining lower surface area (1–2 m2 g−1) [36]. The cell size dimensions of the macropores were measured by reflected light microscopy using a Nikon SMZ 1500 stereomicroscope (Tokio, Japan). On three samples of each foam formulation, at least 50 measurements in length and 100 in width were carried out in the direction parallel to the growth. The average foam cell diameter (Av.D) was then calculated with equation (1), where D is the average of 150 measurements. Results for all three foam types are shown in table 2

Table 2. Cell size dimensions of the macropores of tannin-furanic foams.
| Tannin-furanic foam | Average foam cell diameter [μm] |
|---|---|
| Standard | 172 (±55) |
| Glyoxal | 148 (±40) |
| TWEEN Pluronic | 98 (±30) |
2.4. Scanning electron microscopy
Micrographs of the three different tannin-furanic foams, shown in figure 1, were taken using a Zeiss Ultra Plus field emission scanning electron microscope (SEM) equipped with an annular backscatter electron detector and a secondary electron detector (Carl Zeiss AG, Oberkochen, Germany). Acceleration voltage was set to 5 kV and working distance was adjusted between 4 and 6 mm. Prior to the imaging, the samples were coated with a thin layer of gold using a sputter coater with a current of 40 mA and coating time of 120 s. All three foam types at different magnifications are compared in figure 1, showing the decrease in pore size for the glyoxal tannin-furanic foam and the TWEEN Pluronic tannin-furanic foam.
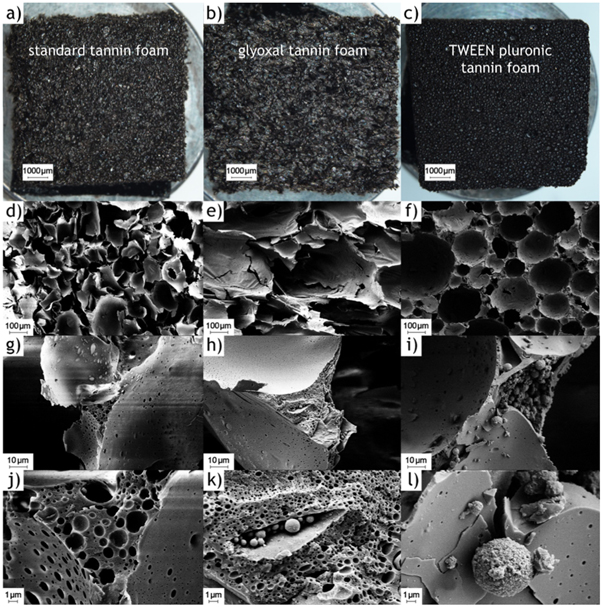
Figure 1. Optical images (first row) and scanning electron microscopy images at different magnifications of standard (a, d, g, j), glyoxal (b, e, h, k) and TWEEN Pluronic (c, f, i, l) tannin-furanic foams, showing the different pore sizes of the different foam types.
Download figure:
Standard image High-resolution image2.5. Surface functionalization (DC magnetron sputtering)
A magnetron sputtering system available at the Elettra Sincrotrone Trieste was used to deposit a layer of Ag (40 nm thickness) on top of the tannin-furanic foams. The DC magnetron system is a custom multitarget instrumentation. The process, in DC, started with a system vacuum of 2 × 10⁻⁵ mbar, dropping to 5 × 10⁻³ mbar during the deposition. A power of 250 W was applied, enabling a deposition rate of around 2.4 nm s−1. After the coating procedure, all samples were sealed and packed under N2 atmosphere, to avoid a chemical reaction of Ag and O2 during storage.
2.6. SERS sample preparation
To simulate the usage of a tannin-furanic foam as a filter material and SERS substrate for pollutants detection, the Ag-coated tannin-furanic foam samples were dipped into a 1 mM concentrated analyte solution, as listed in table 1. Each dipping procedure was carried out for 15 s, after which the samples were dried under ambient conditions.
2.7. Raman mapping and data treatment
Raman spectroscopic investigations and SERS measurements were carried out using a Thermo Scientific™ DXR™2 dispersive Raman microscope equipped with an Olympus BX41 confocal microscope and with a laser with an excitation wavelength of 532 nm, achieving with a slit-like aperture with 50 μm size and a so-called full range (50–3600 cm−1) grating with 900 lines mm−1 an estimated resolution of 5.5–8.4 cm−1. The spectrometer was controlled by the software OMNIC™ for Dispersive Raman 9.8.286. SERS investigations were performed by using a 10× objective lens with NA 0.25, resulting in an estimated spot size of 2.1 μm, and a laser power of 100 μW for all measurements, resulting in an intensity of 2,9 kW cm−2 at the laser spot on the sample. Raman spectra recording was done by mapping different areas with a step size of 2–3 μm, exposure times, number of accumulations and number of recorded spectra for all measurements being listed in table 3. From all mappings, mean values and relative standard deviation (RSD, %) of the Raman intensity over all the recorded spectra in each individual mapping were calculated, as shown in figures 2 and 3.
Table 3. Raman mapping parameter settings.
| Tannin-furanic foam | Analyte c = 1 mM | Wavelength [nm] | Power [mW] | Aperture [μm slit] | Lens | Exposure time [s] | Number of exposures | Step size [μm] | Number of spectra |
|---|---|---|---|---|---|---|---|---|---|
| standard | 4-MBA | 532 | 0,1 | 50 | 10× | 25 | 6 | 3 | 289 |
| Adenine | 532 | 0,1 | 50 | 10× | 10 | 30 | 3 | 196 | |
| BPE | 532 | 0,1 | 50 | 10× | 30 | 10 | 3 | 140 | |
| Crystal Violet | 532 | 0,1 | 50 | 10× | 10 | 6 | 3 | 289 | |
| Malachite Green | 532 | 0,1 | 50 | 10× | 10 | 6 | 3 | 289 | |
| R6G | 532 | 0,1 | 50 | 10× | 1 | 15 | 2 | 1326 | |
| Riboflavin | 532 | 0,1 | 50 | 10× | 15 | 4 | 3 | 442 | |
| glyoxal | Malachite Green | 532 | 0,1 | 50 | 10× | 2 | 10 | 2 | 416 |
| R6G | 532 | 0,1 | 50 | 10× | 1 | 15 | 2 | 684 | |
| TWEEN Pluronic | Malachite Green | 532 | 0,1 | 50 | 10× | 2 | 10 | 2 | 651 |
| R6G | 532 | 0,1 | 50 | 10× | 1 | 15 | 2 | 540 |
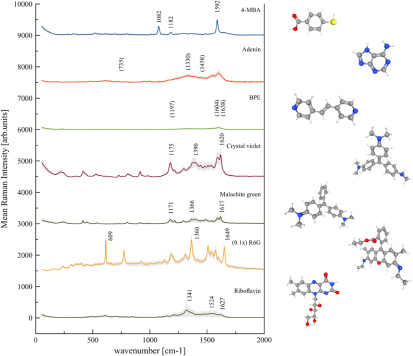
Figure 2. (left) Average value and standard deviation of the SERS spectra of different analytes with 1 mM concentration, recorded via Raman mapping with 532 nm laser excitation wavelength on Ag-coated standard tannin-furanic foam. The numbers above spectra indicate the position of prominent peaks [37–43], while on the right the corresponding molecular structures of measured analytes are shown [44–48].
Download figure:
Standard image High-resolution image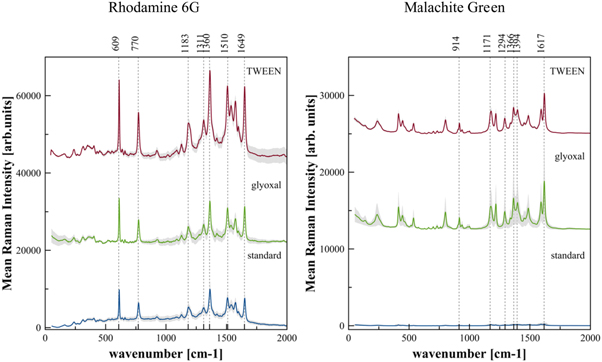
Figure 3. For three different Ag-coated tannin-furanic foam surfaces with different pore sizes, decreasing from standard (bottom) to glyoxal (center) to TWEEN (top) (as shown in table 2 and figure 1), average value and relative standard deviation (RSD) of the SERS spectra of (left) 1 mM R6G and (right) 1 mM Malachite Green, recorded via Raman mapping with 532 nm laser excitation wavelength. Numbers on top indicate the position of prominent Raman peaks [41, 42].
Download figure:
Standard image High-resolution image3. Results and discussion
The first experiments were performed by Raman mapping of standard tannin-furanic foam samples with a continuous 40 nm Ag layer deposited by DC Magnetron Sputtering. We recorded the Raman spectrum of the blank substrate to check if some Raman signal of the tannin foam is present in the signal background. Because of the continuity of the deposited Ag layer, no tannin foam Raman signal was observed. Next, 1 mM concentrations of 4-MBA, Adenine, BPE, Crystal Violet, Malachite Green, R6G and Riboflavin were deposited on standard tannin-furanic foam samples in order to evaluate the performance of the substrate over a broad range of analyte molecules. Figure 2 shows the calculated mean Raman intensities and RSDs (where for a better presentability the signal of R6G has been scaled by a factor of 1/10), clearly recognizing a SERS activity of the standard tannin-furanic foam substrate which is strongly analyte dependent. For Adenine and BPE no characteristic Raman peaks could be recorded, the spectrum background showing some features typical for carbonaceous materials [49]. Medium Raman signals were detected for Malachite Green and Riboflavin, showing high relative standard deviations. Qualitative good Raman signals were observed for Crystal Violet with a mean Raman intensity of 700 counts per second (cps) and RSD of 35% at 1618 cm−1, for 4-MBA with a mean Raman intensity of 494 cps and RSD of 18% at 1589 cm−1, and for R6G with a mean Raman intensity of 9960 cps and RSD of 21% at 1363 cm−1. These values have been calculated for the strongest peaks of each considered analyte [37–43].
Since for Adenine and BPE we did not detect any Raman signal at all, with the exception of some background features, we hypothesize that this depends on the stiff molecular structure, resulting in weak Raman scattering although the molecules are binding perpendicularly to the plasmonic surface [39, 50–52]. Since these molecules are of planar type, perpendicularly to the plasmonic surface no Raman modes are available which could be enhanced by the evanescent field. For Riboflavin, medium Raman signal with high relative standard deviation was observed, that we assume to originate from the different possible adsorption sites of the molecule. Indeed, Riboflavin has two methyl groups, two oxygen groups and a hydroxy group where it can bind to plasmonic surfaces. Malachite Green and Crystal Violet did show medium and good Raman signal, respectively. This is due to their molecular structure, which is quite similar but shows one extra –N(CH3)2 ligand for Crystal Violet, enabling it to bind at three positions compared to Malachite Green, which has the ability to bind on two positions orientating the molecule perpendicularly to the surface [53]. Also for 4-MBA we could appreciate a good Raman signal, which comes from the very well binding mercapto-group of the molecule [50, 54]. R6G is showing the best Raman intensity, which we assume to derive from the inherent strong Raman scattering ability of the molecule with 532 nm laser excitation [55, 56].
To test for μM detectability 1,4-BDT was then selected, because of its two thiol groups which have a strong binding affinity to Ag and Au surfaces [50]. Raman mapping measurements were performed on an Ag-coated standard tannin-furanic foam substrate sample after dipping it into 1 μM 1,4-BDT solution, but we could not observe any recognizable Raman signal (data not shown).
We can therefore assume that for lower concentrations a defined nanostructured [57] surface is necessary, which is not guaranteed by a simple DC magnetron sputtering procedure of a standard tannin-furanic foam surface. Indeed, we tried to deposit directly onto the standard tannin-furanic foam Ag nanoparticles, as obtained by metal nanoparticle synthesis using AgNO3 immersion plating technique: from the color change of the reaction mixture the occurring synthesis was observed by the naked eye. However, the only effect of the synthesized nanoparticles was, as expected, a strong increase of the Raman signal of the tannin-furanic foam itself [22], generated by the formed localized surface plasmon resonances of the Ag nanoparticles (data not shown).
Consequently, to further improve the sensitivity of the substrate, we created foams with smaller pores, as shown in figure 1. As described in the materials section, the glyoxal tannin-furanic foam type was synthesized by replacing water with glyoxal (C2H2O2) in the recipe of the standard tannin-furanic foam, while the TWEEN Pluronic tannin-furanic foam was synthesized by a different production process.
Figure 3 shows measurements with 1 mM solutions of R6G and Malachite Green performed on glyoxal tannin-furanic foam samples and on TWEEN Pluronic tannin-furanic foam samples, compared with the results of the measurements on standard tannin-furanic foam.
For glyoxal tannin-furanic foams, in the case of R6G the mean Raman intensity at 1360 cm−1 [42] showed an enhancement of 1,07 times, and a RSD increase by 2% with respect to standard tannin-furanic foam, while in the case of Malachite Green the mean Raman intensity at 1617 cm−1 [41] showed an enhancement of 28 times, and a RSD increase by 21%. The Raman signal enhancement was therefore moderate for R6G, while remarkable for Malachite Green.
For TWEEN Pluronic tannin-furanic foams, in the case of R6G the mean Raman intensity at 1360 cm−1 [42] showed an enhancement by 2,25 times and a RSD increase by 6% compared to the standard foam, and an enhancement by 2,11 times and a RSD increase by 4% compared to glyoxal type. In the case of Malachite Green the mean Raman intensity at 1617 cm−1 [41] showed an enhancement by 23,36 times and a RSD decrease by 36% compared to the standard foam, and an enhancement by 0,82 times and a RSD decrease by 58% compared to the glyoxal type.
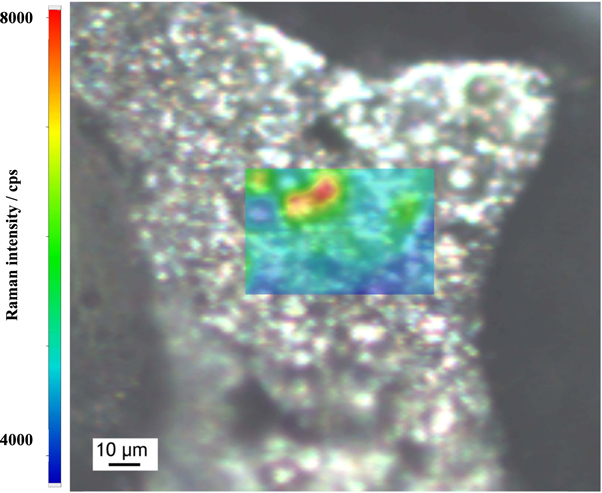
An image of a silver coated TWEEN Pluronic tannin-furanic foam sample with the sample area overlayed with the intensity map is shown in figure 4. The red and yellow domains indicate areas of highest SERS enhancement within this map, due to good hot spot formation.
Figure 4. Optical microscopy image of a silver coated TWEEN Pluronic tannin-furanic foam sample, overlayed with the Raman mapping area showing the intensity of the Raman spectrum at 1171 cm−1 of 1 mM Malachite Green solution applied to the sample.
Download figure:
Standard image High-resolution image
Summarizing, for the Ag-coated glyoxal type tannin-furanic foam we recorded by Raman mapping R6G Raman spectra of nearly equal intensity and RSD as with standard tannin-furanic foam, but for Malachite Green a significantly enhanced SERS signal. We think this is another proof that the strong Raman signal of R6G predominantly originates from the inherent scattering strength and resonance Raman enhancement of R6G at 532 nm [55, 56], and to a less extent from the SERS performance of these two substrates at the analyte concentration of 1 mM. With Malachite Green we already see good enhancement of the Raman signal with the Ag-coated glyoxal type tannin-furanic foam, but also an increasing RSD, which points to a not very homogenously distributed surface enhancement.
In comparison with Ag-coated glyoxal type tannin-furanic foam, the finer pore structure of the Ag-coated TWEEN Pluronic tannin-furanic foam allows some increase in the Raman intensity of R6G, which can be a hint of a starting enhancement for this analyte molecule by the structured surface of such a type of SERS substrate. With 1 mM Malachite Green as analyte we see a comparable enhancement of the Raman intensity as when using the Ag-coated glyoxal tannin-furanic foam, but with a significant improvement in RSD, pointing to a better and more homogenous hot spot distribution across the substrate's surface, as illustrated in figure 4.
4. Conclusion
In this article, we demonstrate the production of a SERS active substrate with a porous, bio-based material. The foam structure and morphology, as naturally obtained during the production process, already shows the characteristics necessary to act as a SERS substrate template. After the production of the foams, no further cost intensive or complicated steps like a lithography process, etching, or other nano-structuring techniques are needed to create, manipulate, or guide the surface morphology. Only a simple DC magnetron sputtering process was applied to coat the tannin-furanic foams with a thin and continuous Ag-layer to provide the required plasmonic surface. As a starting point, we could show the possibility of detecting already with a functionalized standard tannin-furanic foam type a couple of analytes in the mM regime, out of a set of well-known SERS analytes. We furthermore could show that some modifications of the foam recipe lead to smaller pore structures, thereby significantly increasing the Raman signal of Malachite Green and lowering the RSD. For R6G, which is a strong Raman scatterer, also a slight increase of the Raman signal was observed, but here it must be also considered that R6G also shows a resonance Raman contribution at the investigated laser excitation wavelength of 532 nm [55, 56].
The simple and cost-efficient approach of SERS substrates based on tannin-furanic foams is very promising, similarly to the one for paper-based SERS substrates [19]. As stated at the beginning, this work represents a feasibility study and opens opportunities for new investigations in this field, combining the sustainability of the substrate with promising results for the detection of at least mM concentrations of analyte molecules. Further research on additional analytes and concentrations relevant for specific applications will be the target of future activities. Specifically, due to the foam structure and morphology, these SERS substrates may be usable as Raman signal enhancer for non-destructive investigations by portable Raman spectrometers in applications like wastewater treatment or drinking-water purification.
Acknowledgments
The authors thankfully acknowledge financial support provided by the European Regional Development Fund and Interreg V-A Italy–Austria 2014–2020 through the Interreg Italy–Austria project ITAT 1023 InCIMA (http://www.elettra.eu/Prj/InCIMa/) and ITAT 1059 InCIMa4 (https://www.incima4.eu/de/home/).
Data availability statement
All data that support the findings of this study are included within the article (and any supplementary files).