
Abstract
Solid acid composites of CsH2PO4/NaH2PO4/ZrO2 with different weight ratios of CsH2PO4 (CDP), NaH2PO4 (SDP), and ZrO2 were synthesized and characterized. The characterizations of the solid acid composite were carried out for determining structure, thermal stability, and conductivity, utilizing x-ray Diffraction, Fourier Transform Infrared Spectroscopy, Thermogravimetric analysis, Differential Thermal Analysis, and conductivity measurements. The composite powders were in the form of pellets of 4 mm thickness for conductivity measurement. SDP in the composites has a large effect on the conductivity measurement and this material increased the low-temperature conductivity of CDP by up to 1.5 orders of magnitude. The superprotonic transition was identified at temperatures from 220 to 270 °C in CDP/SDP/ZrO2 composites under atmospheric pressure. The thermal stability of the solid acid composites for dehydration, melting, and decomposition was investigated in the temperature range of 50 to 300 °C under environments with atmospheric humidification.
Export citation and abstract BibTeX RIS

Original content from this work may be used under the terms of the Creative Commons Attribution 4.0 licence. Any further distribution of this work must maintain attribution to the author(s) and the title of the work, journal citation and DOI.
1. Introduction
Demands for stable and reliable energy are increasing as a renewable source. The entire energy system must be restructured using fully renewable energy to achieve a better climate. Fuel cells are becoming an attractive alternative to combustion engines due to the high efficiency and low pollution levels in electric power generation [1]. Recently, new studies are based on solid acid electrolytes, which show high ionic conductivity and good mechanical properties for fuel cells. The solid acid fuel cell tolerates impurities operating at intermediate temperatures (200 °C–300 °C) that pose obstacles for other fuel cell technologies using reduced metal components [2–6]. The general chemical formula MaHb(XO4)c represents an important group of solid acid electrolytes, where M = Cs, Na, Rb, Li, NH4, and X = P, As, S, Se, and a, b, c are integers [7]. This family passes at least one phase transition at high temperatures, corresponding to an increase in proton conductivity [8]. CsHPO4 and CsH2PO4 belong to a category of solid acid electrolytes [9–13]. CsH2PO4 (CDP) is one of the most widely studied solid acids that have higher proton conductivity in the range of 10−3–10−1 S cm−1 at temperatures around 230 °C. CDP undergoes a superprotonic phase transition upon heating at 230 °C [14] in which their proton conductivity increases up to three orders of magnitude upon heating. At high temperatures, the cubic form of CDP is shown to behave as a superprotonic phase. Studies on CDP have been focusing on its stability and received renewed interest due to its potential use as a solid electrolyte [15–20]. The thermal stability of CDP at temperatures above the phase transition is increased and its dehydration can be sufficiently suppressed [21]. To produce a composite with higher conductivity values and improved thermal properties and stability, a solid acid is mixed with other solid acids or oxides [16]. NaH2PO4 (SDP) is an interesting material, which is used due to its potential technological applications and high stability of sodium ions [22, 23]. It is also used in food, water treatment, medicine, chemical industries, and other fields [24–26]. At low temperatures, SDP increases the conductivity of CDP up to 2 to 3 orders of magnitude [15]. The conductivity of confined electrolyte CDP/ZrO2 was observed 1.8 × 10⁻² S cm−1 for 2000 min [27]. A substantial change in protonic conductivity of CDP/NaH2PO4/SiO2 was observed 0.9 × 10⁻² S cm−1 at the temperature of 150 °C [28]. The conductivity of solid acids increases by using heterogeneous doping of highly dispersed inert oxides e.g. ZrO2, TiO2, SiO2, and Al2O3. This conductivity is significantly higher than the pure CDP value under the same conditions.
The work is devoted to the study of conductivity, structural, and thermal properties of CDP/SDP/ZrO2 composite electrolytes in several compositions. The structural, thermal stability and conductivity were investigated by x-ray Diffraction (XRD), thermogravimetric analysis (TGA), and differential thermal analysis (DTA), Fourier Transform Infrared Spectroscopy (FTIR).
2. Materials and methods
CDP was prepared by mixing stoichiometric solutions of the starting reagents Cs2CO3 and H3PO4 combined in a molar ratio of 1: 2 according to the following reaction

In CDP synthesis, a measured amount of Cs2CO3 will be dissolved in distilled water. The mixture will be then stirred for 30 min until a clear solution will be produced. Phosphoric acid will be added dropwise into the mixture with continuous stirring for another 30 min. The solution will be vacuum filtered to produce CDP as a white precipitate. The solid layer will be washed with acetone and then calcined at 150 °C for 2 h to remove residual water and grinded to produce powdered CDP. To prepare SDP, we applied the same process as CDP, and Na2CO3 is used in place of Cs2CO3.
CsH2PO4/ZrO2 composites will be synthesized by mechanically mixing CDP with zirconium dioxide. Solid acid composites CsH2PO4/ZrO2 mixed with NaH2PO4 at the weight ratio by mechanical grinding. The mixture was dried for 14 h at 150 °C to produce the white precipitated solid acid compositions CDP/SDP/ZrO2. Then, the resultant precipitate was grinded to produce fine solid acid composite powders. The composite powders will be then pressed at 5–7 tons at room temperature for 15 min to form pellets of 4 mm thickness and 12 mm diameter. The electrode on pellets will be made by a High Vacuum Coating unit (Hind High Vacuum-12A4D) and then sintering at 90 °C for 2 h. Powder x-ray diffraction (XRD) patterns of the sample were collected on a Bruker D8 Advance diffractometer using CuKα radiation (k = 1.5418 A° ) in the 2θ range of 20 °C–60 °C, to confirm their identity. The decomposition of solid acid composites is identified by measuring the mass loss as a function of temperature with Thermogravimetric analysis (TGA), and Differential Thermal Analysis (DTA) by SII 6300 Exstar. For the phase transition of solid acid, the performance of endothermic or exothermic peaks appears by TGA/DTA measurements during heating of solid acid. TGA/DTA was performed respectively using powder samples kept in air and heated from 35 to 500 °C at a rate of 10 °C min−1 under airflow 200 ml min−1. The proton conductivity value was determined from the impedance data plotted on real and imaginary axes, Zre and –Zim respectively. The pallets will be used for measuring ionic conductivity at room temperature to 300 °C temperature. The LCR Meter (Hikoki 3532-50) is used to measure the conductivity in the frequency range of 50 Hz to 4 MHz for impedance. The ionic conductivity value will be calculated from the resistance value R, temperature dependences of the conductivity plotted in Arrhenius form by the following formula

Where R is the resistance, L is the thickness of the electrolytes and A is the electrolyte pellet area.
Fourier-transform infrared spectroscopy (FTIR) is used to identify functional groups in solid acid materials. A few granules of the annealed powder samples are finely grinded with 0.15 g of potassium bromide and pressed into pellets. The FTIR 8400S (Shimadzu) spectrometer collected the spectrum of these pellets was between 400 to 4000 cm−1 wavenumbers at room temperature.
3. Results and discussion
3.1. X-ray diffraction (XRD)
To identify the phase transition, we conducted x-ray diffraction analyses for CDP, SDP, ZrO2, and its composites in the powdered form under atmospheric conditions in the range 2θ = 20° to 60° is plotted in figure 1.
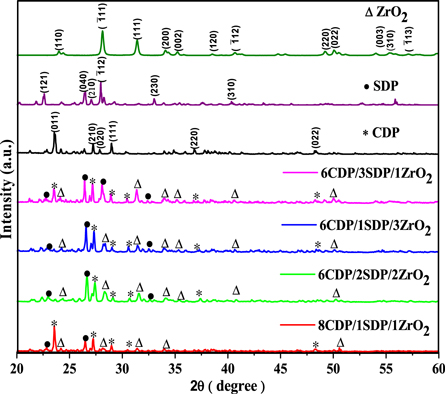
Figure 1. Powder x-ray diffractograms data for CsH2PO4, NaH2PO4, ZrO2, 8CDP/1SDP/1ZrO2, 6CDP/2SDP/2ZrO2, 6CDP/1SDP/3ZrO2, and 6CDP/3SDP/1ZrO2.
Download figure:
Standard image High-resolution imageThe XRD spectra of CDP obtained as JCPDS#76–1836 and similar sharp peaks appear at 23.53°, 27.37°, 27.96°, 29.03°, 36.91°, and 48.37°. The peak at approximately 23.53° corresponding to the Miller indices of (011), which shows the monoclinic phase space group P21/m for CDP and P21/c for SDP. The monoclinic phase structure of CDP exists from room temperature up to 235 °C and from 240 to 280 °C, only the cubic phase is evident [28, 29]. The partial dehydration of CDP is at a temperature between 235 °C and 310 °C that produces Cs2H2P2O7 and CsPO3 respectively, reduces the intensity of the diffraction peak. To restrain the dehydration reaction, we add ZrO2 and SDP in solid acid composites. SDP has peaked at 22.47°, 26.37°, 27.03°, 27.96°, 33.006°, and 40.29° as JCPDS#84–0112 and ZrO2 peaked at 23.99°, 28.10°, 31.47°, 34.002°, 35.18°, 38.50°, 40.62°, 49.23°, 50.09°, 54.07°, 55.40°, and 57.11° as JCPDS 37–1484. All peaks of the composites are the same as those observed for CDP, SDP, and ZrO2 and XRD patterns for initial salts agreed well with JCPDS data. So CDP, SDP, and ZrO2 samples have a monoclinic phase at room temperature. Tables 1 and 2 (a-c), show the calculated values of the intense peaks and lattice parameters of XRD. The observed and calculated values confirm the XRD data and given a reasonable true structure.
Table 1. Lattice parameters of CDP, SDP, and ZrO2 in composites.
| Material | JCPDS Lattice Parameters (Å) | CDP | SDP | ZrO2 | 8CDP/1SDP/1ZrO2 | 6CDP/2SDP/2ZrO2 | 6CDP/1SDP/3ZrO2 | 6CDP/3SDP/1ZrO2 |
|---|---|---|---|---|---|---|---|---|
| CDP | a = 7.9 | 7.533 | — | — | 7.530 | 7.561 | 7.518 | 7.555 |
| b = 6.368 | 6.397 | — | — | 6.304 | 6.297 | 6.247 | 6.346 | |
| c = 4.872 | 4.698 | — | — | 4.992 | 4.622 | 4.615 | 4.676 | |
| SDP | a = 6.808 | — | 6.788 | — | 6.924 | 6.683 | 6.620 | 6.613 |
| b = 13.49 | — | 13.468 | — | 13.449 | 13.495 | 13.413 | 13.47 | |
| c = 7.331 | — | 7.335 | — | 7.353 | 7.312 | 7.342 | 7.370 | |
| ZrO2 | a = 5.312 | — | — | 5.243 | 5.218 | 5.243 | 5.267 | 5.295 |
| b = 5.212 | — | — | 5.196 | 5.156 | 5.277 | 5.190 | 5.217 | |
| c = 5.147 | — | — | 5.091 | 5.061 | 5.055 | 5.077 | 5.096 |
Table 2. The calculated values of the intense peaks of (a) CDP, (b) SDP, and (c) ZrO2, with its composites of XRD.
| Material | hkl | Peak Position (2θ) | FWHM | Crystallite Size (nm) | Microstrain ε × 10–4 | Lattice Spacing (Å) |
|---|---|---|---|---|---|---|
| (a) | ||||||
| CDP | 400 | 48.328 | 0.279 | 31.132 | 11.134 | 1.881 |
| 8CDP/1SDP/1ZrO2 | 400 | 48.307 | 0.272 | 32.005 | 10.83 | 1.882 |
| 6CDP/2SDP/2ZrO2 | 400 | 48.091 | 0.186 | 46.729 | 7.417 | 1.890 |
| 6CDP/1SDP/3ZrO2 | 400 | 48.387 | 0.122 | 70.896 | 4.889 | 1.879 |
| 6CDP/3SDP/1ZrO2 | 400 | 48.295 | 0.306 | 28.420 | 12.196 | 1.882 |
| (b) | ||||||
| SDP | 121 | 22.578 963 02 | 0.191 | 42.252 | 8.203 82 | 3.934 |
| 002 | 24.248 3439 | 0.261 | 31.034 | 11.169 36 | 3.667 | |
| 210 | 27.067 270 31 | 0.161 | 50.585 | 6.852 41 | 3.291 | |
| 8CDP/1SDP/1ZrO2 | 121 | 22.819 02 | 0.155 | 51.974 | 6.669 28 | 3.893 |
| 002 | 24.187 12 | 0.105 | 76.835 | 4.511 38 | 3.676 | |
| 210 | 27.238 75 | 0.134 | 60.697 | 5.710 86 | 3.271 | |
| 6CDP/2SDP/2ZrO2 | 121 | 22.992 07 | 0.377 | 21.465 | 16.148 37 | 3.865 |
| 002 | 24.3261 | 0.461 | 17.611 | 19.682 15 | 3.656 | |
| 210 | 27.136 86 | 0.191 | 42.753 | 8.107 71 | 3.283 | |
| 6CDP/1SDP/3ZrO2 | 121 | 22.920 080 64 | 0.410 | 19.727 | 17.5708 | 3.877 |
| 002 | 24.223 224 18 | 0.201 | 40.389 | 8.582 36 | 3.671 | |
| 210 | 26.911 522 18 | 1.06 | 7.703 | 44.998 46 | 3.31 | |
| 6CDP/3SDP/1ZrO2 | 121 | 22.598 813 74 | 0.241 | 33.513 | 10.343 01 | 3.931 |
| 002 | 24.120 169 47 | 0.416 | 19.481 | 17.792 91 | 3.686 | |
| 210 | 27.191 223 48 | 0.132 | 61.627 | 5.624 65 | 3.276 | |
| (c) | ||||||
| ZrO2 | 120 | 38.542 | 0.238 | 35.240 | 9.836 | 2.333 |
| 8CDP/1SDP/1ZrO2 | 120 | 38.586 | 0.547 | 15.381 | 22.535 | 2.331 |
| 6CDP/2SDP/2ZrO2 | 120 | 38.701 | 0.310 | 27.140 | 12.772 | 2.324 |
| 6CDP/1SDP/3ZrO2 | 120 | 38.581 | 0.371 | 22.656 | 15.299 | 2.331 |
| 6CDP/3SDP/1ZrO2 | 120 | 38.469 | 0.444 | 18.945 | 18.296 | 2.338 |
The intensity of the peaks decreases by changing the concentration of the additives of SDP and ZrO2, which suggests an increase in the degree of amorphousity in the composites. This phenomenon leads to ion diffusivity with ionic conductivity and stability [30]. XRD patterns confirm the crystalline structure of CDP, SDP, and ZrO2 and its composites.
3.2. Fourier transform infrared spectroscopy (FTIR)
The IR spectrum of CDP, SDP, and its composite are shown in figures 2(a), (b) and their values are given in table 3.
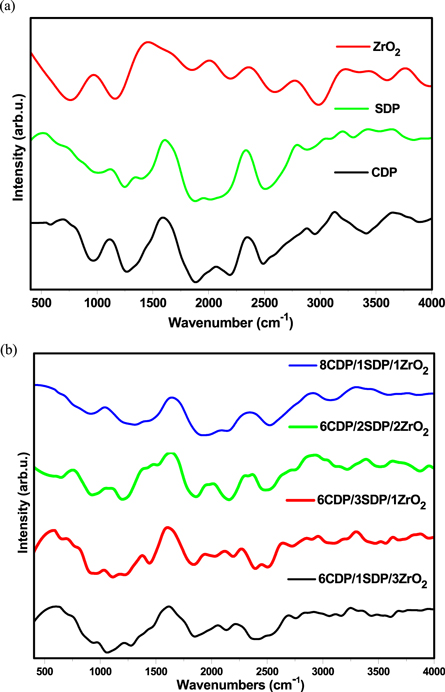
Figure 2. Infrared spectra for (a). CDP, SDP, and ZrO2 (b). 8CDP/1SDP/1ZrO2, 6CDP/2SDP/2ZrO2, and 6CDP/3SDP/1ZrO2.
Download figure:
Standard image High-resolution imageTable 3. The comparison of functional groups present in FTIR of CDP and composites electrolytes.
| O-H Stretching Intermolecular Bonded | |||||
|---|---|---|---|---|---|
| Material | O-H Stretching Medium Sharp 3584-3700 | Strong Broad 3550-3200 | Weak Broad 3200-2700 | ABC bonds of OH | P-O2 stretching (Asymmetric) |
| CDP | 3647 | 3386 | 2934 | 2344 | 1113 |
| SDP | 3614 | 3419 | 3002 | 2334 | 1104 |
| 8CDP/1SDP/1ZrO2 | 3632 | 3369 | 2912 | 2366 | 1039 |
| 6CDP/1SDP/3ZrO2 | 3607 | 3357 | 2918 | 2414 | 1062 |
| 6CDP/2SDP/2ZrO2 | 3628 | 3387 | 2919 | 2343 | 1053 |
The infrared transmittance spectra of the material were taken in the range of 400 cm−1 to 4000 cm−1 for determining the presence of hydrogen bonds and PO4 −3 anions in the composite electrolytes. The well-separated peaks of CDP and SDP related to the ABC bonds of OH in IR spectra at 2344 cm–1 and 2334 cm–1. The strong absorption bands in the IR spectra at 900 to 1300 cm−1 assigned to the components of the PO4. The bands at 1113 cm−1 and 1104 cm–1 are attributed to the P–O2 asymmetric stretching modes in the H2PO4 - anion. The well-separated peaks of CDP, SDP, and composites were observed in IR spectra at 3200–2700 cm–1, 3550–3200 cm–1, and 3584–3700 cm–1 given in table 3 which are indicated to the stretching of O–H bonds.
The IR spectra measured in this work are compared with previous work results [16]. It was found that the solid acid composite did not come to any obvious change in the pattern of IR spectra when SDP was added. Although it increases the frequency of the transmittance bands slightly, this indicates a lengthening of P–O–H and shortening of P–O bonds. The intensity of composite decreases with the increase of doped ZrO2 concentration. This suggests that the amorphous region increased in the composite electrolyte which was in favor of the XRD results.
3.3. Thermal analysis - TGA/DTA
Determine the amount of residual water in the powders was studied by TGA/DTA analyses and the results are shown in figures 3(a) and (b). The main mass losses of powders from the initial powders were observed until 500 °C. The measurements were made under an air atmosphere at 10 °C min−1. The total weight loss for CDP dehydration is 8.73% at 500 °C, which is equal to the theoretical value of CDP [5]. CDP undergoes two endothermic transitions at 150 °C and 230 °C respectively [31]. TGA measurement has shown in figure 3(a) that the weight loss of CDP is 1.95% up to 230 °C, 3.13% at 274 °C and 7.70% at 373 °C indicate the endothermic effect associated with the superprotonic phase transition in CDP at this temperature, which supports the conductivity measurement. It is favorable that CDP is thermally stable up to 230 °C.
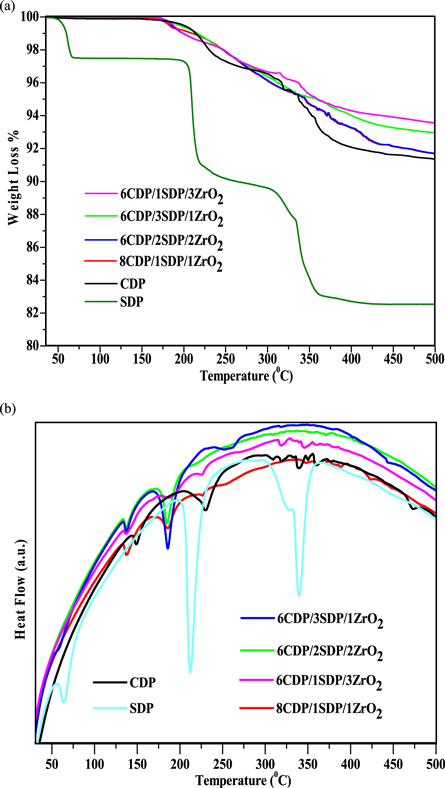
Figure 3. (a) TGA and (b) DTA for CDP, SDP and their composites in air flow 200 ml min−1.
Download figure:
Standard image High-resolution imageThe weight loss of SDP is 2.4%, 8.7%, and 16.28% at the temperature of 65 °C, 217 °C, and 350 °C respectively. The dehydration of SDP undergoes at several temperatures between 60 °C and 360 °C. The condition of 60 °C in SDP defines the water molecules in it. The TGA graph of SDP indicated that it undergoes two-stage dehydration. The first one associated with a weight loss of 9% at 220 °C and the second 17% was dehydration at 350 °C with overall weight loss. Therefore, adding SDP to solid acid composites at low temperatures leads to dehydration compared to pure CDP [32].
The DTA curve of pure CDP, as shown in figure 3(b), shows endothermic events at temperatures 150 °C, 230 °C, 310 °C, 320 °C, 340 °C, 350 °C, 360 °C, and 375 °C. DTA curves of composites show similar events for CDP.
Due to the superprotonic phase transition of CDP, the endothermic effect was invisible for the 6CDP/2SDP/2ZrO2 sample at 229 °C. DTA curve of SDP showed three endothermic events at temperatures around 64 °C, 211 °C, and 340 °C. TGA/DTA results indicate an improvement in thermal stability for composites.
3.4. Conductivity
The impedance spectra of CDP and its composite measurements were taken in the form of a Nyquist plot, as shown in figures 4(a)–(d).
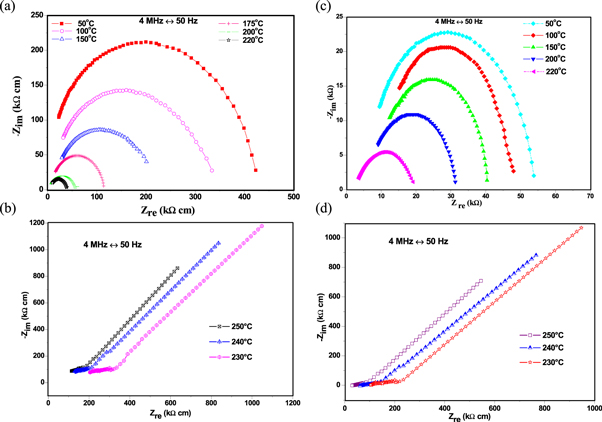
Figure 4. The impedance measurement of CDP, SDP and composites at different temperature plotted in Nyquist plot. (a). CDP at 50 °C, 100 °C, 150 °C, 175 °C, 200 °C, and 220 °C (b). CDP at 230 °C, 240 °C, and 250 °C (c). 8CDP/1SDP/1ZrO2 at 50 °C, 100 °C, 150 °C, 200 °C and 220 °C (d). 8CDP/1SDP/1ZrO2 at 230 °C, 240 °C, and 250 °C.
Download figure:
Standard image High-resolution imageThe plot shows two patterns for each CDP, SDP, 8CDP/1SDP/1ZrO2, and 6CDP/2SDP/2ZrO2 at below the transition temperature and higher temperatures. At lower temperatures, the impedance plots have the form of a semicircle arc, representing processes at the electrolyte/electrode interface of the system [33]. The straight line represents a dramatic increase in ionic conductivity upon heating above a transition temperature is most likely due to the same monoclinic (P21/m) to cubic (Pm-3m) phase transition as the one observed in the undoped compound CsH2PO4. The curve of the Nyquist arc is seen to decrease with increasing temperature and the ionic conductivities of the electrolytes increase in the low-temperature region. The conductivities of the CDP were found sufficiently high at transition temperature due to high phosphorus content and that the O-H concentration and free hydrogen-bonded play an important role in determining the ionic conductivity [29, 34]. We have conducted similar measurements and analyses on the other composites and found the same behaviors. For CDP and its composites as shown in figures 4(a)–(d), Impedance spectra exhibited almost a similar characteristic as showed in the conductivity graph.
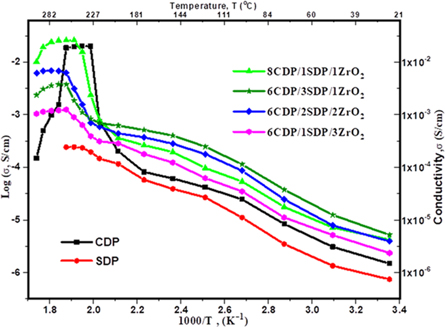
The conductivities of CDP and its composites are presented in figure 5 and table 4.
Figure 5. Proton conductivity of CDP, SDP and Composites.
Download figure:
Standard image High-resolution image
Table 4. Conductivity values of CDP, SDP, and its composites at different temperatures.
| Material | Highest Conductivity Value, σ (S cm−1) | Temperature During Conductivity Measurement (°C) |
|---|---|---|
| CDP [33] | 2.2 × 10⁻² S cm−1 | 240 |
| CDP(Pure) | 2.008 × 10⁻² S cm−1 | 240 |
| SDP(Pure) | 2.43 × 10⁻⁴ S cm−1 | 250 |
| 8CDP/1SDP/1ZrO2 | 2.23 × 10⁻² S cm−1 | 250 |
| 8CDP/1SDP/1ZrO2 | 2.23 × 10⁻² S cm−1 | 260 |
| CDP(Pure) | 1.87 × 10⁻² S cm−1 | 260 |
| 6CDP/3SDP/1ZrO2 | 3.76 × 10⁻³ S cm−1 | 260 |
| SDP(Pure) | 2.42 × 10⁻⁴ S cm−1 | 260 |
| CDP(Pure) | 1.94 × 10⁻² S cm−1 | 250 |
| 6CDP/3SDP/1ZrO2 | 1.86 × 10⁻³ S cm−1 | 250 |
| 8CDP/1SDP/1ZrO2 | 1.57 × 10⁻² S cm−1 | 240 |
| 6CDP/3SDP/1ZrO2 | 1.11 × 10⁻³ S cm−1 | 240 |
| SDP(Pure) | 2.35 × 10⁻⁴ S cm−1 | 240 |
| CDP(Pure) | 2.001 × 10⁻² S cm−1 | 230 |
| 8CDP/1SDP/1ZrO2 | 2.38 × 10⁻³ S cm−1 | 230 |
| 6CDP/3SDP/1ZrO2 | 8.42 × 10⁻⁴ S cm−1 | 230 |
| SDP(Pure) | 1.96 × 10⁻⁴ S cm−1 | 230 |
| 8CDP/1SDP/1ZrO2 | 7.84 × 10⁻⁴ S cm−1 | 220 |
| CDP(Pure) | 7.44 × 10⁻⁴ S cm−1 | 220 |
| 6CDP/3SDP/1ZrO2 | 6.93 × 10⁻⁴ S cm−1 | 220 |
| SDP(Pure) | 1.46 × 10⁻⁴ S cm−1 | 220 |
| 6CDP/3SDP/1ZrO2 | 6.20 × 10⁻⁴ S cm−1 | 200 |
| 8CDP/1SDP/1ZrO2 | 3.61 × 10⁻⁴ S cm−1 | 200 |
| CDP(Pure) | 2.03 × 10⁻⁴ S cm−1 | 200 |
| SDP(Pure) | 1.16 × 10⁻⁴ S cm−1 | 200 |
| 6CDP/3SDP/1ZrO2 | 4.02 × 10⁻⁴ S cm−1 | 150 |
| 8CDP/1SDP/1ZrO2 | 1.96 × 10⁻⁴ S cm−1 | 150 |
| CDP(Pure) | 6.17 × 10⁻⁵ S cm−1 | 150 |
| SDP(Pure) | 3.91 × 10⁻⁵ S cm−1 | 150 |
We found a CDP conductivity value of 2.008 × 10⁻² S cm−1 at 240 °C, which is compared to the value determined by other results [35]. The conductivity of CDP/SDP/ZrO2 was conducted between 25 °C and 300 °C. SDP is known for its low conductivity and its absence of superprotonic behavior. The conductivity of SDP was measured to be 2.43 × 10⁻⁴ S cm−1 at 250 °C. Ponomareva et al represent the conductivity at lower temperatures between 100 °C and 210 °C and indicate that the composite shows high stability with pure CDP as shown TGA/DTA [28]. This higher conductivity arises due to defects at the interface of both components. The main conductivity value of all composites varies from 7.88 × 10⁻⁶ S cm−1 to 2.23 × 10⁻² S cm−1. The solid acid composite 8CDP/1SDP/1ZrO2 shows the highest value of conductivity 2.23 × 10⁻² S cm−1 at 260 °C from other composites. We also found that the hydrophobicity and surface area of ZrO2 slightly increase the conductivity of the solid acid composites at higher temperatures [16]. The conductivity of CDP/SDP/ZrO2 in the LT region and higher temperatures rises to 1.5 orders of magnitude due to structural disorder and distortion by the cation size of ZrO2 [5, 29]. We found that adding SDP increases the conductivity and stability at the lower temperature of the solid acid composites. The results of conductivity are favorable to the x-ray and TGA/DTA data.
4. Conclusions
Composite electrolytes of CsH2PO4, NaH2PO4, and ZrO2 were prepared in weight ratio and their properties were analyzed within the intermediate temperature range. X-ray diffraction measurements confirmed the solid solution of CDP and its composites at room temperature. Our results show that the dehydration of CDP undergoes at 280 °C, while SDP dehydration peaks were observed up to 340 °C as discussed in TGA, and DTA indicating that SDP is thermally unstable at high temperatures. Our findings demonstrate that the superprotonic phase of CDP can be stabilized using SDP at high temperatures. The superprotonic nature of the conduction confirms by Nyquist plots. TGA/DTA showed significant improvement in the thermal stability of the composites. The conductivity value of the composites ranges from 7.88 × 10⁻⁶ S cm−1 to 2.60 × 10⁻² S cm−1. 8CDP/1SDP/1ZrO2 showed the highest value of conductivity in all composites and was found to be a promising material which is comparable to the CDP/SDP/SiO2, CDP/TiO2, CDP/SiO2, and CDP/ZrO2 obtained by N Mohammad et al [28], D Singh et al [36], J H Leal et al [37], and A H Jensen et al respectively [21]. The conductivity of composites in the LT region and higher temperatures increases up to 1.5 orders of magnitude. The FTIR analysis confirmed the mechanism of proton transport within CDP, SDP, ZrO2, and its composites. These results open new possibilities for large-scale applications of CDP and other solid acids as phosphoric acid fuel cells.
Acknowledgments
The authors thank the Material Science Research Laboratory, Department of Physics, Gurukula Kangri (Deemed to be University) Haridwar (India) for providing facilities for research work.
Data availability statement
All data that support the findings of this study are included within the article (and any supplementary files).