
Abstract
Quest for alternate energy sources is the core of most of the research activities these days. No matter how small or large amount of energy can be produced by utilizing the non-conventional techniques and sources, every bit of innovation can reshape the future of energy. In this work, experimental analysis of the thermoelectric (TE) properties of bulk-graphene in the temperature range of (303 to 363) K is presented. Graphene powder was pressed to form a pellet which was used to fabricate the TE device. The effects of temperature on the Seebeck coefficient, electrical and thermal conductivities, and the dimensionless figure of merit (FOM) were measured. The increasing value of the Seebeck coefficient (thermopower) with temperature is indicant of the metallic behavior. Additionally, the observed thermopower (TEP) is positive, which shows that the majority charge carriers are holes and peaked to a value of 56 μV K−1 at 363 K. The thermopower of the pellet is four times larger than the previously reported values for single layer graphene (SLG) and few layer graphene (FLG). In addition to this, low values of the thermal conductivity were observed for the pellet which is one of the requirements of a good TE material. Besides this, an upward trend is observed with increasing temperature for FOM, which attains a peak value of 0.0016 at 363 K, which is almost ten times that of the previously reported values.
Export citation and abstract BibTeX RIS

Original content from this work may be used under the terms of the Creative Commons Attribution 4.0 licence. Any further distribution of this work must maintain attribution to the author(s) and the title of the work, journal citation and DOI.
1. Introduction
Energy has been the most important part of human society since long. The modern-day lifestyle of humanity cannot survive without continuous supply of energy. From personal mobile phones and electronic gadgets to country level power houses and defence, energy is being utilized in one form or the other, and the demand is rising with each passing day [1]. Depletion is one among other drawbacks associated with the conventional energy sources [2]. A solution to such energy crisis is to develop renewable energy resources which include the wind, tides, sunlight, waves, and geothermal heat. These areas of energy production are the focus of many researches since decades. Thermoelectric generators (TEGs), which can use waste heat to generate electrical energy is one another highly appreciated way of energy generation. It can use the waste heat generated during combustion processes, chemical reactions and other heat generating systems, and can play a vital role in solving the present-day energy problem. TEGs convert the waste heat energy directly into useful electrical power [3]. However, TEGs cannot replace the conventional generators due to their low conversion efficiencies, but can be used in cogeneration systems where they can convert waste heat into useful energy thus improving the overall efficiency of the generation system. Efforts are needed to develop highly efficient TEGs so that they can function as stand-alone power systems.
Here we present an experimental study on the thermoelectric (TE) properties of graphene, a two-dimensional (2D) crystalline monolayer of graphite having a thickness of 0.34 nm [4, 5]. The structure of graphene resembles a honeycomb lattice in which each carbon atom is covalently bonded to three other carbon atoms [6]. The intriguing properties of the graphene result from of its unique structure [7–10]. The remarkable physical properties of graphene and its potential applications in solar cells [11–13], transistors [14–17], and sensors [18–23] have garnered the interest of the researchers in the recent years. For graphene fabricated by a scotch tape method, charge carrier mobility attains a peak value of 106 cm2/Vs at  [24]. However, this mobility is greatly dependent on the substrate on which graphene is deposited [25]. It should be noted that the mobility of electrons is the same as the mobility of holes in graphene. Due to crystalline structure and the light weight of the carbon atoms which form graphene, it is predicted theoretically that graphene exhibits high thermal conductivity at room temperature [26, 27]. Besides the theoretical studies, few experimental studies on single-layer graphene (SLG) reported that the thermal conductivity of graphene varies from (600–5300) W mK−1 [27, 28].
In the recent years, TE properties of graphene remained the subject of intensive research and it was theoretically predicted that the dimensionless figure of Merit (FOM) could be greater than 4 [29–32]. However, experimental results are not that much assuring as the FOM values are much less than 1 [33, 34]. Low thermopower (TEP) of graphene and its high thermal conductivity are the main factors contributing to the low values of the dimensionless FOM. However, efforts are needed to reduce the thermal conductivity and enhance the TEP, to get high FOM for graphene-based TE devices [35]. Previously, measurement of the TE properties of graphene involved either single-layer graphene (SLG) [36, 37] or few-layer graphene (FLG) [38–40]. Here, we have investigated TE properties of bulk-graphene pressed in pellet form, for the first time and noted that the TEP varies linearly with the temperature. A maximum TEP of 56 μV K−1 is observed for the graphene pellet (GP) at 363 K which is comparable with the maximum reported value of 80 μV K−1 in the temperature range of (475–575) K for FLG [40]. The TEP of the bulk-graphene is found to be greater than the SLG [36] and FLG [38]. This shows that an increase in the dimensionality of the graphene sample from SLG or FLG to bulk-graphene tends to increase the TEP of graphene.
2. Experimental setup
Powder graphene was used to fabricate pellet using a manual hydraulic pressing machine. The die filled with a weighted amount of graphene powder was kept under a pressure of 600 bars for 180 s. The pellet formed had a diameter of 17 mm while the thickness was 1.5 mm. Copper (Cu) electrodes (due to their high electrical conductivity) were fine-tuned on the pellet affixed to a glass substrate. The distance between the Cu electrodes was equal to 11 mm. Figure 1 shows the fabricated graphene pellet. For thermoelectric measurements, a rectangular sample with dimensions equal to 17 × 6 mm2, was cut from the pellet.

Figure 1. Graphene pellet.
Download figure:
Standard image High-resolution imageIn this experimental work, heat was provided to both ends of the pellet using two separate resistors (each 5 W) powered by separate DC supplies. The amount of heat generated by each heater was controlled using the current supplied by the power supplies. When a difference of temperature was established between the two ends of the pellet, a voltage was generated due to Seebeck effect. The generated voltage was measured with the help of Fluke 88 digital multimeters while, the heat at each end of the pellet was measured with a UT33C digital thermometer. TEP values of graphene pellet were determined by using the differential method relative to Cu electrodes [38, 41]. The absolute values of the TEP of Cu in the temperature range of (303–363) K had been taken into account while calculating the TEP of the graphene pellet. During the experiment, a temperature difference of 10 K was maintained between the hot and cold end of the pellet for calculating the TEP. The experimental setup used in our experiment is shown in figure 2. Electrical conductivity was measured using four-point probe method while thermal conductivity was measured using longitudinal steady state technique.
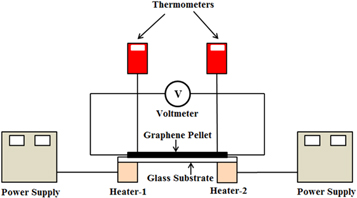
Figure 2. Schematic view of the experimental setup.
Download figure:
Standard image High-resolution image3. Results and discussion
Seebeck effect is defined as the generation of the voltage by a material when a temperature gradient is established across its ends. The ability of the material to generate a voltage when a temperature gradient is established across its ends is characterized by the Seebeck coefficient (thermopower). Mathematically the Seebeck coefficient is formulated as  where α, V, and ΔT are the Seebeck coefficient, the voltage generated by the TE material, and the temperature gradient between the hot and cold end of the TE material respectively.
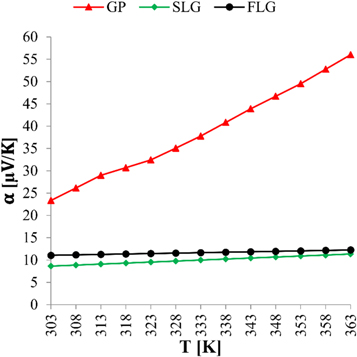
Figure 3 illustrates the relationship between the Seebeck coefficient and average temperature T of the graphene pellet. Besides the TEP of the GP, the TEP of SLG [36] and FLG [38] is also shown for comparison. The TEP of the graphene based TE device is found to be gradually increasing from (23–56) μV K−1 as the temperature increases from (303–363) K. But for SLG and FLG, a slight increase in the TEP with increasing temperature is observed. The TEP of SLG and FLG is (3–5) order of magnitude smaller than that of the GP. Enhancement in the TEP of the graphene pellet is attributed to the entrapped air within the pellet and increase in the number of layers of graphene which causes an increase in the density of defects in the sample [40]. Since graphene pellet also has multiple layers of graphene that's why the density of defects in GP is greater than SLG and FLG ultimately resulting in enhanced TEP for the GP. This is also evident from the TEP of SLG, which is smaller in magnitude than the TEP of the FLG as illustrated by figure 3. Similar to SLG and FLG, the TEP of graphene pellet is positive for the entire temperature range which illustrates that the dominant charge carriers are holes.
Download figure:
Standard image High-resolution imageFor a temperature less than the Fermi temperature (TF), the Seebeck coefficient of the metal is given by equation 1. Where kB, T, and EF are the Boltzmann constant, average temperature between the hot and cold end of the TE material, and Fermi energy respectively. The TEP of the metals is generally less than  [42].
[42].

Equation 1, clearly illustrates that the thermopower of the metals increases linearly with temperature. It is reported in by Berger et al, that the Fermi temperature (TF) of epitaxial graphene is 2490 K [43]. So, the Fermi energy of graphene is calculated as  using the relation of
  Using these values for the constants in equation 1, the TEP for graphene was calculated and this mathematically simulated (SIM) TEP is shown in figure 4. The simulated TEP increases moderately with the increase in the temperature. The experimentally (EXP) observed TEP is also shown for comparison. R G Vaidya et al reported that if the TEP of a material varies linearly with temperature, then it represents that the TEP is dominated by the diffusive component while the phonon drag component contributes a little to the effective TEP [44]. Therefore, we can say that the linear increase in TEP indicates metallic diffusion behavior while the contribution by the phonon drag is negligible due to weak electron-phonon coupling [45, 46] in graphene pellet. The experimentally observed TEP is clearly following the predicted TEP.
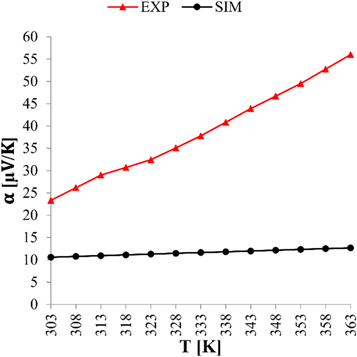
Figure 4. Temperature dependent experimentally (EXP) observed, and simulated (SIM) thermopower of graphene pellet.
Download figure:
Standard image High-resolution imageFigure 5 shows the voltage-temperature gradient characteristics of the graphene pellet. Load voltage was measured across a load resistor connected to the TE device. This load is approximately equal to the internal resistance of the graphene pellet. It can be seen that the magnitude of the open-circuit voltage and load voltage is rising as the temperature gradient is varied from (6–11) K, however, the magnitude of load voltage is smaller than the magnitude of the open-circuit voltage. Maintaining a temperature gradient of 6 K across the GP, generates an open-circuit voltage of 0.15 mV while the same temperature gradient produces a load voltage of 0.1 mV. These values increase steadily to 0.25 mV and 0.15 mV respectively, when the temperature gradient increases to 8 K. Establishing a temperature difference across the GP, results in the diffusion of the charge carriers from the hot end towards the cold end. When the charge carriers diffuse from the hot end towards the cold end, opposite charges are left at the hot end. As a result, a potential difference is generated between the two ends of GP. When the temperature difference across the pellet is increased, the rate of diffusion of the charge carriers increases and hence causes an increase in the voltage generated. The open-circuit voltage and load voltage attain a peak value of 0.4 mV and 0.3 mV respectively at a temperature gradient of 11 K. The linear relationship between the voltage generated by the graphene pellet and the temperature gradient verifies its thermo-electric origin.
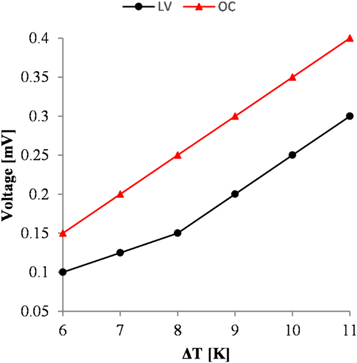
Figure 5. Voltage-Temperature gradient relationship of the graphene pellet. OC represents the open circuit voltage while LV represents the voltage across a load resistor.
Download figure:
Standard image High-resolution imageThe electrical conductivity (σ) of the graphene pellet was measured using four-point probe method. The dependence of electrical conductivity on temperature is shown in figure 6. It is clear from figure 6 that the electrical conductivity of the graphene pellet increases dramatically as the temperature is increased, which is indicative of the semiconducting behavior. At a temperature of 303 K, the pellet exhibits an electrical conductivity of 0.3 s m−1. The electrical conductivity of the graphene pellet reaches its peak value of 4.3 S m−1 when the temperature reaches to 363 K. Xiao et al reported the electrical conductivity of single layer graphene (SLG) films in the range of (4 × 10⁴–6 × 10⁴) S m−1 which is higher than the values for few layer graphene (FLG) films i.e., (4 × 10⁴–5 × 10⁴) S m−1 [40]. The reason for high electrical conductivity of SLG films as compared to FLG films was the low density of structural defects in SLG films. Since the pellet has multiple layers of graphene, therefore higher density of structural defects and entrapped air within the pellet results in the reduction of the electrical conductivity as compare to SLG and FLG films while increasing its thermopower.

Figure 6. Temperature-electrical conductivity relationship of the graphene pellet.
Download figure:
Standard image High-resolution imageThe thermal conductivity (к) of the graphene pellet was measured using longitudinal steady state technique [47]. Figure 7 shows the dependence of the thermal conductivity on temperature. The thermal conductivity of graphene pellet is 0.38 × 10⁻³ W mK−1 at 303 K however, it linearly rises to a peak value of 3.02 × 10⁻³ W mK−1 at a temperature of 363 K. Previously, very high values of thermal conductivity were reported for SLG i.e., (3000 − 5000) W mK−1 [48, 49]. The thermal conductivity of bulk-graphene goes on decreasing with the increase in the number of graphene layers and the thickness of the sample. This decrease is due to cross-plane coupling of the low-energy phonons and corresponding changes in the phonon Umklapp scattering in bulk graphene [50, 51]. The effect of cross-plane coupling of phonons in bulk-graphene is evident from the thermal conductivity of the graphene pellet as it shows very small values. The greater density of pores in the pellet would cause further lowering of the thermal conductivity of graphene pellet. A decrease in the thermal conductivity is one of the important requirements for good TE materials. Graphene pellet has very low thermal conductivity and thus can be considered for TE applications.

Figure 7. Temperature-thermal conductivity relationship of graphene pellet.
Download figure:
Standard image High-resolution imageThe dimensionless FOM of a TE material is formulated as  where α, σ, κ, and T are the Seebeck coefficient, electrical conductivity, thermal conductivity, and average temperature of the graphene pellet. The measured electrical and thermal conductivities of the graphene pellet were used to determine the FOM, which is shown in figure 8. As expected, a linear relationship exists between the FOM of the graphene pellet and the temperature. The FOM of the TE device is 130.3 × 10⁻⁶ at 303 K which further increases by 12 times when the temperature is increased by 60 K. The FOM achieve its maximum value of 0.0016 at 363 K. This value is 10 times higher than the previously reported FOM for graphene [52, 53]. The high value of FOM can be attributed to the large density of pores and entrapped air within the pressed pellet which decreases the thermal conductivity by a great factor and to a large value of the TEP as compares to previously reported values. But this value is not comparable with the best TE materials. In principle, high value of thermopower and very low thermal conductivity could have resulted in high value of ZT for graphene pellet but this is not the case here as the electrical conductivity is very low which makes the power factor (α2 × σ) very small. In order to increase the FOM of the bulk-graphene, a further study is needed to increase the electrical conductivity while still keeping the thermal conductivity to low values.

Figure 8. Dimensionless FOM of graphene pellet as a function of temperature.
Download figure:
Standard image High-resolution image
4. Conclusion
Thermoelectric properties of bulk-graphene based TE device fabricated using manual hydraulic pressing machine, were measured. The TEP of the graphene was found to be linearly varying between (23–56) μV K−1 when the temperature of TE device was increased from (303–363) K. The positive TEP of the graphene pellet shows that the majority charge carriers are holes. The TEP of the pellet is found to be four times larger than the previously reported values for single layer graphene (SLG) and few layer graphene (FLG). Graphene pellet shows metals like thermopower as its thermopower linearly increased with the temperature. Furthermore, it should be noted that the large value of the FOM of the pellet is due to its porous structure, which results in lowering the thermal conductivity ultimately enhancing the FOM by 10 times as compared to the previously reported values.
5. Future perspective
This work has several potential areas worth exploring for improvement. An important one among them is the porosity of the pellet that can control the thermal conductivity and hence improve the FOM of the graphene pellet. The main factors that can control the thermal conductivity of the graphene pellet include the pressure applied, and the time for which the pressure has been applied during the fabrication of the pellet. In addition to this, the physical dimensions of the pellet will also affect the thermal and electrical conductivity.
Due to smaller value of FOM, the concept of using TEGs based on bulk graphene (fabricated in the form of pellet) can be utilized in low and medium power devices. Potential application includes sensors requiring less power and light weight TEGs.
Data availability statement
All data that support the findings of this study are included within the article (and any supplementary files).