
Abstract
Electromagnetic interference produced by high-speed electrical and electronic systems (i.e., base stations, mobile phones, radar, television and radio transmitters) that facilitate daily life also caused a pollution to be dealtwith as a part of daily life. Increasing use of electronic devices arising from the rapid developments in science and technology increased electromagnetic interference in electronic devices well besides the electromagnetic pollution in the environment. Therefore, there is a tremendous need to develop effective protection against the negative effects of electromagnetic interference. The objective of this paper is to make the composite boards from the recycling of Tetra Pak packages and to investigate the effect of aluminum additive on absorption efficiency of electromagnetic interference at various frequencies. Experimental results showed that as the ratio of aluminum additive rate in the composite material increased, the attenuation ratio increased.
Export citation and abstract BibTeX RIS

Original content from this work may be used under the terms of the Creative Commons Attribution 4.0 licence. Any further distribution of this work must maintain attribution to the author(s) and the title of the work, journal citation and DOI.
1. Introduction
The technological developments in industrial brought great convenience to our lives. However, the electrical-electronic fields generated by the high tech devices created electromagnetic fields on living organisms [1, 2]. When electromagnetic wave acts on a living organism, it inhibits cell renewal via DNA and RNA. Moreover, many studies have shown that exposure to electromagnetic waves increased the probability of some diseases such as depression, leukemia, central nervous system tumors and lung cancer [3–5]. Also, the electronic or electrical devices generate serious electromagnetic interference (EMI) that impacts the performance of nearby devices [6–8]. EMI can be defined as any disturbance or signal of natural or human origin at radio frequencies that reduces performance and causes degradation or malfunction of electrical and electronic devices [9].
Recently, much effort has been devoted to investigating the harm caused by electromagnetic waves and protection against the electromagnetic fields [10, 11]. One of the most effective methods used to reduce the harmful effects of electromagnetic fields is shielding [12, 13]. The EMI shielding is reflection and/or absorption of electromagnetic radiation by a material that acts as a barrier against the leakage of electromagnetic radiation [14]. The EMI shielding ability of a material indicates its shielding effectiveness (SE) and mathematically can be expressed in decibels (dB) according to the following equation [15]:

where E is electric field in V/m, H is magnetic field in A/m, and P is power density in W/m2. The subscripts t and i refer to the transmitted and incident waves, respectively. In a complete shielding operation mainly three types of mechanisms are involved: reflection (R), absorption (A) and multiple-reflections (M). SE can also be expressed by the below given equation [16, 17]:

Multi-layer, multi-coated cartons bear the name of the first and the largest manufacturer of such items: Tetra Pak [18]. Tetra Pak is widely used as aseptic packaging for beverages and liquid foods. This aseptic packaging system ensures that products remain intact for long periods of time without refrigeration or preservatives. The aseptic packaging produced by Tetra Pak and used for beverage packaging after ultra-pasteurization consists of three materials arranged in six layers: paper (75% by weight), low density polyethylene (20% by weight) and aluminum (5% by weight) [19]. Taking into consideration the fact that millions of Tetra Pak packages are used daily, the materials that they contain is a great concern due to the serious environmental pollution that they would cause if and when they cannot be recycled and reused. Hence, in this study, we aimed at producing a composite material from the recycling of Tetra Pak packages to absorb the electromagnetic interference. For this end, the effect of aluminum additive at different frequencies on the absorption efficiency of electromagnetic interference is investigated.
The paper proceeds as follows: The next section describes the sample manufacturing process and antenna design. The experimental results are presented in section 3. Finally, the last section concludes the paper.
2. Experimental procedures
2.1. Sample manufacturing
In this study, composite boards were manufactured from the recycled Tetra Pak beverage containers in the following steps. The manufacturing process of the boards is shown in figure 1.

Figure 1. Manufacturing process of the boards.
Download figure:
Standard image High-resolution imageTetra Pak beverage cartons were cut into strips of the size 20 mm × 20 mm with a guillotine shear after pre-cleaning. Tetra Paks in clipped form at a concentration of 10% were kept in pre-heated water bath at 70 °C–80 °C for two hours and following this they were subjected to the pulping process.
The fibers, which were ready for to be mixed homogenously and for to be completely decomposed, were transferred to the fiber roller. This process aimed at weakening the bond between the pulp and the polyethylene-aluminum.
The blended mixture was then transferred into a horizontal cylinder drum mesh. During rotation, the pulp and the polyethylene-aluminum were completely decomposed. Finally, washing was carried out to ensure complete removal of the paper fibers from the aluminum-polyethylene remaining in the drum. Thus, the paper fibers and the aluminum-polyethylene were separately decomposed for to be recycled.
The paper fibers prepared in 2%–3% moisture and aluminum particles of 20% to 30% by weight were placed in between steel plates. In the mixture, the binding matrix material was polyethylene and the heat conductor was aluminum. The manufactured boards of the size 200 mm × 200 mm × 10 mm were then hot pressed at 170 °C under a pressure of 3–3.5 N mm−2 for 10–12 min The properties of manufactured boards are given in table 1.
Table 1. Properties of boards.
| Variables on the boards | Values |
|---|---|
| Board sizes (mm) | 200 × 200 × 10 |
| Adhesive ratio (polyethylene) | % 5 |
| Hot press temperature (°C) | 170 |
| Pressing time (min) | 10–12 |
| Press pressure (N/mm2) | 3–3.5 |
| Thickness (mm) | 10 |
The physical and mechanical properties measured of manufactured boards are given in table 2. The results obtained from measurements were evaluated according to the EN 310 [20], EN 317 [21], EN 318 [22] and EN 323 [23] standards.
Table 2. Physical and mechanical properties of the boards.
| D (g cm−3) | WA (2 h) (%) | WA (24 h) (%) | TS (2 h) (%) | TS (24 h) (%) | MOR (N mm−2) | MOE (N mm−2) |
|---|---|---|---|---|---|---|
| 0,75 | 16 | 28 | 9 | 16 | 8.96 | 1210 |
Here, (D) stands for density, (TS) for thickness swelling, (WA) for water absorption, (MOR) for modulus of rupture and (MOE) for modulus of elasticity.
2.2. Antenna design
Various anechoic boxes were designed via different methods for determining the antenna radiation pattern and measuring the shielding effectiveness [24, 25]. The anechoic box shown in figure 2 is covered with lead material to prevent reflections.
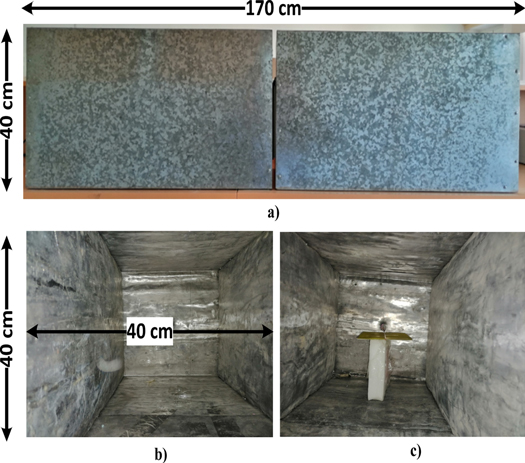
Figure 2. Anechoic boxes (a) two anechoic boxes that measure absorption efficiency (b) inner side the box (c) inner side the box with LPDA antenna.
Download figure:
Standard image High-resolution imageIn order to accurately measure the absorption efficiency of a material, the electromagnetic wave coming to the absorbing material must have a planar feature. For this reason, the distance between the antenna and the absorbing material should be at least as far as the far-field of the antenna. The far-field of an antenna can be calculated as [26]:

where R is the distance required for the antenna to radiate, D is the largest dimension of the antenna and λ is the wavelength of the radio wave. Also, a far-field region distance R must satisfy geometric R ≫ D and optical R ≫ λ conditions.
Figure 3 is shown the microstrip Log-Periodic Dipole Array (LPDA) antenna designed as a receiver and transmitter to measure absorption efficiency.

Figure 3. Microstrip LPDA (a) geometry and (b) fabricated antenna.
Download figure:
Standard image High-resolution imageLPDA length parameter values are shown in table 3. The largest length of LPDA is 19 cm. In this antenna size, the far-field boundary should be around 75 cm considering the formula (3) and geometric/optical conditions. The anechoic box boundaries shown in figure 2 satisfy these conditions.
Table 3. LPDA length parameters.
| Number of Dipole | LN (mm) | WN (mm) | Sn (mm) |
|---|---|---|---|
| 1 | 8.9 | 0.925 | — |
| 2 | 12.6 | 1.15 | 4 |
| 3 | 19.8 | 1.43 | 5 |
| 4 | 23.7 | 2.56 | 6 |
| 5 | 31.4 | 3.2 | 8 |
| 6 | 41.5 | 5 | 10 |
| 7 | 53.6 | 5.75 | 12 |
| 8 | 68.8 | 6.25 | 15 |
For the antenna design, a broad-band and high gain antenna have been preferred, taking into account the frequencies at which the absorption process will be detected. The antenna is built on FR4 substrate material due to its simple design and low cost. FR4 substrate material has dielectric constant  loss tangent
  and material thickness h = 1.52 mm. Return loss (∣S11∣) of the designed microstrip LPDA antenna was simulated and measured in dB by frequency. Figure 4 shows these measurements and simulation results.
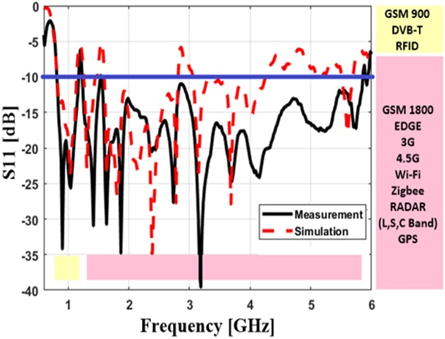
Figure 4. Simulated and measured S11 of Microstrip LPDA antenna.
Download figure:
Standard image High-resolution imageThese results indicate that if the measurement is considered to be a reference, the return loss of the proposed antenna is under −10 dB at all frequencies between 0.8 to 6 GHz except the center frequency 1.19 GHz. Using this antenna, absorption measurements can be made for the operating frequencies used in applications such as GSM 900, GSM 1800, DVB-T, EDGE, 3 G, 4.5 G, Wi-Fi, ZigBee, Radar (L, S band and part of C band) and GPS that are most encountered in the living areas. For this purpose, the absorption efficiency of new materials designed as a mixture of Tetra Pak material with aluminum particles at ratio of 10% (T10), 20% (T20) and 30% (T30) was tested by using LPDA and the anechoic box. The aluminum particles used in this study were obtained from Tetra Pak aseptic packaging cartons after recycling.
3. Results and discussion
The system consisting of two anechoic boxes, receiving and transmitting antennas used for to determine the absorption levels of the aluminum doped in the composite materials, which were obtained at the T10, T20, T30 doping rates, is shown in figure 5(a).

Figure 5. (a) Measurement setup (b) schematic representation of EMI shielding mechanism.
Download figure:
Standard image High-resolution imageA free space with the dimensions of the material with which absorption measurement was going to be made was created by opening a slit on the points where the anechoic boxes touch each other. The ratio of the signals sent from the transmitting antenna and the signals received from the receiving antenna was used to calculate the absorption rate of the materials placed in this free space.
The measurements were made with a Rohde & Schwarz FSH8 spectrum analyzer. The spectrum analyzer generator output port was connected to the transmitting antenna, and the RF input port was connected to the receiving antenna. First of all, the transmitter was calibrated via a spectrum analyzer in the installed system. Then, the materials to be measured were placed in the free space of the anechoic boxes and the transmission ratios (S21) were tested with the system shown in figure 5 (a).
Five materials (copper, aluminum and manufactured boards) were measured via this measurement set-up as was used in other studies for measuring EMI SE in the literature [27, 28]. T10, T20 and T30 materials manufactured for electromagnetic shielding are represented by the mechanism shown in figure 5(b). In this mechanism, depending on the amount of aluminum doped in the manufactured material, most of the electromagnetic waves will be reflected while some of them would be absorbed and a very small amount of them will pass to the opposite side. In the manufacturing process, the aluminum particles were randomly added into the material to ensure that the transmitted signals are at very low levels and the permeability of the material was tested depending on the amount of the additive doped in the material. Unlike conventional shielding methods, in this study the target was to make to provide shielding via a material in which the dopant -aluminum- was not dispersed homogeneously. The random use of aluminum in the material was observed to cause multiple internal reflections. Multiple reflection losses can be neglected since multiple reflections are at very low levels in most of the materials used for shielding as is the case encountered with the materials manufactured in this study, too.
For to test the RF permeability of aluminum, copper and T10, T20, T30 doped materials, comparative measurements were made in the frequency spectrum range from 1.8 GHz to 5 GHz. The parameter S21, which is the logarithmic expression of the ratio of the RF power sent from the transmitting antenna to the RF power received from the receiving antenna, was examined for to understand the RF permeability of these materials. At the same time, the absolute value of this parameter indicates the attenuation ratio.
The ratio of the RF signal sent from the transmitting antenna to the RF signal received from the receiving antenna was measured by placing pure aluminum in the free space between the two anechoic boxes, as shown in figure 6(a). Accordingly, the attenuation ratio of aluminum in this frequency range was calculated as an average of 17.59 dB. On a linear scale, using (1), this ratio would be calculated to be 0.0174. In figure 6(b), the transmission ratios of aluminum and T10 doped composite materials are plotted to enable comparative evaluation. The attenuation ratio of 10% doped composite material was calculated to be 5.4 dB. Linearly, this value can be calculated to be 0.2884. The major reason for the difference in attenuation in the T10 and aluminum doped materials is the amount of dopant incorporated in the material which is very low.
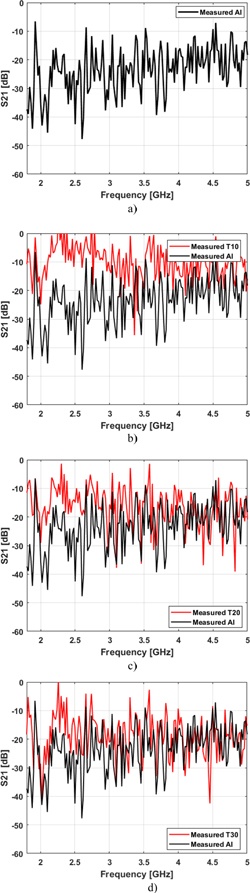
Figure 6. Transmission ratio of (a) aluminum (b) aluminum and T10 (c) aluminum and T20 (d) aluminum and T30.
Download figure:
Standard image High-resolution imageIn figure 6(c), the transmission ratios of aluminum and T20 doped composite material are plotted as compared to each other. When the average transmission ratios are compared, the attenuation ratio of T20 was calculated to be 11.86 dB. This value is linearly equal to 0.0652. As shown in figure 6(d), the transmission ratios of aluminum and T20 doped composite material are plotted as compared to each other. When the average transmission ratios were compared, the attenuation ratio of T30 was calculated to be 12.95 dB. This value is linearly equal to 0.0507.
In figure 7(a), the ratio (the RF signal sent from the transmitting antenna/the RF signal received from the receiving antenna) which was measured by placing pure copper in the free space between the two anechoic boxes. The attenuation ratio of copper in this frequency range was calculated as an average of 18.09 dB. This value indicates that the attenuation ratio of copper is higher than that of aluminum. This value is linearly equal to 0.0155. The comparative transmission measurement results of copper and T10, copper and T20, copper and T30 are given in figures 7(b)–(d), respectively. The shielding effectiveness of aluminum and T10, aluminum and T20, aluminum and T30 are given in figures 8(a)–(c), respectively.

Figure 7. Transmission ratio of (a) copper (b) copper and T10 (c) copper and T20 (d) copper and T30.
Download figure:
Standard image High-resolution image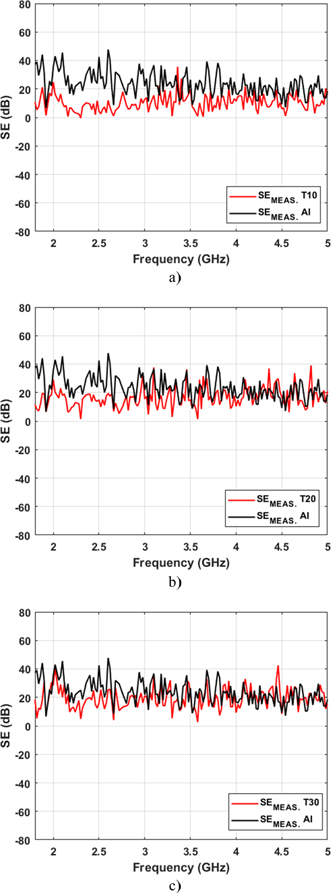
Figure 8. Shielding effectiveness of (a) T10 (b) T20 (c) T30.
Download figure:
Standard image High-resolution image
S (scattering)-parameters can be used as another method to determine the EMI SE. As shown in figure 5(b), in the shielding theory, the reflected wave (Rw), the transmitted wave (Tw) and the absorbed wave (Aw) can be represented by the following parameters [29]:


SE can be calculated using the parameter shown by Tw as follows [29]:

The attenuation ratios and transmission ratios of the measured materials are given in table 4.
Table 4. Attenuation and transmission ratios.
| Measurement | Cu | Al | T10 | T20 | T30 |
|---|---|---|---|---|---|
Attenuation Ratios (dB) 
| 18.09 | 17.59 | 5.4 | 11.86 | 12.95 |
| Transmission Ratios (%) | 1.55 | 1.74 | 28.84 | 6.52 | 5.07 |
4. Conclusion
In this study, the effect of the amount of dopant -aluminum- in the composite materials obtained from recycled from waste Tetra Pak packages on electromagnetic absorption efficiency was investigated. The highest attenuation ratio was obtained with 30% aluminum doped T30 material and the highest transmission ratio was obtained with 10% aluminum doped T10 material while the lowest transmission ratios were determined to be −35.61 at 3.36 GHz for T10 material, −39.08 at 4.81 GHz for T20 material and −42.48 at 4.46 GHz for T30 material. The results indicate that as the ratio of the aluminum in the composite material manufactured increased, the attenuation ratio increased. However, there is no linear relationship between additive rates and attenuation ratios.
Acknowledgments
This work was partially supported by the Scientific and Technological Research Council of Turkey (TUBITAK) under project number 118O760.