
Abstract
In this work, the effect of hydrothermal and chemical treatment on the optical and electrical properties of reduced graphene oxide (RGO) was investigated. Reduced graphene oxide was synthesized by both hydrothermal route using a locally fabricated Teflon lined autoclave and chemical method using hydrazine monohydrate. The thin film was obtained by depositing RGO on Indium Tin Oxide (ITO) glass via spray pyrolysis technique. In RGO hydrothermal, the Raman spectroscopy analysis showed greater restoration of the conjugated networks in graphene sheet. The optical transmittance of RGO hydrothermal and RGO hydrazine decreased after the reduction methods unlike in highly oxidized graphene oxide (HOGO) where eighty percent transmittance was observed at 600 nm and above. For RGO hydrothermal and RGO hydrazine; the optical analysis gave an energy band gap value of 2.1 eV and 2.4 eV respectively, while the resistivity were calculated to be 0.3 Ω m and 0.09 Ω m respectively. This research showed a correlation between the band gap value of RGO and the electrical conductivity. This finding can improve the functionality of RGO as sensing materials. The improved electrical and optical properties of RGO hydrothermal makes it suitable in fiber-optic and opto-electronic applications.
Export citation and abstract BibTeX RIS

Original content from this work may be used under the terms of the Creative Commons Attribution 4.0 licence. Any further distribution of this work must maintain attribution to the author(s) and the title of the work, journal citation and DOI.
1. Introduction
Graphene, a one-atom thick planar layer of sp2 hybridized carbon atoms with a hexagonal structure has distinctive and significant mechanical, thermal, optical and electrical properties [1]. The two-dimensional structure of graphene results in its zero band gap and enables it to act as a semimetal [2–4] thus improving its applications in energy utilization [5–7]. In addition, graphene and graphene derivatives have been used as composites material either with polymers [8, 9] for photochemical actuators [10], photothermal nanopositioners [11] or with metals or metal oxides [12] for other varying applications.
Graphene oxides are graphene derivatives in which ample fraction of the sp2 hybridized carbon are transformed to sp3 hybridization [13]. The most prevalent technique engaged in the synthesis of graphene oxide is chemical oxidation of graphite which utilizes highly oxidizing chemicals to oxidize graphite and consequent reduction with various reductants [14]. The oxidation process introduces oxygen functional groups into the graphene structure which needs to be reduced so as to improve the optical and electronic characteristics of graphene. The predominant reduction method applied in reducing graphene oxide involves chemical treatment via hydrazine monohydrate [15]. Other techniques such as reduction by plant extracts have also been reported [16]. The reduction of graphene oxide is required to restore the conjugated network and recover electrical conductivity [17] which were destroyed by the oxidative treatment. Chemical reduction method has some drawbacks such as the inability to easily control the degree of graphene oxide reduction [18]. In addition to chemical reducing agents such as hydrazine being corrosive, toxic and unstable [17, 19], it renders reduced GO insoluble [20], difficult to spread on substrates [21] and introduces defects. Previous works have shown that the hydrothermal reduction of graphene oxide offers a scalable, simple and controllable synthesis method [22, 23]. In addition, reduced graphene oxide (RGO) synthesized via hydrothermal method typify structural stability and properties that enhance its application as electrodes [24]. Several researches have investigated the reduction of graphene oxide via; hydrothermal method, use of hydrazine or Vitamin C in order to determine either the band gap of the RGO or estimate the conductivity. For example, Velasco-Soto et al [25] developed a synthesis method for controlling the band gap of graphene oxide using various reductants and obtained values that ranged between 1.15 eV and 2.5 eV. Ferna´ndez-Merino et al [26] prepared different deoxygenated graphene oxide and determined the electrical conductivities of the free paper standing films. Also, the reduction of GO via L-Ascorbic acid has been reported to give conductivity value of 800 S m−1 [27]. To the best of our knowledge, no research has investigated the effect of hydrothermal and hydrazine treatment of HOGO on the optical and electrical properties of reduced graphene oxide deposited on ITO glass (via spray pyrolysis technique). This research will provide information on how to tune the optical and electrical properties of graphene based thin film. Chemical spray pyrolysis is an efficient and low cost method of developing resilient thin film. The ability to control the optical and electrical conductivity of RGO will offer advances on its utilization in opto electronics and solarcells. The recovery of the conjugated network and conductivity in highly oxidized graphene oxide (HOGO) can be more difficult owing to increased oxygen content in HOGO, and defects introduced into the HOGO during oxidation. The degree of restoration of the conjugated network in graphene oxide may determine the energy band gap as well as the optical and electrical properties. We therefore investigate the effect of graphene oxide reduction on the optical properties and the relationship between the optical properties of RGO and the electrical conductivity of RGO. Highly oxidized graphene oxide was obtained as stated in our previous publication [28].
In a hydrothermal process, highly heated supercritical water function as the reducing agent and offers a green chemistry alternative to organic solvents [29]. In this work, highly oxidized graphene oxide is subjected to hydrothermal route by thermal treatment using a teflon lined stainless steel autoclave and the chemical route by using hydrazine monohydrate. The thin film of the reduced graphene oxide is obtained by depositing on Indium Tin Oxide (ITO) glass using spray pyrolysis technique. The compositional, optical, morphological, structural and electrical properties of the prepared RGOs were obtained using Fourier Transform Infrared Spectroscopy (FTIR), Field Emission Scanning Electron Microscopy (FE-SEM), Energy Dispersive X-ray Spectroscopy (EDX), Raman Spectroscopy, UV-Visible Spectroscopy and Four Point Probe.
2. Experimental method
2.1. Synthesis of reduced graphene oxide
In order to tune the optical and electrical properties of graphene oxide, graphite was highly oxidized to yield highly oxidized graphene oxide [28], the resulting HOGO was reduced by hydrothermal [30] and hydrazine method seperately and then spray deposited. The effect of different reduction approach is utilized in tuning the optical and electrical properties of the films The optical and electrical properties of the film for each RGO sample is determined and compared with literature. For the hydrothermal treatment, HOGO solution, (3 mg ml−1) was placed in a 60 ml teflon lined autoclaved. The autoclave was placed in a beaker containing silicon oil to allow for good thermal contact
and maintained at 180 °C for 24 h under constant stirring using an electric hotplate (figure 1). Thereafter, it was allowed to cool to room temperature and the synthesized RGO was filtered using a filter paper and air dried. This is referred to as RGOW. A second RGO sample was obtained via the chemical method by reducing HOGO using hydrazine monohydrate. HOGO, (300 mg) was dispersed in 100 ml of distilled water and stirred continuously at ambient temperature for 30 min. Then, 0.2 ml of Hydrazine Monohydrate was added to the mixture of HOGO and distilled water and placed in oil bath maintained at 80 °C for one hour. The obtained RGO was washed with deionized water and filtered with a filter paper to remove residual N2H4. This is referred to as RGOH.

Figure 1. A locally fabricated teflon lined autoclave undergoing hydrothermal synthesis.
Download figure:
Standard image High-resolution imageThe thin film of RGO was obtained by deposition using spray pyrolysis technique (SPT) arrangement as shown in figure 2. ITO glass was utilized as the substrate while the carrier gas used was compressed air. The ITO glass did not require any additional cleaning apart from wiping the surface with a clean and new handkerchief in order to retain the conductivity on the glass. RGO powder, (0.25 g) was dispersed in 15 ml Ethylene Glycol and deposited on the substrate at a temperature of 300 °C. The distance between the nozzle and substrate was maintained at 30 cm for uniform deposition. A dark colour on the substrate after deposition showed that the precursor was successfully deposited. The film thickness of the RGO samples were estimated to be 100 nm.
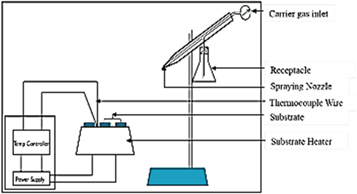
Figure 2. Sketch of a chemical spray pyrolysis set up.
Download figure:
Standard image High-resolution image2.2. Characterization of reduced graphene oxide
Infrared spectrum of RGO was obtained using Fourier Transform Infrared Spectrophotometer (SHIMADZU IRTracer-100). The surface morphology characterization was carried out using Zeiss Ultra Plus 55 Field Emission Scanning Electron Microscope (FE-SEM) while the elemental composition was carried out with the Energy Dispersive Xray (EDX) setup. Optical absorbance of the RGO measured using Jenway UV-Visible Spectrophotometer (Model 6405). The Raman Spectroscopy analysis was carried out using micro-Raman Spectrometer (Jobin-Yvon Horiba T64000) equipped with a triple monochromator system to eliminate contributions from Rayleigh scattering while the electrical property of the film was carried out using a four point probe set up.
3. Results and discussion
3.1. FTIR Spectroscopy analysis of RGO
Figures 3(a)–(d) shows the FTIR spectra obtained for highly oxidized graphene oxide (HOGO), reduced graphene oxide obtained by; chemical method using hydrazine (RGOH), hydrothermal method (RGOW) and solvothermal method (RGOS). In figure 3(a), the HOGO spectrum show bands at 3423 cm−1 for O–H stretching, at 3064 cm−1 and 3236 cm−1 the bands are due to sp2 C–H stretching frequency, at 2881 and 2804 cm−1 the bands typify sp3 C–H. Between 1040 cm−1 and 1170 cm−1 are peaks that are attributed to the alkoxy C–O stretching vibration. All these bands are typical of GO and are similar to what we obtained in our earlier work [28].
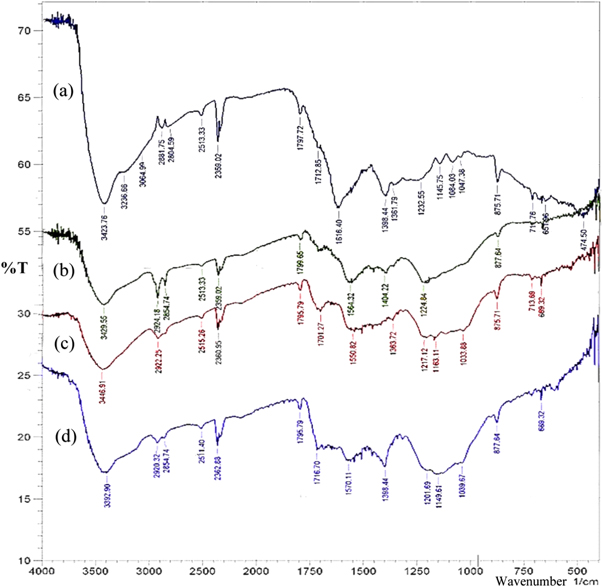
Figure 3. FTIR Spectrum of (a) HOGO, (b) RGO Hydrazine, (c) RGO Solvothermal and. (d) RGO Hydrothermal method.
Download figure:
Standard image High-resolution imageIn figure 3(b), RGO hydrazine (RGOH) has bands for O–H at 3429 cm−1; presence of sp3 C–H band at 2854 cm−1 and 2924 cm−1; C–C stretching at 1564 cm−1 and epoxides group at 1224 cm−1. C–O stretching vibrations strongly decrease to sharp vibration after reduction of HOGO to RGO. Also, the peak at 860 cm−1 present in graphite flakes but absent in HOGO has been restored and this is attributed to aromatic C–H bands. The broad peak between 900–1200 cm−1 present in HOGO has disappeared and resulted in a stretching vibration in RGOH.
The spectrum for RGO obtained by the hydrothermal method (RGOW) is shown in figure 3(c). In this spectrum, bands at 3392 cm−1 is due to O–H stretching frequency, sp3 C–H stretching frequency occurs at 2854 cm−1 and 2920 cm−1. At 1398 cm−1, there is a bending vibration frequency and the intensity of the C–O band in HOGO has been reduced to a lower intensity at 1039 cm−1 in RGOW.
The spectrum for RGOS obtained by the solvothermal method using ethylene glycol as solvent is shown in figure 3(d). The intensity of C=O bond increases in the spectrum, however, there are noticeable decrease in the peaks of other functionalities within the region 900 cm−1–1400 cm−1. However, because the hydrothermal and solvothermal reduction involved extensive heat treatment, the intensity of C=C peak at 1616 cm−1 in HOGO showed a decline in RGOW and RGOs unlike in RGOH. The presence of water in the reduction process via the hydrothermal method strengthens the C–OH peak occurring at 1398 cm−1 unlike in RGOH and RGOs where there seems to be a near disappearance of the C–OH peak. The C=C band typical at 1570 cm−1 was observed to occur in RGOW and between 1550–1565 cm−1 in RGOs and RGOH.
3.2. Field emission scanning electron microscopy analysis of RGO
The microstructure and surface analysis of RGOH (hydrazine) and RGOW (hydrothermal) were carried out using FE-SEM and are shown in figure 4. RGOW was utilized for FE-SEM and other analysis since our FTIR result has shown that hydrothermal reduction favoured the reduction process compared to solvothermal process. The micrograph of RGO using hydrazine as shown in figures 4(a) and (b) shows that the sheets converged and cleaved to form networks which gave rise to sharp and interlinked three dimensional graphene sheets forming a porus arrangement [30]. The RGO sheets in figures 4(a) and (b) appear like folded structure [31]. Furthermore, RGO hydrazine exhibits typical wrinkled structure that causes sheet folding.
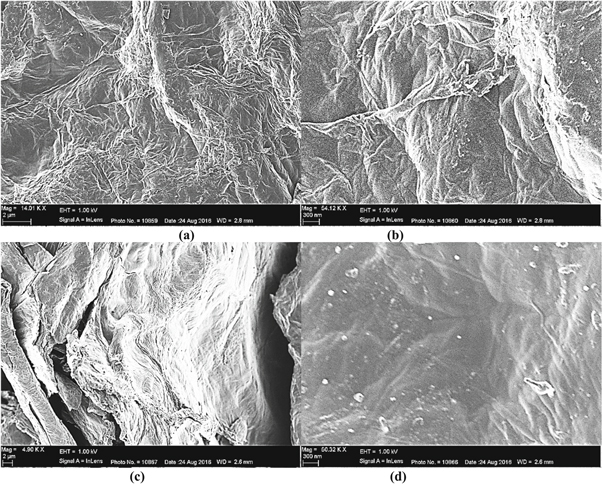
Figure 4. FE-SEM Micrograph at various magnifications of (a) and (b) RGO Hydrazine (c) and (d) RGO Hydrothermal.
Download figure:
Standard image High-resolution imageThe FE-SEM microstructure of RGO obtained via hydrothermal method as shown in figures 4(c) and (d) shows a layered structure with crumples and sheet which overlay rather than aggregating [32]. Also, RGO hydrothermal typify prominent overlapping and increase in the number of sheets compared to RGO hydrazine. This may be attributed to the material transformation that took place in the autoclave at high temperature and pressure during synthesis.
The microstructure of RGO hydrothermal gave a spongy outlook at lower magnifications as shown in figure 4(c). However, at higher magnifications figures 4(b) and (d), the FE-SEM micrograph of both RGO samples amplified the wrinkles and folding that were not so obvious at lower magnifications.
3.3. Energy dispersive x-ray spectroscopy analysis of RGO
The EDX spectrum of HOGO, RGO (Hydrazine) and RGO (hydrothermal) are shown in figures 5(a)–(c). The defined spectrum showed peaks corresponding to carbon and oxygen. In the case of HOGO, the percentage of carbon was 22.0% while oxygen was 78.0%. In RGO (Hydrazine), carbon increased to 29.8% while oxygen decreased to 70.2% while in RGO (hydrothermal), carbon accounted for 37.3% and oxygen 62.7%. The extended period of oxidation brought about by our synthesis method of HOGO introduced more oxygen functionalities to the HOGO thus indicating a high degree of oxidation [28]. This accounts for higher percentage of oxygen in HOGO and our RGOs when compared to literature [13, 33]. The presence of carbon and oxygen is typified in the spectrum, however, RGO from both hydrazine and hydrothermal method showed an increase in the amount of carbon and a decrease in oxygen content thus indicating that both chemical and hydrothermal methods have successfully reduced HOGO.
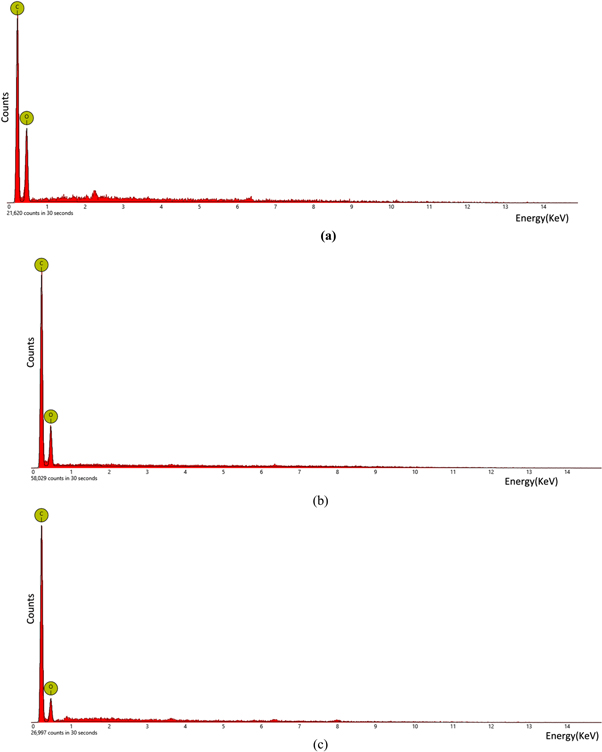
Figure 5. EDX Spectrum of (a) HOGO (b) RGO Hydrazine (c) RGO Hydrothermal.
Download figure:
Standard image High-resolution image3.4. Raman spectroscopy analysis
Figure 6 shows the Raman spectra of HOGO, RGO hydrazine and RGO hydrothermal. The Raman spectra of the samples were compared with the signatory broad D and G peaks centered at a wavenumber of 1354 and 1598 cm−1 respectively. The characteristics peak of 1354 cm−1 for D-band and 1598 cm−1 for G-band were observed for HOGO. In RGO hydrothermal, these peaks red shifted to 1351 cm−1 and 1595 cm−1 for D-band and G-band rspectively. A decrease in the D and G band to 1346 cm−1 and 1592 cm−1 respectively was also obtained for RGO hydrazine. The decrease in the wavenumber of the D peak towards a lower wavenumber is consistent with previous studies [34, 35]; indicating a successful reduction of graphene oxide and a restoration of the sp2 network .
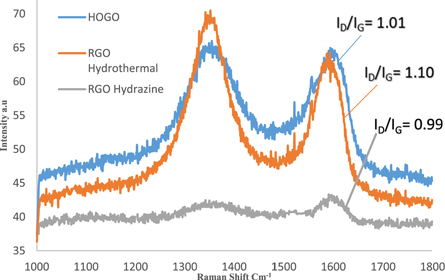
Figure 6. Raman spectra of HOGO, RGO Hydrazine and RGO Hydrothermal.
Download figure:
Standard image High-resolution imageThe structural properties of RGO can be observed and interpreted from the relative intensity of the D and G peak of the Raman Spectra [36]. In the RGO hydrothermal sample, a very disordered graphitic structure is observed by a pronounced D-peak. A conspicuous D band in RGO hydrothermal indicate disorder in the Raman of the RGO springing up from defects associated with vacancies, grain boundaries and amorphous carbon species [17]. This is complemented by an increase in the ID/IG ratio (from 1.01 to 1.10) of RGO hydrothermal thus accounting for a decrease in the sp2 domain size which also indicates an increase in the surface defects [18]. This suggests that new or more graphitic domains are formed with increased restoration of the sp2 cluster number thus indicating good reduction efficiency of the hydrothermal method, [36] and excellent recovery of the conjugated networks in graphene. The prominent D and G peak as well as the increase in relative intensity in RGO hydrothermal typify small crystal sizes were obtained.
The hydrazine treatment of HOGO offers inconsequential changes in the ID/IG ratio of RGO. The ID/IG ratio of highly oxidized graphene oxide was reduced from 1.01 to 0.99 for RGO Hydrazine.
3.5. Optical characterization of RGO
Figure 7 gave the spectrum of absorbance against wavelength for HOGO, RGOW, and RGOH. In HOGO, a major peak typical of GO is observed at 230 nm which is due to π–π* transition of C=C in amorphous carbon arrangement [37, 38] A shoulder peak is slightly observed at ∼290 nm for HOGO which suggests that there exists a bond excitation value corresponding to n -π* transition of the C=O chromophores for aldehyde and ketone molecule [28, 39]. The red shift in the peak position of our RGO to 240 nm is due to reduction of HOGO and the partial restoration of sp2 network after removing certain functionalities [31, 38, 40]. The high degree of oxidation in our graphite brought about by our synthesis method has impacted on the degree of reduction of graphene oxide; hence, the lower degree of red shift in wavelength of our RGO compared to literature [34, 41].

Figure 7. UV visible spectrum of HOGO, RGO Hydrazine and RGO Hydrothermal method.
Download figure:
Standard image High-resolution imageIn figure 8, the transmittance of HOGO, RGO hydrazine and RGO hydrothermal are shown. RGO hydrothermal absorbs light better than RGO hydrazine and HOGO in the visible region of the EM radiation. However, HOGO typified better transmittance with a transmittance of eighty percent at 600 nm and above. This is because there are few bonds to absorb the incident light in the sample at that wavelength. However, at wavelength below 600 nm, RGO hydrothermal and RGO hydrazine proved to allow more light to pass through them than HOGO.
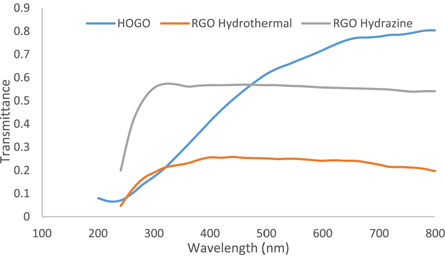
Figure 8. Transmittance of HOGO, RGO Hydrazine and RGO (Hydrothermal Method).
Download figure:
Standard image High-resolution imageThe absorption coefficient is related to the photon energy by the Tauc relation [42]. This equation as shown in equation (1) has been used to evaluate the energy band gap of our RGO film.

Where β is a constant, h is Planck's constant, v is frequency,  is the energy band gap and n is the power factor of the transition mode. For direct allowed band gap,
  and a graph of absorption square against photon energy is plotted.
For our thin film samples, the absorption coefficient is given by

where d is the thickness of the film, T is the transmittance which is equal to 10− A and A is the absorbance.
Figure 9 shows the plot of absorption square (α2) against the energy of the photon for HOGO, RGOH, and RGOW. A band gap of 3.0 eV, 2.4 eV and 2.1 eV respectively were obtained by extrapolating the linear part of the graph. The reduction in bandgap of RGO compared to HOGO may lead to an increase in conductivity and improved optical properties. Since RGOW has a lower band gap compared to RGOH, RGOW might be more conductive than RGOH.

Figure 9. Square of absorption coefficient against energy for HOGO, RGO Hydrazine and RGO Hydrothermal method.
Download figure:
Standard image High-resolution image
3.6. Electrical characterization of RGO
The electrical characterization of RGO film was carried out using a four point probe. The sheet resistance was calculated using equation (3)

Where K is a constant which is equal to

The sheet resistance of RGOH and RGOW thin film were determined to be  Ω sq−1 and
  Ω sq−1 respectively. The resistivity of RGOH and RGOW thin films were calculated using the sheet resistance and the thickness of the films. The thickness of the thin films using the color code chart [43] was estimated to be 100 nm while the resistivity of the film was calculated using equation (5)

where  is the resistivity of the film, and t is the thickness of the thin film. The resistivity of RGOH and RGOW was calculated to be 0.3 Ω m and 0.09 Ω m respectively. The conductivity of RGOH and RGOW was also calculated to be 3.3 S m−1 and 11.1 S m−1 respectively. The increase in the conductivity of RGOW compared to RGOH is as a result of better restoration of the sp2 carbon chain which were recovered during the reduction of HOGO. This creates more conductive pathways for carrier transport in the carbon plane of the RGO sheet [29]. However, the disparity in value of electrical conductivity obtained in our work compared to literature [26, 27] can be attributed to factors such as high degree of oxidation in our graphene oxide, type of reductant used and the difference in substrate used for deposition. This also confirm that the recovery of conductivity in highly oxidized graphene oxide is difficult owing to increased oxygen content. Our results have shown that the optical and electrical properties of RGO deposited on ITO glass will yield better result when the degree of oxidation of graphene oxide is moderate. This observation is consistent with literature where it was proven using density functional calculations that incomplete oxidation of GO is thermodynamically favorable compared to complete oxidation [12, 44].
4. Conclusions
The hydrothermal and chemical treatment of HOGO was successfully used to probe the electrical and optical properties of RGO. This research proved that a lower energy band gap led to improved conductivity in graphene based materials and vice versa. This is an important discovery that can lead to the improvement of RGO as sensing materials. Analyses of the samples showed restoration of Sp2 domain to varying degree with the hydrothermal method typifying formation of more Sp2 domains. The optical transmittance of RGO hydrothermal and RGO hydrazine decreased after the reduction methods unlike in HOGO where eighty percent transmittance was observed at 600 nm and above. The optical analysis of RGO hydrothermal and RGO hydrazine gave an energy band gap value of 2.1 eV and 2.4 eV respectively with better absorbance in RGO hydrothermal in the visible region of the EM radiation. We also correlate an increase in absorbance of RGO with an increase in conductivity. With a lower band gap, enhanced electrical conductivity and absorption edges within the visible range, RGO hydrothermal showed improved suitability in fiber-optic and opto-electronic applications.
Conflict of interest
On behalf of all authors, the corresponding author states that there is no conflict of interest.