
Abstract
This work reports the electrochemical properties of activated carbon prepared from cassava starch activated using KOH. The effect of the impregnation ratios by weight on the surface area and pore structure of the prepared carbon was characterized by N2 adsorption-desorption techniques. By increasing the impregnation ratio by weight from 1:1 to 1:5, the specific surface area increased from 1049 to 1350 m2 g−1 and mean pore diameter also increased from 1.89 to 2.15 nm, respectively. The decrease of mean pore diameter enhanced the specific capacitance value. The carbon electrode with the impregnation ratio of 1:1 reached the maximum specific capacitance of 175 ± 12 F g−1 at the current density of 2 A g−1 due to the smaller mean pore size. Moreover, the specific capacitance retained about 98% after 1000 cycles. The excellent electrochemical performance of activated carbon prepared from cassava starch could be considered as an electroactive material for supercapacitors.
Export citation and abstract BibTeX RIS

Original content from this work may be used under the terms of the Creative Commons Attribution 4.0 licence. Any further distribution of this work must maintain attribution to the author(s) and the title of the work, journal citation and DOI.
1. Introduction
For the past few decades, electrochemical capacitors or supercapacitors have gained much attention as one of the energy storage devices because of their high power density, long cycle life, and long-term stability [1–3]. Generally, charge storage mechanism of supercapacitors can be classified into the following three types of an electric double-layer capacitor (EDLC), pseudocapacitor, and hybrid capacitor [4, 5]. While it is known that the performance of supercapacitors relies on their electroactive materials. Therefore, most of the researchers are focusing on the improvement of electroactive materials. In general, well electroactive materials should provide high specific surface area, low resistivity, and well microstructure in order to allow the accessibility of electrolyte ions [6]. Therefore, several materials can be applied such as conducting polymers [7], carbon-based materials [8], and transition metal oxides [9]. Among those materials, carbon-based material such as graphite [10], activated carbon [11, 12], carbon nanotube [13], carbon nanofiber [14], and carbon aerogel [15, 16] have gained a lot of consideration due to their non-toxicity, high surface area, high electrical conductivity, good corrosion resistance, high-temperature stability, and low-cost [7].
Activated carbon with high surface area can be prepared from biomass and agricultural or natural materials such as rice husk [17], rubberwood sawdust [12], ash raw bagasse [18], corn stalk [19], pomelo [20], and waste-leaves [21]. There are two processes involving the preparation of activated carbon which are physical and chemical activations [22]. In physical activation process, the production of activated carbon requires a high activation temperature and long activation time which leads to a reduced yield of activated carbon [23, 24]. In contrast, chemical activation process involves a low temperature which has been commonly done at 450 to 800 °C [25]. Compared with physical method, chemical method uses lower temperature for pyrolysis [26] which in turn higher specific surface area and higher yield [27]. In order to promote the carbonization in chemical activation, various activating agents such as H2SO4 [28], H3PO4 [29], NaOH [30], KOH [31], and ZnCl2 [32] are widely used. Among them, KOH activation produced higher specific surface area in comparison with NaOH [33] which provides more surface active sites for electrolyte ions accessibility. The shift of those two peaks is possibly due to the rearrangement of carbon atom to the actual position in the activated carbon.
In many countries, cassava is considered as one of the most important economic crops. The main component in cassava root is starch which is composed primarily of two glucose polymers [34]. A large amount of glucose content (≥90%) in cassava starch is appropriate material for production of activated carbon [35]. For this reason, cassava root in this work was selected as raw material for the preparation of activated carbon by using KOH as activating agent. The impregnation ratios by weight of cassava starch: KOH were varied from 1:1 to 1:5 and carbonized at temperature of 800 °C under argon atmosphere for 2 h. The obtained activated carbon was further characterized by x-ray diffraction (XRD), scanning electron microscopy (SEM), and x-ray photoelectron spectroscopy (XPS). The effect of the impregnation ratios by weight on the surface area and pore structure of the prepared activated carbon was investigated by N2 gas adsorption-desorption techniques. The electrochemical performance of activated carbon electrodes was explored by using cyclic voltammetry (CV), galvanostatic charge/discharge (GCD), and electrochemical impedance spectroscopy (EIS) techniques via three-electrode electrochemical cell.
2. Experimental method
2.1. Activated carbon preparation
In this work, cassava starch (CS) obtained from cassava root was acquired from northeastern of Thailand. Firstly, the shell of cassava root was peeled off and the peeling root was cut into small pieces. The obtained sheet of cassava starch was natural dried for at least 48 h and it was then crushed until the homogeneous powder was obtained. Next, the resulting homogeneous powder was mixed with potassium hydroxide (KOH) at different concentration ratios by weight of 1:1, 1:3, and 1:5 in 200 ml of deionized water. After that the mixture was dried in an oven at 100 °C for 12 h and subsequently carbonized in a stainless tubular furnace at 800 °C for 2 h. Finally, the obtained activated carbon was washed by hydrochloric acid (HCl) solution until pH ∼7 and it was left to be dry overnight. The schematic preparation of activated carbon is shown in figure 1. The non-activated carbon and activated carbon samples with different KOH concentration ratios of 1:1, 1:3, and 1:5 were denoted as ACCS-0, ACCS-1, ACCS-3 and ACCS-5, respectively.
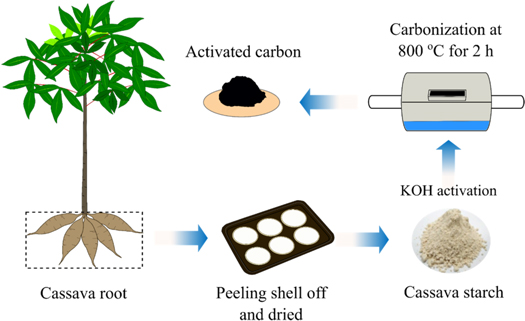
Figure 1. Schematic preparation of activated carbon derived from cassava starch.
Download figure:
Standard image High-resolution image2.2. Characterizations of activated carbon
The crystal structure of the prepared activated carbons was evaluated by x-ray diffraction (XRD: D2 Advance, Bruker). The chemical compositions were investigated by x-ray photoelectron spectroscopy (PHI5000 VersaProbe II, ULVAC-PHI: monochromatic Al Kα excitation source (1486.6 eV)). The surface morphologies were studied by using scanning electron microscopy (SEM: JEOL JSM-6010LV). To determine the porosity of the materials, the nitrogen adsorption-desorption isotherms were obtained by using the BELSORP Mini II instrument. The samples were first degassed at 300 °C for 12 h and the nitrogen isotherms were then collected at 77 K. The specific surface area and pore size distribution were analyzed by using Brunauer–Emmett–Teller (BET) and Barrett–Joyner–Halenda (BJH) methods, respectively.
2.3 Fabrication of activated carbon electrode and its electrochemical performance
The electrochemical performance of the activated carbon electrode with the different impregnation ratios was studied by using a three-electrode cell consisting of counting electrode (CE), reference electrode (RE), and working electrode (WE). To prepare the working electrode, active material of the activated carbon (8 mg), acetylene black (1 mg), polyvinylidene fluoride (1 mg), and 1-methyl-2-pyrrolidinone (200 ml) were mixed and coated on Ni foam substrate. The prepared working electrodes was dried in an oven at 70 °C for 24 h and were then pressed at 20 MPa. The electrochemical performance was evaluated in 6M KOH electrolyte. Cyclic voltammetry (CV) curves of the working electrodes were measured at the scan rates ranging from 2 to 30 mV s−1 with a potential window between −1.2 V to 0 V. Galvanostatic charge-discharge (GCD) measurements were performed at different current densities of 2–20 A g−1. Electrochemical impedance spectroscopy (EIS) was recorded in the frequency range of 0.1–100 kHZ. The specific capacitance, energy density, and power density were calculated using the following equations [36].


Where C is specific capacitance (F g−1), E is energy density (Wh kg−1), P is power density (kW kg−1), I is discharging current (A), t is discharging time (s),  is potential window (V) and m is mass of active materials (g).
3. Results and discussion
3.1 Physical properties
Figure 2 shows the XRD patterns of non-activated (ACCS-0) and activated carbon (ACCS-1, ACCS-3, and ACCS-5) prepared from cassava starch. As seen in figure 2, the XRD patterns of all samples show a broad peaks which indicate the amorphous structure of the samples [37]. For non-activated carbon, the XRD pattern shows two broad peaks at 2θ of 23o and 43o which correspond to the (002) and (100) planes of graphitic carbon [22]. After KOH activation, three peaks are detected in which the diffraction peaks at 2θ of 23° and 43° are shifted to lower diffraction angle and peak at ∼30.7° corresponds to residual K2CO3 (JCPDS card no. 71–1466) [23]. The shift of those two peaks is possibly due to the rearrangement of carbon atom to the actual position in the activated carbon [38]. This shift may indicate the widening of the pores because their graphitic microcrystallites were destroyed after KOH activation [23]. Moreover, the weaker diffraction peaks of the activated carbon samples after KOH activation are revealed, implying the increased in disorder degree and porosity [24]. At diffraction peaks of 30.7°, the possible formation of K2CO3 can be explained by the chemical reaction between KOH and carbon during activation process following the reaction below [15].


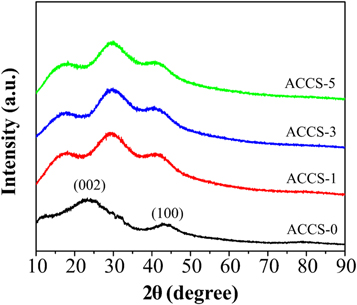
Figure 2. XRD patterns of non-activated (ACCS-0) and activated carbon (ACCS-1, ACCS-3 and ACCS-5) derived from cassava starch.
Download figure:
Standard image High-resolution imageThe resulting K2CO3 in equation (4) was further decomposed into CO2 and K2O as shown in equation (5) when the temperature was achieved at 700 °C [25]. Therefore, the observation of the additional peak in all activated carbon samples maybe due to the incomplete decomposition of K2CO3 during the process of KOH activation and after washing with HCl.
The chemical compositions of the activated carbon samples were investigated by XPS. The high-resolution XPS spectra of C1s peaks of the non-activated carbon (ACCS-0) and activated carbon (ACCS-1, ACCS-3, and ACCs-5) are presented in figure 3. The C1s spectra can be deconvoluted into three sub-peaks at approximately 284.8 eV, 286.2 eV and 288.3 eV which are attributed to C–C/C=C bond, C–O bond and O–C=O bond, respectively [39]. The relative atomic concentration estimated from XPS of all samples is shown in table 1. The C/O and carbon functional groups concentration of all samples are slightly different. This result shows that the KOH activation has no significant effect on the chemical composition of the samples.

Figure 3. High resolution XPS spectra of C 1 s peak of non-activated carbon (a) ACCS-0 and activated carbon (b) ACCS-1, (c) ACCS-3 and (d) ACCS-5.
Download figure:
Standard image High-resolution imageTable 1. Relative atomic elemental contents of C and O from XPS of non-activated (ACCS-0) and activated carbon (ACCS-1, ACCS-3 and ACCS-5) derived from cassava starch.
| C and O | C composition | ||||
|---|---|---|---|---|---|
| Sample | O (%) | C (%) | C–C/C=C (%) | C–O (%) | O–C=O (%) |
| ACCS-0 | 18.15 | 81.85 | 79.99 | 13.48 | 6.73 |
| ACCS-1 | 15.62 | 84.38 | 81.61 | 9.37 | 9.02 |
| ACCS-3 | 12.83 | 87.17 | 81.13 | 12.39 | 6.48 |
| ACCS-5 | 20.45 | 79.55 | 77.95 | 10.87 | 11.17 |
The surface morphology of all the activated carbon samples was explored by SEM as seen in figure 4. The SEM image of non-activated carbon (ACCS-0) in figure 4(a) shows the smooth surface without cavities or pores, while the formation of pores is presented in all activated carbon samples. By increasing the KOH concentration ratio from 1:1 to 1:5, the development of pores is observed on the surface of the activated carbon samples. The creation of those pores after KOH activation is beneficial for the electrochemical performance in order to promote the transportation and accessible of electrolyte ions [40]. It is also observed that the numbers of pore and pore size increase with increasing KOH concentration. As presented in figures 4(b)–(d), the ACCS-5 sample shows the largest pore size in comparison with ACCS-3 and ACCS-1 samples. The chemical reaction during the KOH activation process following the equations (4) and (5) caused the formation of those pores. After carbonization at 800 °C, K2CO3 decomposed into CO2, K2O and pores were formed and developed on the surface of the prepared activated samples [19]. Additionally, pore size increases with increasing KOH concentration. This maybe because higher KOH concentration can create stronger etching and expand during the reaction [41]. Therefore, KOH activating agent plays an important role for producing highly porous carbon.
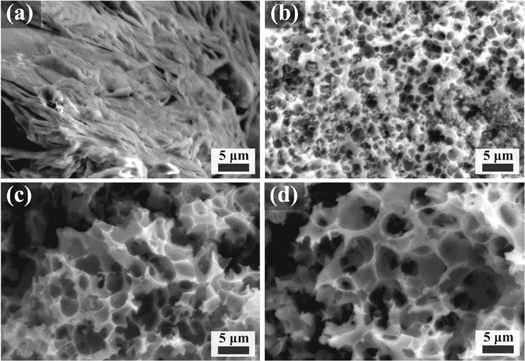
Figure 4. SEM images of non-activated carbon of (a) ACCS-0 and activated carbon of (b) ACCS-1, (c) ACCS-3 and (d) ACCS-5 samples.
Download figure:
Standard image High-resolution imageNitrogen adsorption-desorption isotherms were explored to investigate the specific surface area and porosity of non-activated and activated carbon samples. According to IUPAC classification, the isotherms of all activated carbon samples show the combination between type I and IV [42]. At low relative pressure (P/Po), the higher amount of nitrogen adsorption is presented in all activated samples in comparison with non-activated carbon indicating the characteristic of type I. In addition, the higher amount of nitrogen adsorption is observed with increasing the concentration ratio from 1:1 to 1:5 implying the higher micro porosity in the sample [42]. Moreover, the widening of the knee at low relative pressure of all activated carbon samples with increasing KOH concentration from 1:1 to 1:5 is also observed indicating the broadening of the micropore size [43] which is in good agreement with the SEM images as presented in figure 4. In comparison with non-activated carbon, the isotherm shows no characteristic of the microporous structure. Therefore, this result implies that the KOH concentration plays a significant role in the creation of microporous structure. At P/Po ranging from 0.3–1.0, the presence of a small hysteresis loop reveals the existence of mesopores in all activated carbon samples [26]. As the KOH concentration increase, the hysteresis loops are slightly different. Therefore, the N2 adsorption-desorption isotherms demonstrate the coexistence of micropore and mesopore in all activated carbon samples after KOH activation.
The BJH plots of pore distribution of all activated carbon samples are shown in figure 5(b). The calculation of pore size distribution using BJH method reveals that all activated carbon samples are in the range of 1–20 nm. This indicates that the specific surface area and various pore characters such as micropore and mesopore of carbon was modified by using KOH activation. The specific surface area and pore structure parameters of all activated carbon samples are summarized in table 2. Clearly, all activated carbon samples provide the higher specific surface area than the non-activated carbon sample. The ACCS-5 sample reaches the maximum specific surface area of 1350 m2 g−1 and pore volume of 0.7 cm3 g−1. This could be explained owning to the severe reaction between KOH and carbon surface in higher KOH concentration. The presence of mesopores with high specific surface area after KOH activation could be significantly improved the electrochemical performance of the carbon materials. The mesoporous structure and large surface area provide a fast electrolyte ion transfer, resulting in an increase of specific capacitance value [44]. In addition, the mean pore size as shown in table 2 increases from 1.89 to 2.15 nm with increasing the impregnation ratio from 1:1 to 1:5. The smaller pore size in ACCS-1 sample suggests the higher specific capacitance value since the electrolyte ions are easier accessible to the electroactive materials [45].

Figure 5. (a) N2 adsorption/desorption isotherms and (b) BJH pore distribution plots of non-activated (ACCS-0) and activated carbon (ACCS-1, ACCS-3 and ACCS-5) derived from cassava starch.
Download figure:
Standard image High-resolution imageTable 2. Pore structure parameters of non-activated (ACCS-0) and activated carbon (ACCS-1, ACCS-3 and ACCS-5) derived from cassava starch.
| Sample | BET surface area (m2 g−1) | Mean pore diameter (nm) | Total pore volume (cm3 g−1) | Cs (F g−1) |
|---|---|---|---|---|
| ACCS-0 | 14.80 | 5.06 | 0.02 | 47 ± 0 |
| ACCS-1 | 1049 | 1.89 | 0.49 | 175 ± 12 |
| ACCS-3 | 1335 | 1.92 | 0.64 | 153 ± 14 |
| ACCS-5 | 1350 | 2.15 | 0.72 | 152 ± 13 |
3.2. Electrochemical properties
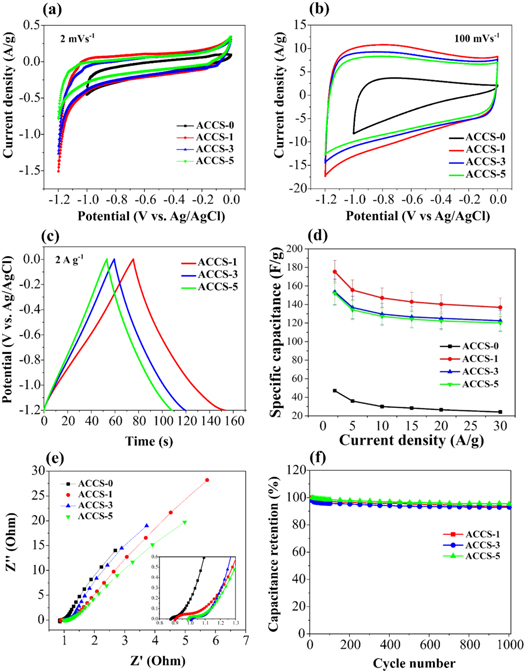
The electrochemical properties of the activated carbon were studied by using three-electrode cell. Cyclic voltammetry (CV) curves of non-activated carbon and all activated carbon samples were measured in 6M NaOH electrolyte at scan rate of 2 mV s−1. As shown in figure 6(a), CV curve of non-activated carbon (ACCS-0) exhibits the smaller potential window of 1 V than those activated carbon samples of ACCS-1, ACCS-3 and ACCS-5 having the potential of 1.2 V. For activated carbon, the ACCS-1 sample shows the maximum area under CV curve, suggesting the highest specific capacitance value in this sample. All CV curves of the activated carbon samples at scan rate of 100 mV s−1 in figure 6(b) present an ideal rectangular shape, implying a characteristic of the EDLC behavior in which quick charging and discharging or fast electrolyte ions diffusion taking place at the interface of electrode material [29]. Figure 6(c) shows the GCD curves which are almost linear suggesting a good capacitive behavior in these electrodes. The specific capacitance value of all activated carbon electrodes was calculated from discharging GCD curves at the current density of 2 A g−1 by using equation (1). As presented in the figure 6(d), the ACCS-1 sample reaches the highest specific capacitance value of 175 ± 12 F g−1. On the other hand, the ACCS-3 and ACCS-5 electrodes provide the specific capacitance values of 153 ± 14 F g−1 and 152 ± 13 F g−1, respectively. Referring to table 2, the smaller pore diameter (1.89 nm) in the ACCS-1 sample causes the higher specific capacitance value. This can be explained due to the size of pore in ACCS-1 sample is closer to the solvated ion size of K+ (0.33 nm) [46] and thereby the easy electrolyte ions diffuse into the micropores [47]. While only the specific capacitance value of 47 ± 0 F g−1 is provided from the non-porous structure of ACCS-0 electrode. In comparison, the activated carbon prepared from different starch resources is summarized in table 3. It is well known that the specific capacitance value decreases with increasing current density. The activated carbon prepared from cassava starch as presented in table 3 delivers a high specific capacitance value at the current density of 2 A g−1 which is higher than the activated carbon prepared from other starch resources measured at lower current densities. Therefore, this result implies an excellent electrochemical performance of activated carbon derived from cassava starch. Moreover, the specific capacitance value of the activated carbon electrode was also compared with other activated carbon electrodes prepared from similar activation process by using KOH as activating agent. The results are summarized in table 4. As a result, the activated carbon electrode derived from cassava starch provides the excellent electrochemical performance among those electrodes.
Figure 6. Comparison of CV curve at (a) 2 m Vs−1 and (b) 100 m Vs−1. Comparison of (c) GCD curve and (d) the calculated specific capacitance values at different current densities. (e) Nyquist plots of non-activated and activated carbons derived from cassava starch, and (f) Long cycle life of activated carbon (ACCS-1, ACCS-3, and ACCS-5 samples) measured in 6 M NaOH electrolyte.
Download figure:
Standard image High-resolution image
Table 3. Comparison of the specific capacitance value of activated carbon obtained from different starch resources.
| Raw material | SBET (m2 g−1) | Cs (F g−1) | Current density (A g−1) | References |
|---|---|---|---|---|
| Konjaku Flour | 1403 | 216 | 1 | [48] |
| Potato starch (carbon fiber) | 1930 | 268 | 0.5 | [49] |
| Potato starch | 2342 | 335 | 0.05 | [50] |
| Corn starch | 1239 | 144 | 0.625 | [51] |
| Cassava starch | 1049 | 175 | 2 | This work |
Table 4. Comparison of the specific capacitance value of activated carbon obtained from chemical activation method using KOH as activating agent.
| Raw material | CS (F g−1) | Current density (A g−1) | Retention (%) | References |
|---|---|---|---|---|
| Waste coffee grounds | 175 | 1 | — | [52] |
| Gulfweed | 140–260 | 2 | 92 | [53] |
| Waste tea leaves | 275–330 | 1 | 92 | [21] |
| Biomass Refinery Wastes | 75–180 | 2 | — | [54] |
| Cork | 296 | 0.1 | 99.5 | [55] |
| Corn straw | 285 | 0.5 | 91.3 | [56] |
| Cassava starch | 175 | 2 | 98 | This work |
The electrochemical performance of all activated carbon electrodes was also explored by using electrochemical impedance spectroscopy (EIS). In figure 6(e), the EIS results are presented as the Nyquist plot of all activated carbon electrodes. The intercept of Z' axis in figure 6(e) known as the solution resistance (Rs) indicates that the Rs value of non-activated carbon electrode is lower than the activated carbon electrode. Furthermore, the Rs value tends to increase with increasing KOH concentration. The lower Rs value provides an increase of the electrolyte and electrode/current collector interface conductivities, resulting in an increasing of the specific capacitance value [57]. Therefore, the lowest Rs value causes the highest specific capacitance value in ACCS-1 sample. Moreover, the long cycle life of all activated carbon samples was measured by repeating charge and discharge at current density of 5 A g−1 for 1000 cycles. The results show that the capacitance retention in figure 6(f) retains about 93.6, 93.0, and 95.3% in ACCS-1, ACCS-3, and ACCS-5 samples, respectively. This indicates that the activated carbon electrodes prepared from cassava starch provides a good cyclic stability after long time cycling. To sum up, the best electrochemical performance such as high specific capacitance value and good cyclic stability of activated carbon prepared from cassava starch at the impregnation ratio of 1:1 may attribute to the smaller pore diameter with providing more active site than larger pore diameter.
4. Conclusions
In this work, the activated carbon with a high specific surface area was obtained from cassava starch through chemical activation process using KOH as activating agent. The effect of the impregnation ratio by weight between cassava starch:KOH on the electrochemical performance was studied. By varying the impregnation ratio, the development of porosity changed significantly. The specific surface area and mean pore diameter increases from 1049 to1350 m2 g−1 and 1.89 to 2.15 nm with increasing the impregnation ratio, respectively. Interestingly, the smaller mean pore diameter (1.89 nm) at the impregnation ratio of 1:1 provides the higher specific capacitance value of 175 ± 12 F g−1 at current density of 2 A g−1. The possible reason is that the size of pore is closer to the size of the solvated K+ ion (0.33 nm), leading to the easy electrolyte ions diffuse into the micropore. In addition, the capacitance retains about 94% after repeating charge/discharge measurements for 1000 cycles. Therefore, this work demonstrates that the activated carbon prepared from cassava starch is promising candidate electroactive materials for supercapacitor applications.
Acknowledgments
The authors would like to thank the SUT-NANOTEC-SLRI joint research facility (BL5.3), Synchrotron Light Research Institute (Public Organization), Nakhon Ratchasima, Thailand for XPS facilities. This work was supported by Suranaree University of Technology (SUT) and by Office of the Higher Education Commission under NRU Project of Thailand and SUT- NANOTEC RNN on Nanomaterials and Advanced Characterizations, Suranaree University of Technology, Nakhon Ratchasima, Thailand.